| Param | Original file | Final file |
|---|---|---|
| Filename | modeM0/AS1A12_051T01_9000005394_38789cztM0_level2.fits | modeM0/AS1A12_051T01_9000005394_38789cztM0_level2_quad_clean.evt |
| Size (bytes) | 595,203,840 | 128,747,520 |
| Size | 567.6 MB | 122.8 MB |
| Events in quadrant A | 3,994,192 | 893,591 |
| Events in quadrant B | 5,972,598 | 870,707 |
| Events in quadrant C | 6,902,299 | 766,101 |
| Events in quadrant D | 4,536,054 | 806,012 |
| Mode SS | |||
|---|---|---|---|
| Quadrant | BADHDUFLAG | Total packets | Discarded packets |
| A | 0 | 166 | 0 |
| B | 0 | 166 | 0 |
| C | 0 | 166 | 0 |
| D | 0 | 166 | 0 |
| Mode M0 | |||
|---|---|---|---|
| Quadrant | BADHDUFLAG | Total packets | Discarded packets |
| A | 0 | 16910 | 2 |
| B | 0 | 23132 | 2 |
| C | 0 | 25773 | 2 |
| D | 0 | 18981 | 2 |
| Mode M9 | |||
|---|---|---|---|
| Quadrant | BADHDUFLAG | Total packets | Discarded packets |
| A | 0 | 26 | 0 |
| B | 0 | 26 | 0 |
| C | 0 | 26 | 0 |
| D | 0 | 26 | 0 |
| Quadrant | Total seconds | Saturated seconds | Saturation percentage |
|---|---|---|---|
| A | 8082 | 15 | 0.185598% |
| B | 8082 | 534 | 6.607275% |
| C | 8082 | 1029 | 12.731997% |
| D | 8082 | 79 | 0.977481% |
Noise dominated data is calculated using 1-second bins in cleaned event files. If a bin has >2000 counts, and if more than 50% of those come from <1% of pixels, then it is considered to be noise-dominated and hence unusable.
| Quadrant | # 1 sec bins | Bins with >0 counts | Bins with >2000 counts | High rate bins dominated by noise | Noise dominated (total time) | Noise dominated (detector-on time) | Marked lightcurve |
|---|---|---|---|---|---|---|---|
| A | 10707 | 8084 | 2 | 2 | 0.02% | 0.02% | 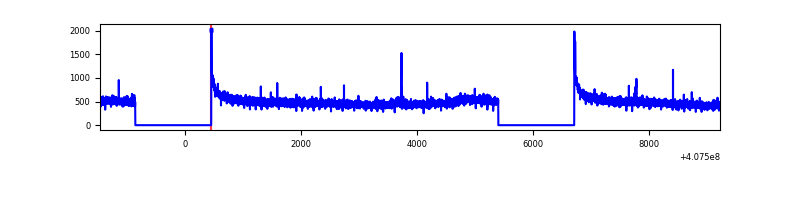 |
| B | 10707 | 8084 | 406 | 406 | 3.79% | 5.02% | 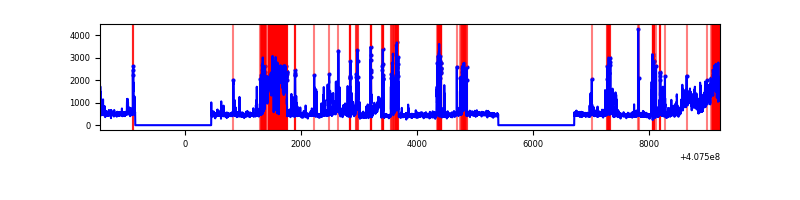 |
| C | 10707 | 8084 | 984 | 984 | 9.19% | 12.17% | 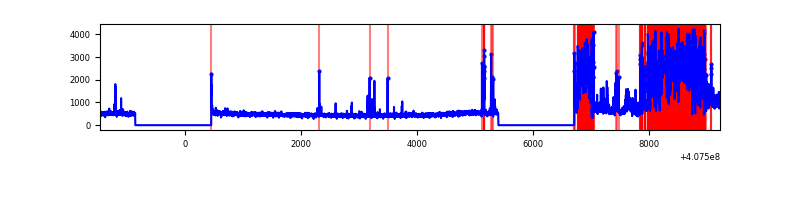 |
| D | 10707 | 8084 | 63 | 63 | 0.59% | 0.78% | 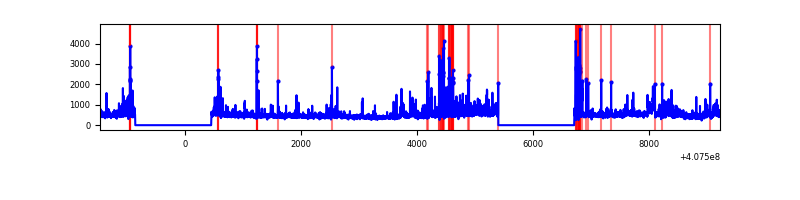 |
Top three noisy pixels from each quadrant. If the there are fewer than three noisy pixels in the level2.evt file, extra rows are filled as -1
| Pixel properties | Quadrant properties | ||||||
|---|---|---|---|---|---|---|---|
| Quadrant | DetID | PixID | Counts | Sigma | Mean | Median | Sigma |
| A | 10 | 83 | 506966 | 2804.55 | 892 | 874 | 180.5 |
| A | 13 | 254 | 13978 | 72.62 | 892 | 874 | 180.5 |
| A | 12 | 16 | 11415 | 58.41 | 892 | 874 | 180.5 |
| B | 5 | 200 | 1478662 | 8682.89 | 871 | 843 | 170.2 |
| B | 4 | 171 | 708051 | 4155.19 | 871 | 843 | 170.2 |
| B | 5 | 184 | 290260 | 1700.46 | 871 | 843 | 170.2 |
| C | 14 | 254 | 3294632 | 17199.75 | 818 | 822 | 191.5 |
| C | 15 | 214 | 334025 | 1739.93 | 818 | 822 | 191.5 |
| C | 0 | 239 | 42871 | 219.57 | 818 | 822 | 191.5 |
| D | 5 | 222 | 470732 | 2253.16 | 860 | 840 | 208.5 |
| D | 2 | 249 | 277246 | 1325.39 | 860 | 840 | 208.5 |
| D | 2 | 16 | 208676 | 996.59 | 860 | 840 | 208.5 |
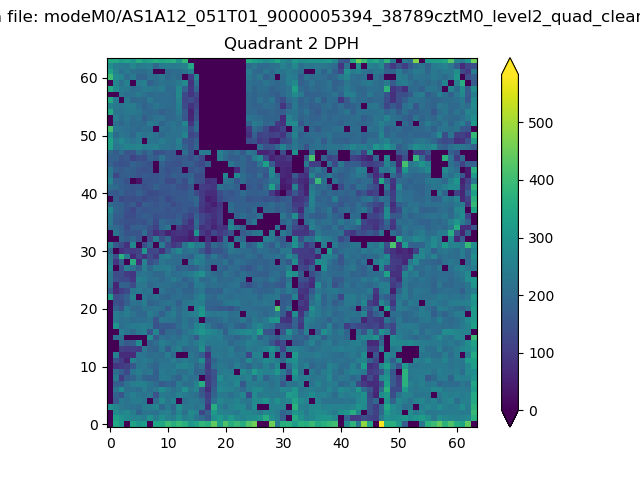
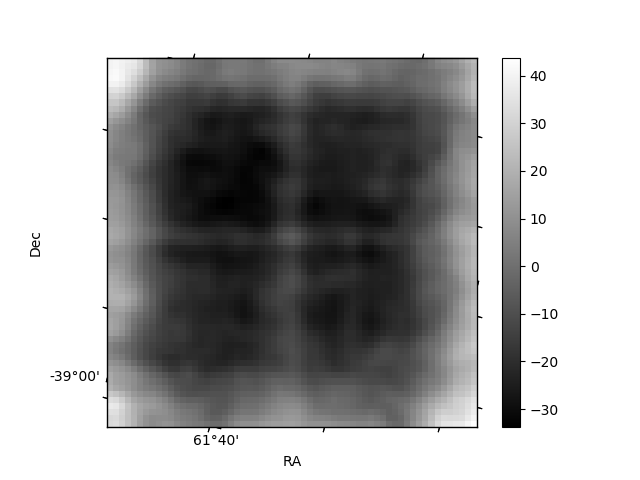
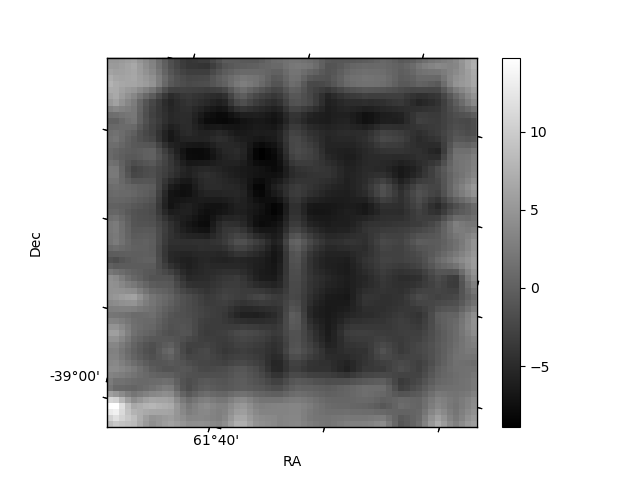
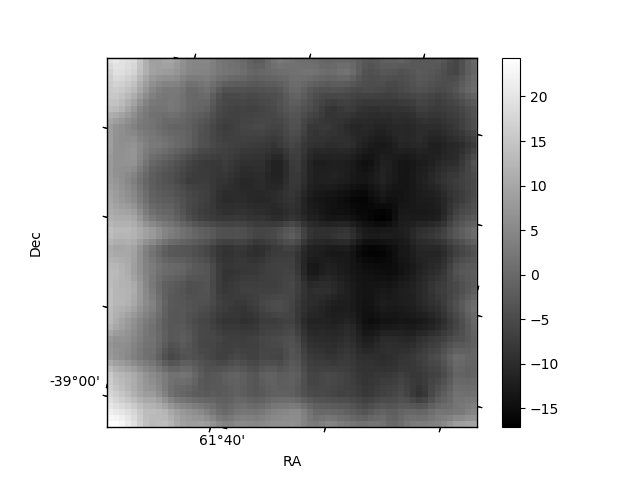
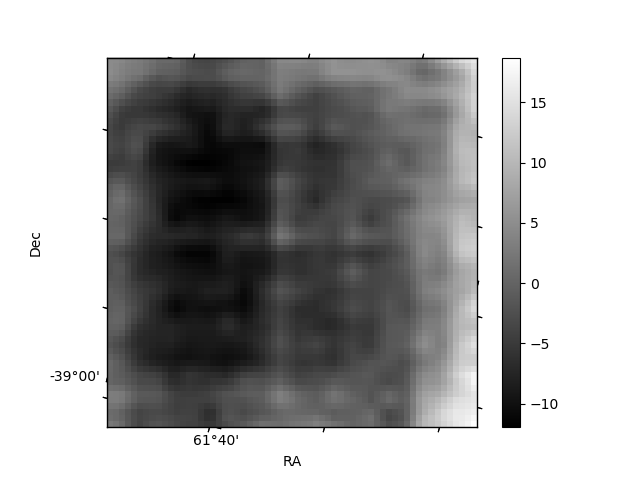
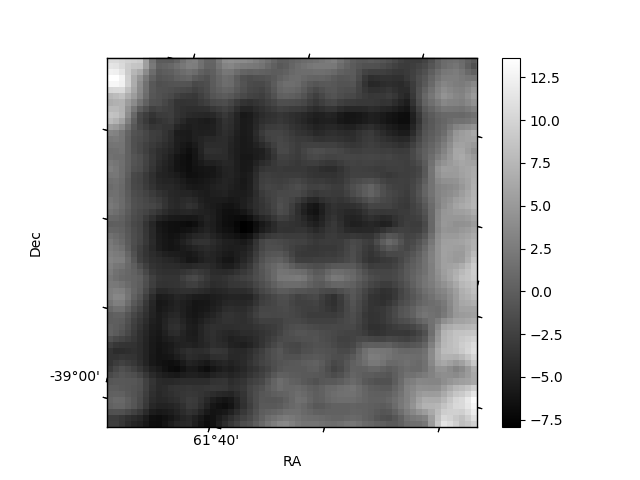
Histogram calculated using DETX and DETY for each event in the final _common_clean file
| Quadrant A | 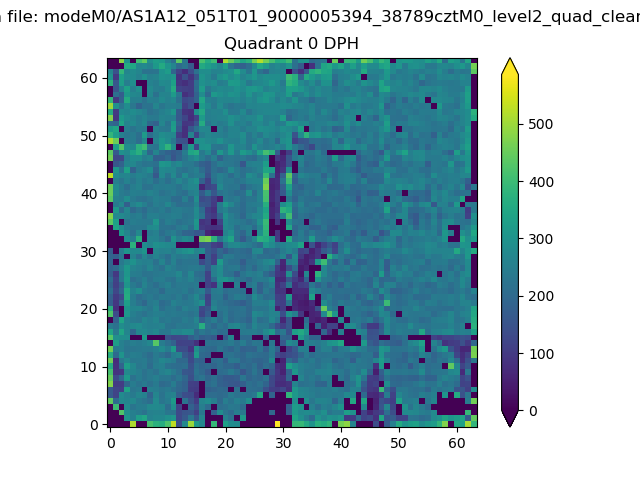 |
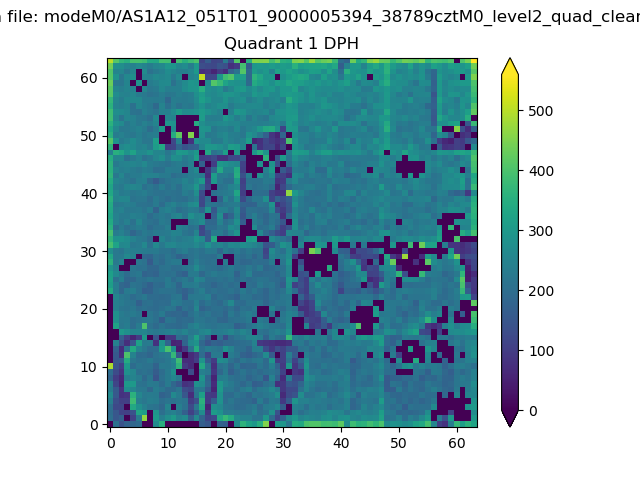 |
Quadrant B |
|---|---|---|---|
| Quadrant D | 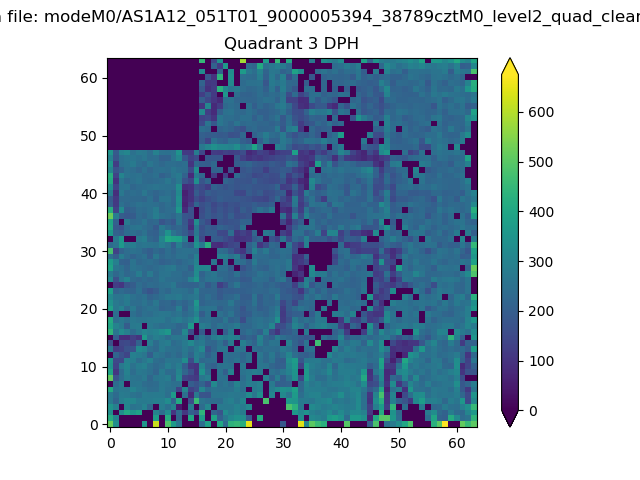 |
 |
Quadrant C |
| Plot type | Count rate plots | Images |
|---|---|---|
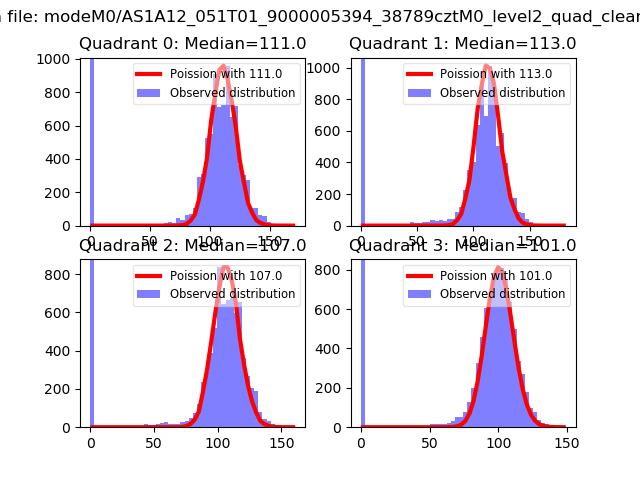
| Comparison with Poisson distribution Blue bars denote a histogram of data divided into 1 sec bins. Red curve is a Poisson curve with rate = median count rate of data. |
 |
 |
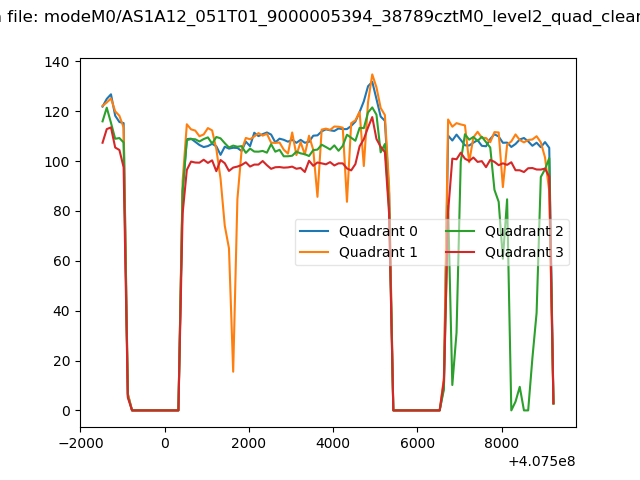
| Quadrant-wise count rates Data is divided into 100 sec bins |
 |
|
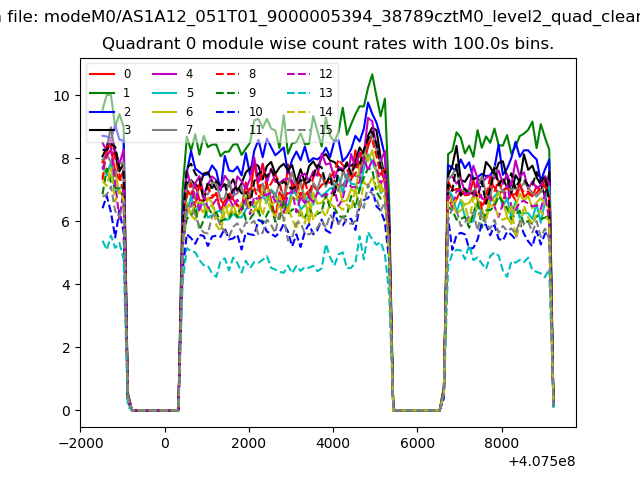
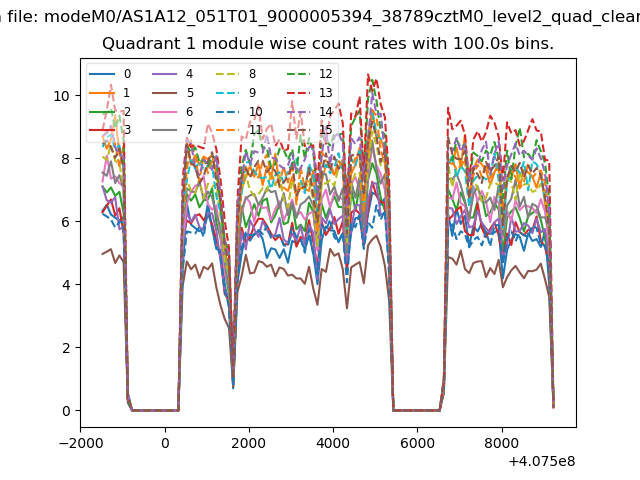
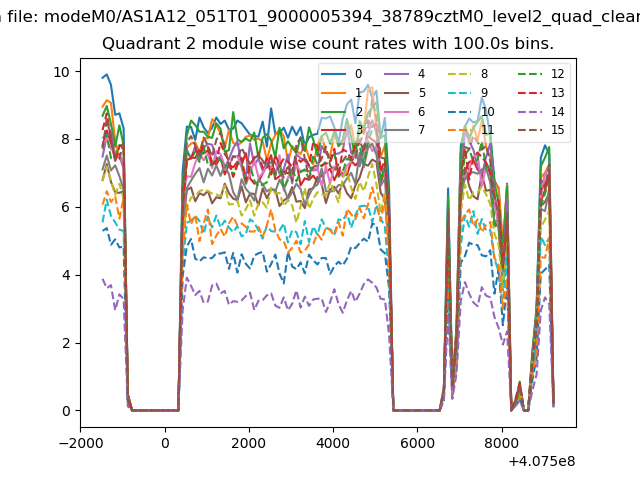
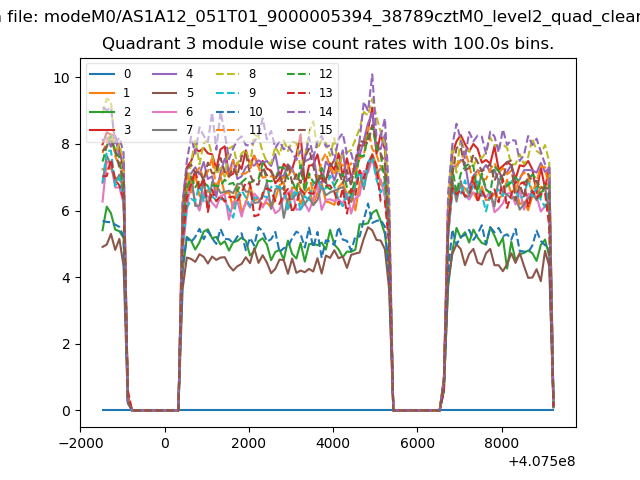
| Module-wise count rates for Quadrant A Data is divided into 100 sec bins |
 |
 |
| Module-wise count rates for Quadrant B Data is divided into 100 sec bins |
 |
 |
| Module-wise count rates for Quadrant C Data is divided into 100 sec bins |
 |
 |
| Module-wise count rates for Quadrant D Data is divided into 100 sec bins |
 |
 |
| Parameter | Plot |
|---|---|
| CZT HV Monitor | 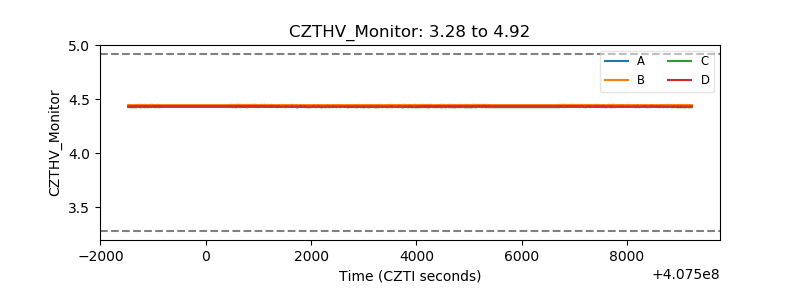 |
| D_VDD | 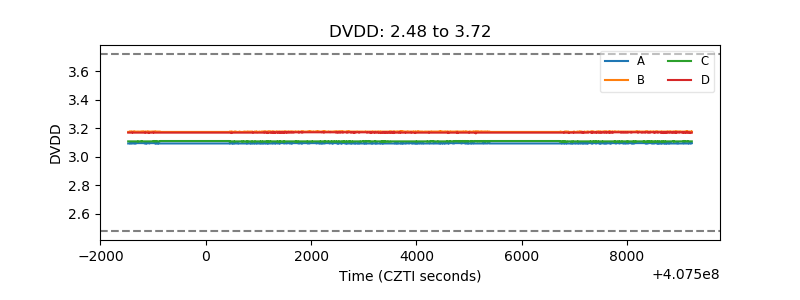 |
| Temperature 1 | 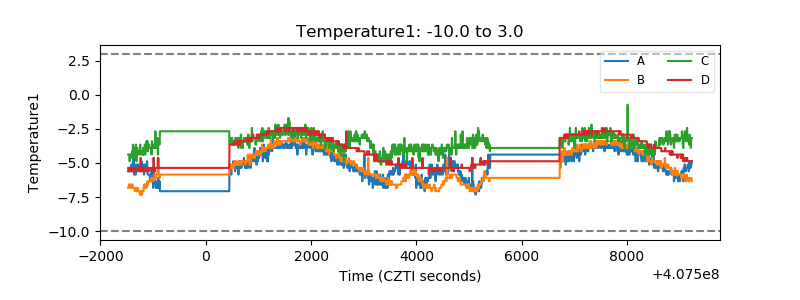 |
| Veto HV Monitor | 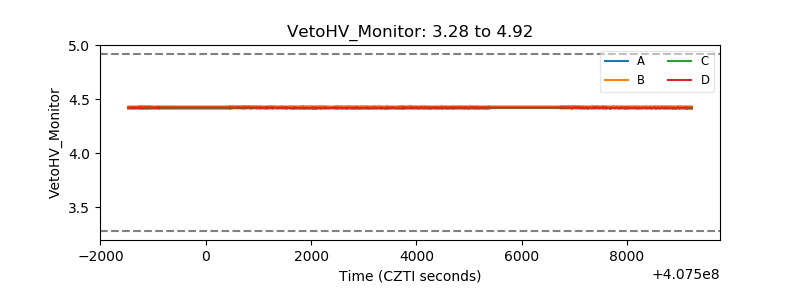 |
| Veto LLD | 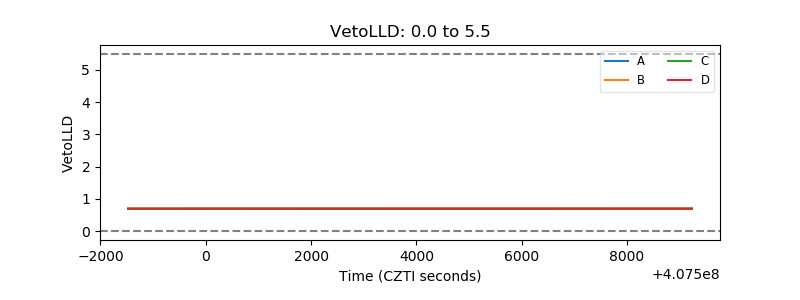 |
| Alpha Counter | 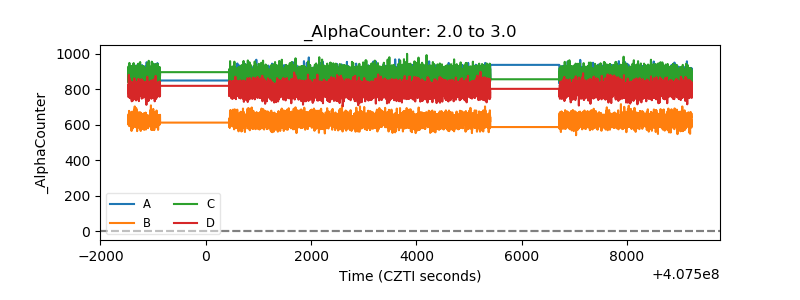 |
| _CPM_Rate | 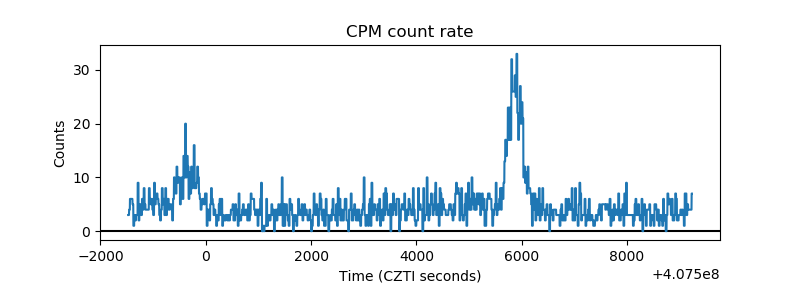 |
| CZT Counter | 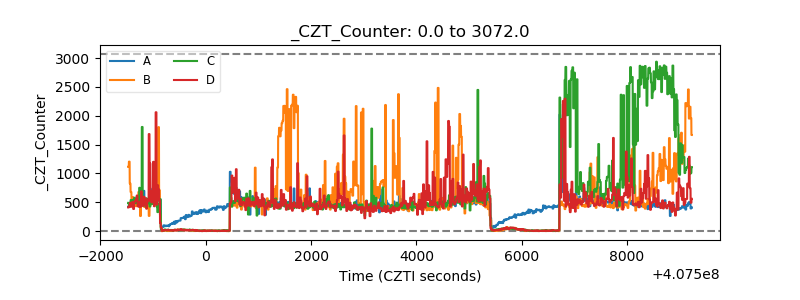 |
| +2.5 Volts monitor |  |
| +5 Volts monitor | 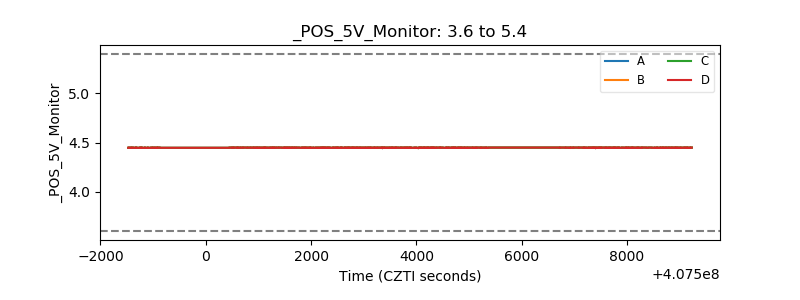 |
| _ROLL_ROT | 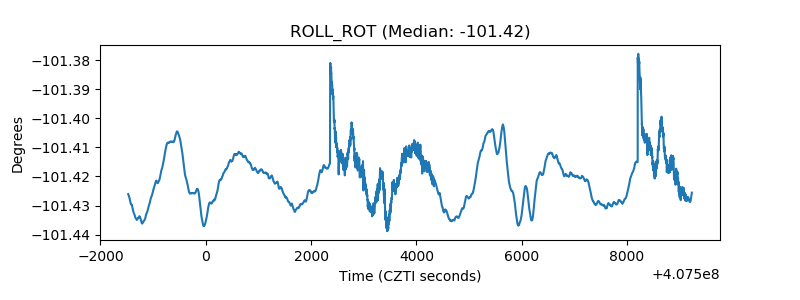 |
| _Roll_DEC | 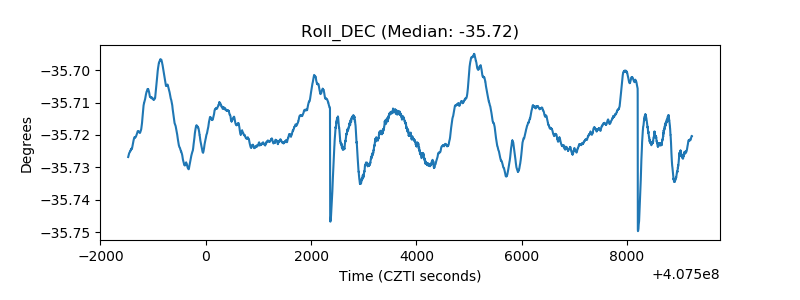 |
| _Roll_RA | 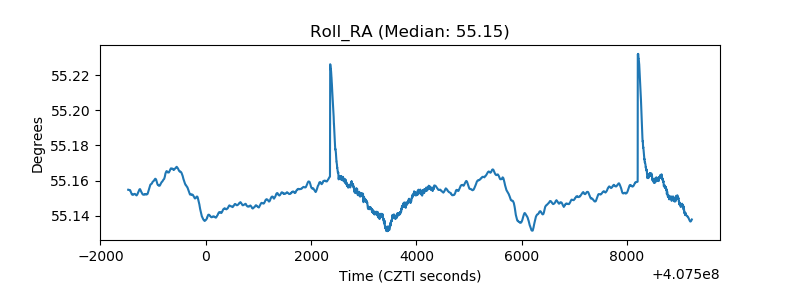 |
| Veto Counter | 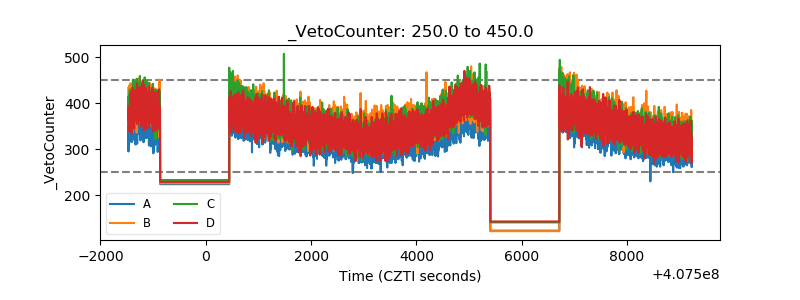 |