| Param | Original file | Final file |
|---|---|---|
| Filename | modeM0/AS1A12_044T04_9000005396_38789cztM0_level2.fits | modeM0/AS1A12_044T04_9000005396_38789cztM0_level2_quad_clean.evt |
| Size (bytes) | 511,375,680 | 121,492,800 |
| Size | 487.7 MB | 115.9 MB |
| Events in quadrant A | 3,769,582 | 825,507 |
| Events in quadrant B | 3,901,533 | 835,270 |
| Events in quadrant C | 4,449,478 | 787,309 |
| Events in quadrant D | 6,232,872 | 713,700 |
| Mode M0 | |||
|---|---|---|---|
| Quadrant | BADHDUFLAG | Total packets | Discarded packets |
| A | 0 | 15821 | 3 |
| B | 0 | 16573 | 2 |
| C | 0 | 18032 | 2 |
| D | 0 | 23622 | 2 |
| Mode SS | |||
|---|---|---|---|
| Quadrant | BADHDUFLAG | Total packets | Discarded packets |
| A | 0 | 154 | 0 |
| B | 0 | 154 | 0 |
| C | 0 | 154 | 0 |
| D | 0 | 154 | 0 |
| Mode M9 | |||
|---|---|---|---|
| Quadrant | BADHDUFLAG | Total packets | Discarded packets |
| A | 0 | 29 | 0 |
| B | 0 | 29 | 0 |
| C | 0 | 29 | 0 |
| D | 0 | 29 | 0 |
| Quadrant | Total seconds | Saturated seconds | Saturation percentage |
|---|---|---|---|
| A | 7423 | 18 | 0.242490% |
| B | 7423 | 114 | 1.535767% |
| C | 7423 | 121 | 1.630069% |
| D | 7423 | 366 | 4.930621% |
Noise dominated data is calculated using 1-second bins in cleaned event files. If a bin has >2000 counts, and if more than 50% of those come from <1% of pixels, then it is considered to be noise-dominated and hence unusable.
| Quadrant | # 1 sec bins | Bins with >0 counts | Bins with >2000 counts | High rate bins dominated by noise | Noise dominated (total time) | Noise dominated (detector-on time) | Marked lightcurve |
|---|---|---|---|---|---|---|---|
| A | 10348 | 7425 | 2 | 2 | 0.02% | 0.03% | 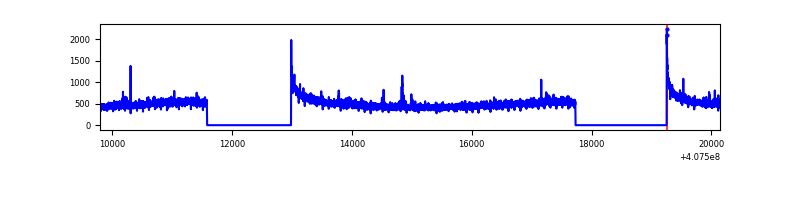 |
| B | 10348 | 7425 | 56 | 56 | 0.54% | 0.75% | 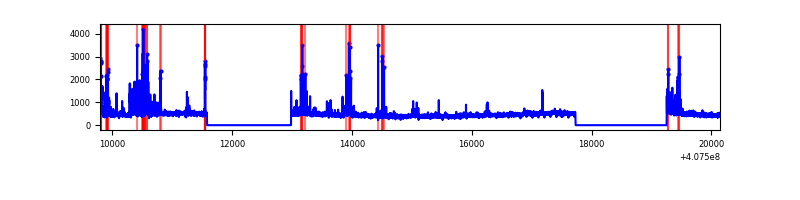 |
| C | 10348 | 7425 | 92 | 92 | 0.89% | 1.24% | 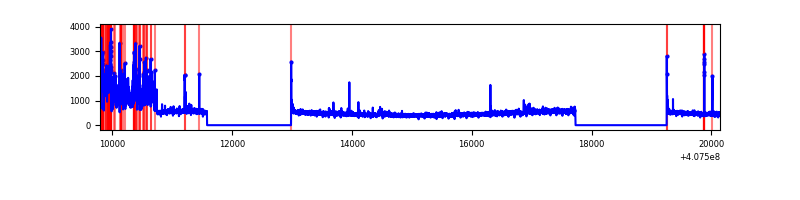 |
| D | 10348 | 7425 | 379 | 379 | 3.66% | 5.10% | 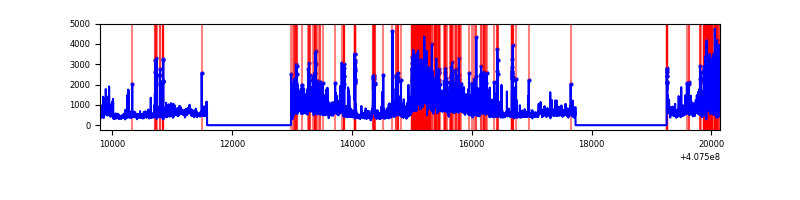 |
Top three noisy pixels from each quadrant. If the there are fewer than three noisy pixels in the level2.evt file, extra rows are filled as -1
| Pixel properties | Quadrant properties | ||||||
|---|---|---|---|---|---|---|---|
| Quadrant | DetID | PixID | Counts | Sigma | Mean | Median | Sigma |
| A | 10 | 83 | 525315 | 3106.88 | 828 | 809 | 168.8 |
| A | 13 | 254 | 13661 | 76.13 | 828 | 809 | 168.8 |
| A | 9 | 143 | 11607 | 63.96 | 828 | 809 | 168.8 |
| B | 4 | 171 | 433512 | 2687.05 | 825 | 801 | 161.0 |
| B | 5 | 184 | 83392 | 512.87 | 825 | 801 | 161.0 |
| B | 15 | 85 | 49282 | 301.06 | 825 | 801 | 161.0 |
| C | 14 | 254 | 896867 | 4721.26 | 804 | 807 | 189.8 |
| C | 15 | 214 | 325617 | 1711.4 | 804 | 807 | 189.8 |
| C | 2 | 16 | 33274 | 171.07 | 804 | 807 | 189.8 |
| D | 12 | 235 | 1504991 | 7765.05 | 790 | 766 | 193.7 |
| D | 5 | 222 | 818995 | 4223.83 | 790 | 766 | 193.7 |
| D | 2 | 249 | 316856 | 1631.71 | 790 | 766 | 193.7 |
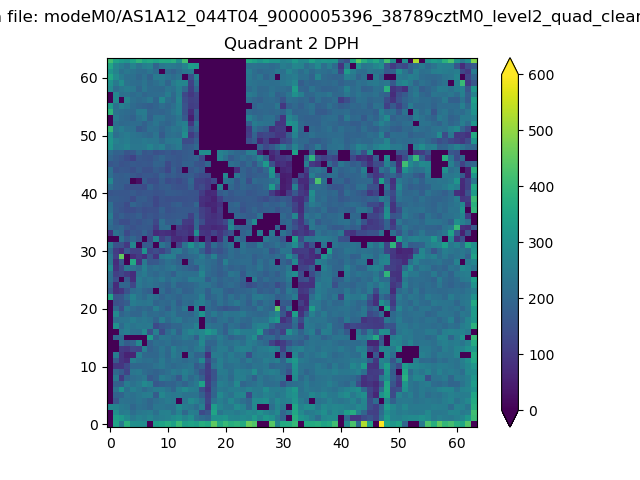
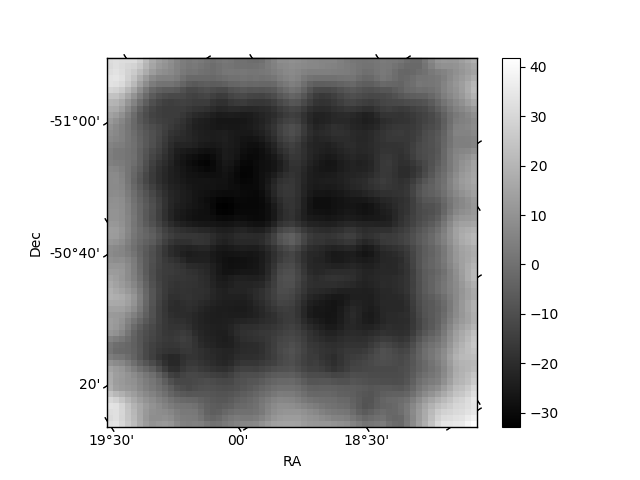
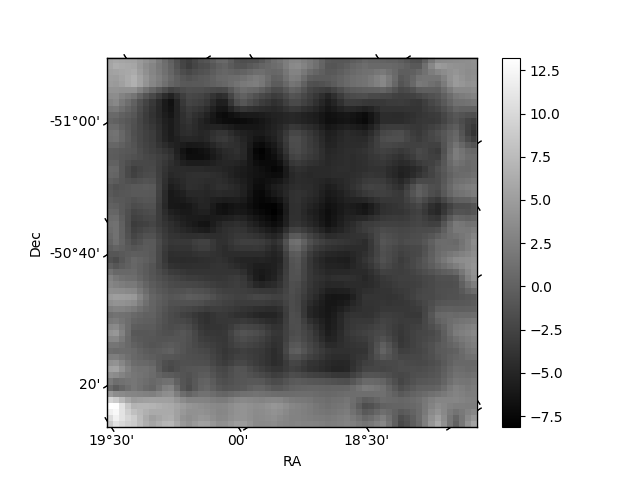
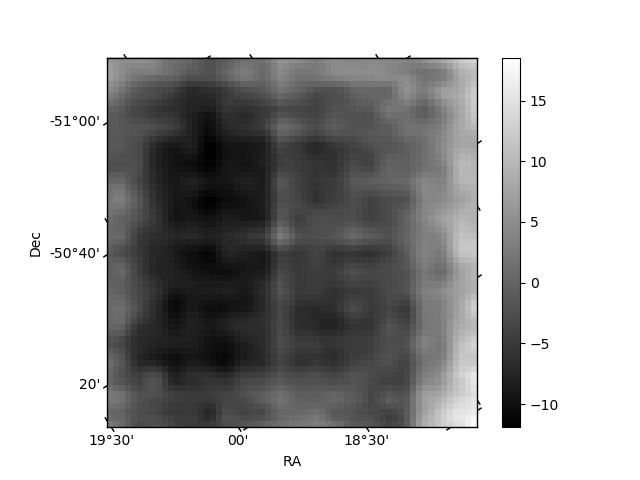
Histogram calculated using DETX and DETY for each event in the final _common_clean file
| Quadrant A | 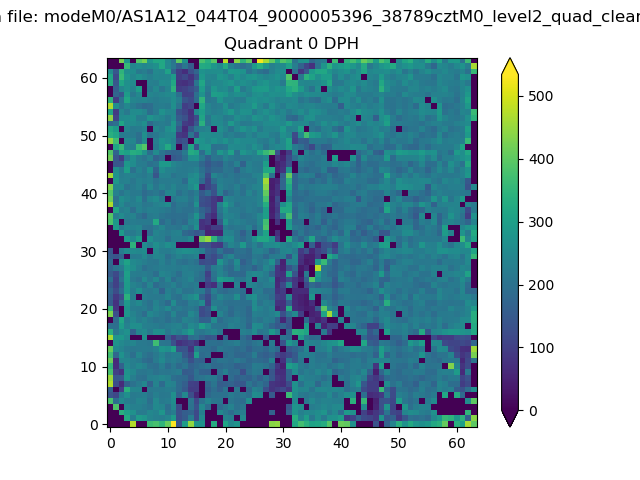 |
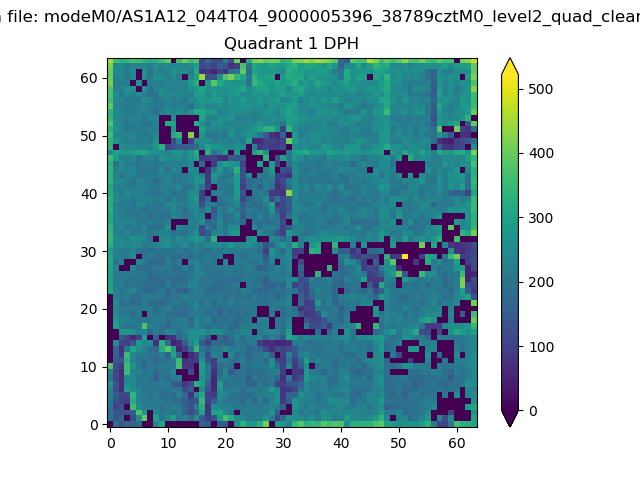 |
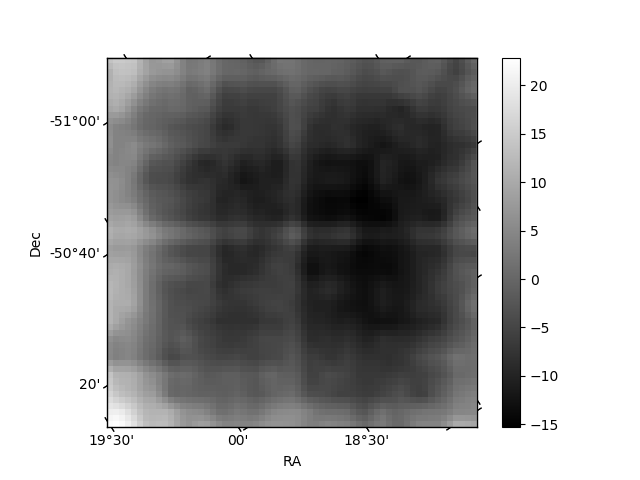
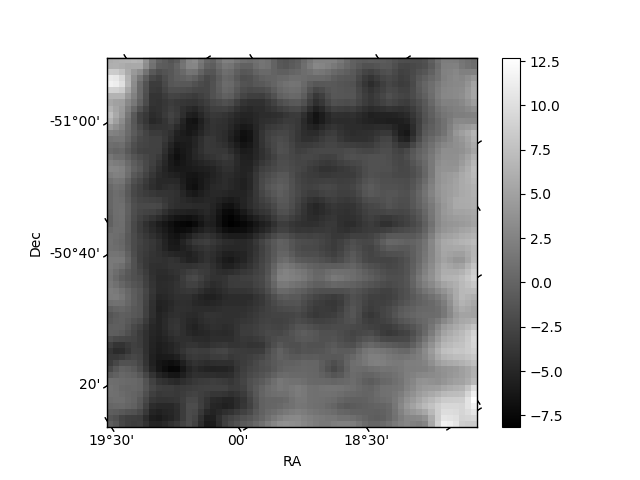
Quadrant B |
|---|---|---|---|
| Quadrant D | 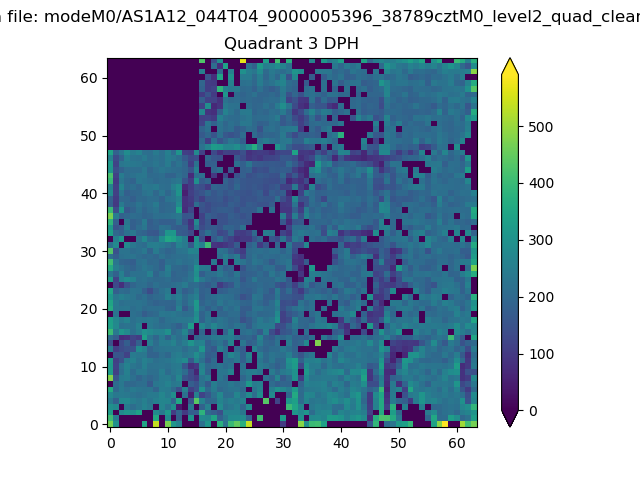 |
 |
Quadrant C |
| Plot type | Count rate plots | Images |
|---|---|---|
| Comparison with Poisson distribution Blue bars denote a histogram of data divided into 1 sec bins. Red curve is a Poisson curve with rate = median count rate of data. |
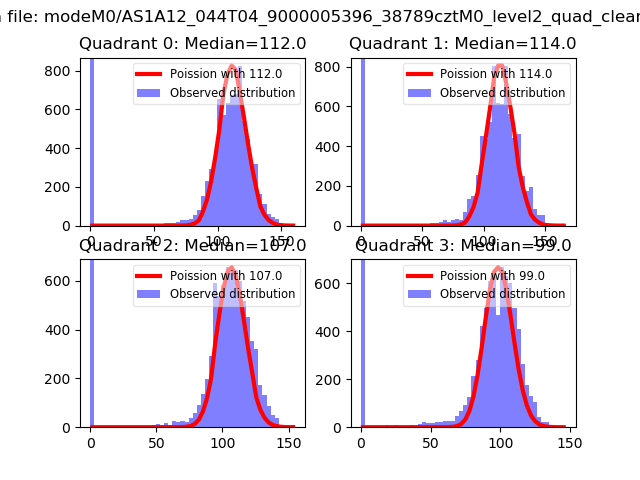 |
 |
| Quadrant-wise count rates Data is divided into 100 sec bins |
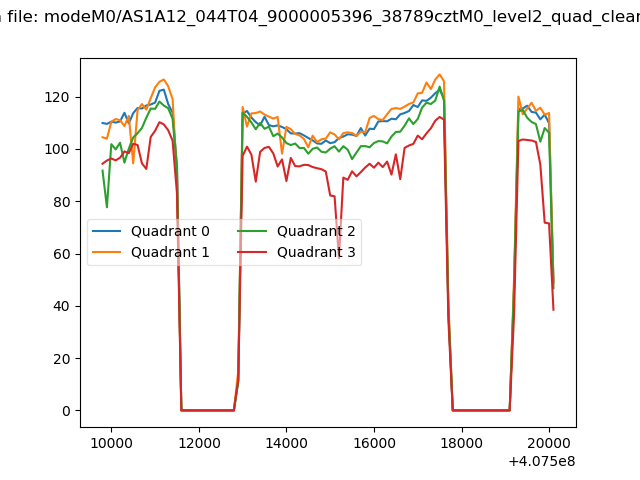 |
|
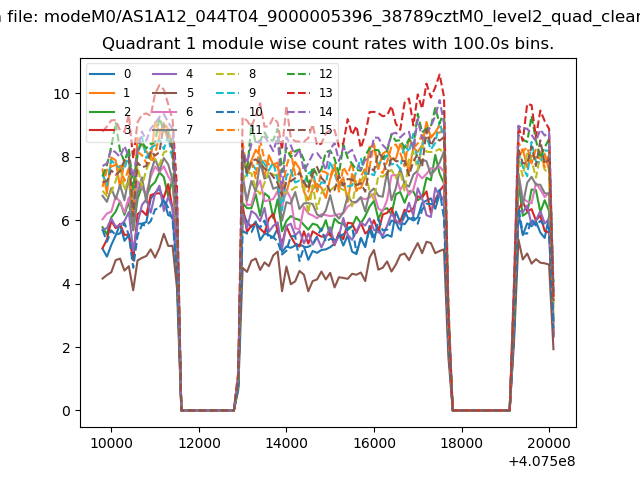
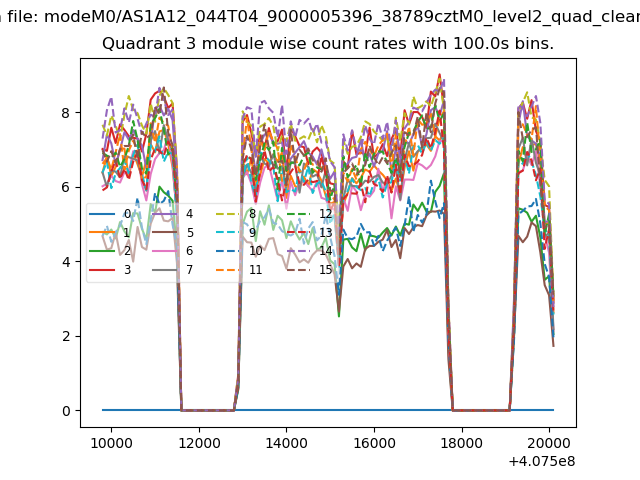
| Module-wise count rates for Quadrant A Data is divided into 100 sec bins |
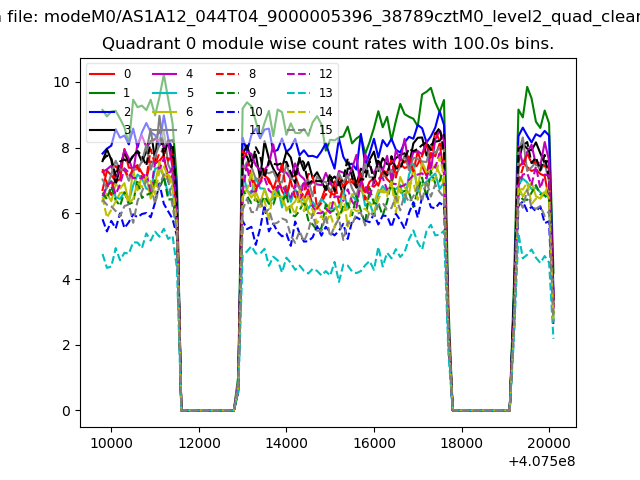 |
 |
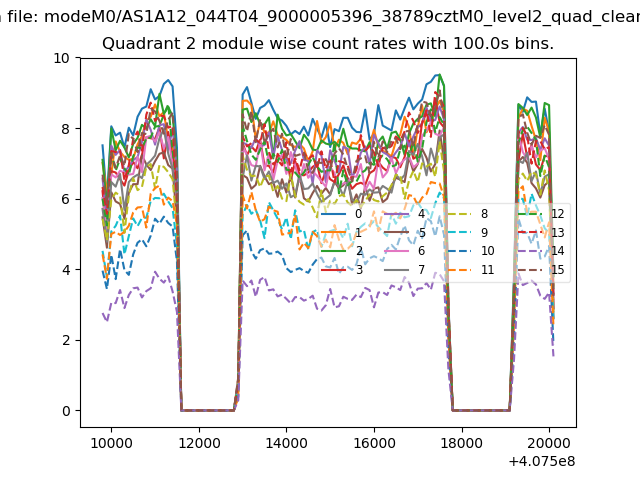
| Module-wise count rates for Quadrant B Data is divided into 100 sec bins |
 |
 |
| Module-wise count rates for Quadrant C Data is divided into 100 sec bins |
 |
 |
| Module-wise count rates for Quadrant D Data is divided into 100 sec bins |
 |
 |
| Parameter | Plot |
|---|---|
| CZT HV Monitor | 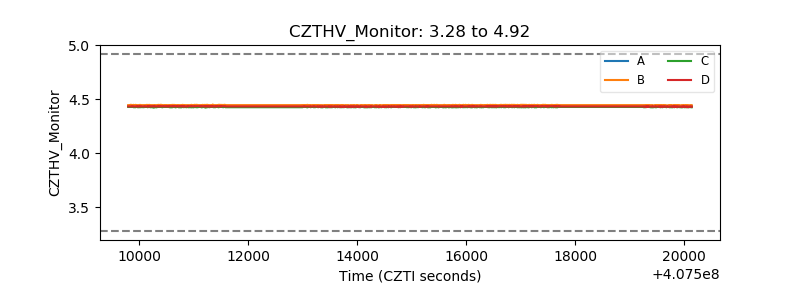 |
| D_VDD | 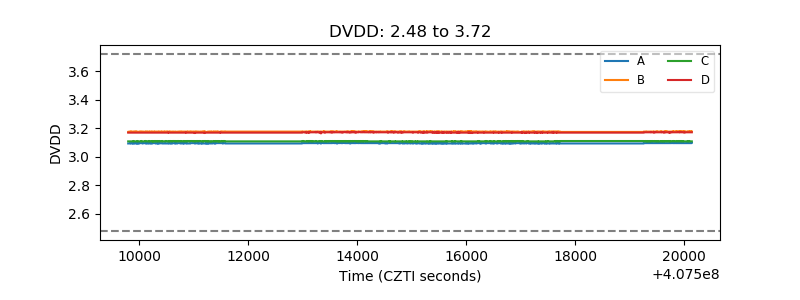 |
| Temperature 1 | 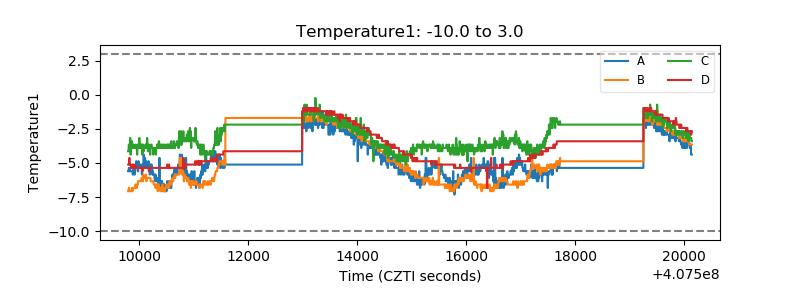 |
| Veto HV Monitor | 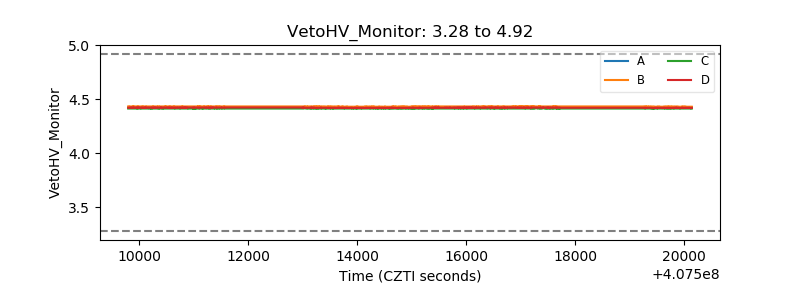 |
| Veto LLD | 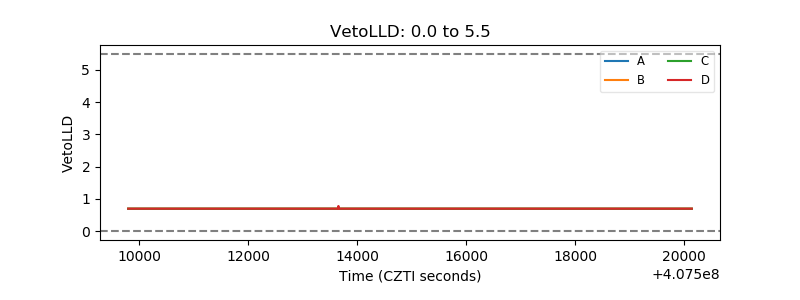 |
| Alpha Counter | 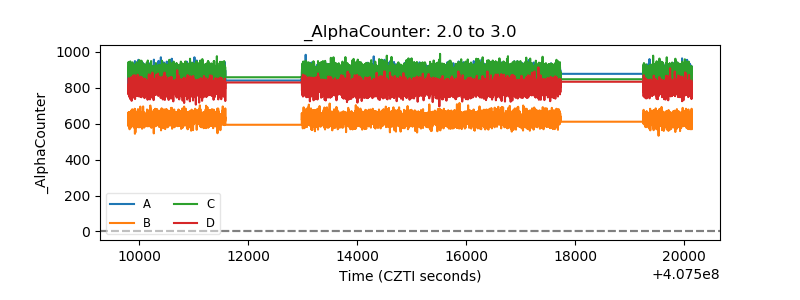 |
| _CPM_Rate | 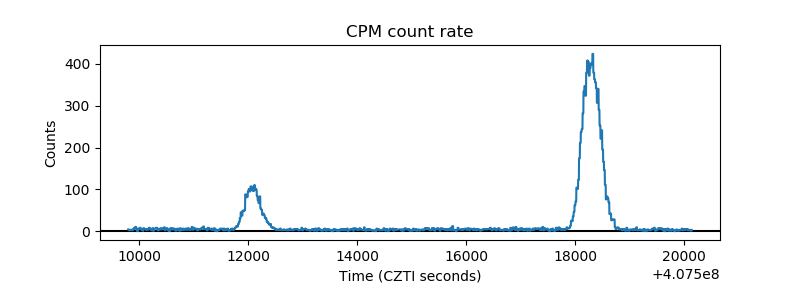 |
| CZT Counter | 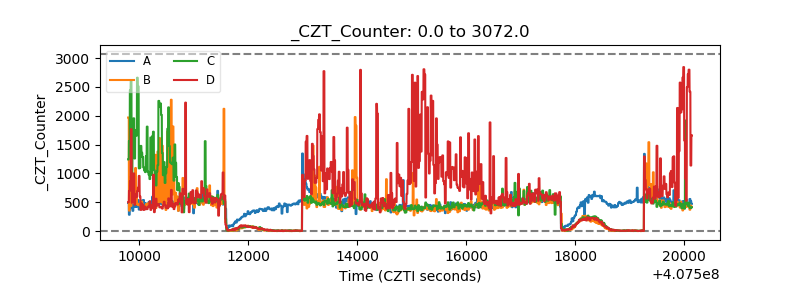 |
| +2.5 Volts monitor | 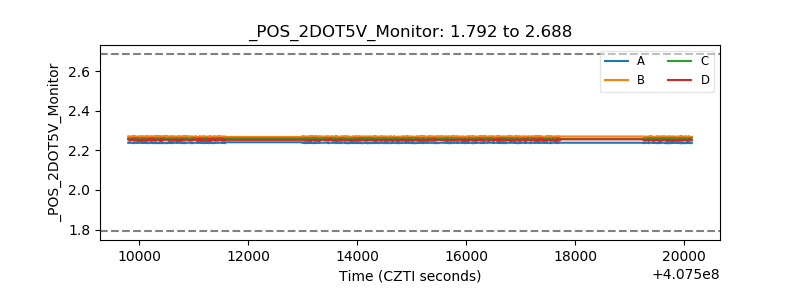 |
| +5 Volts monitor | 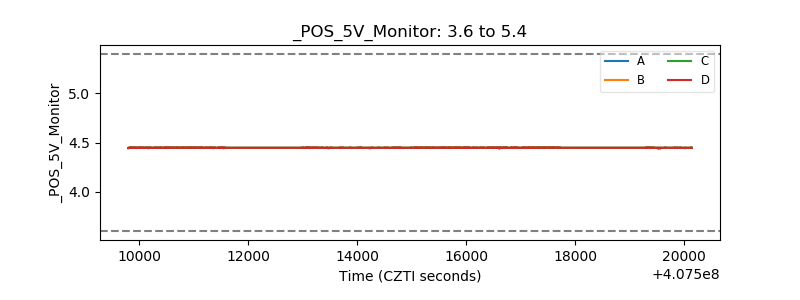 |
| _ROLL_ROT | 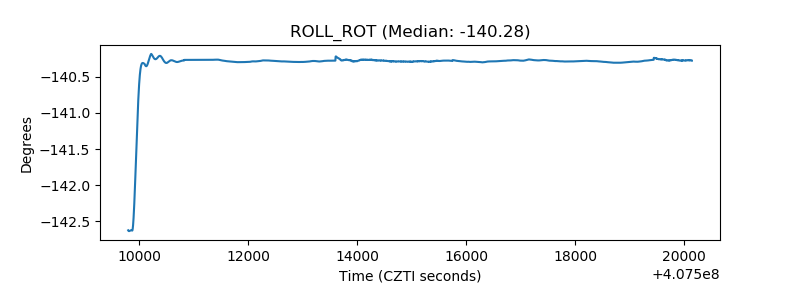 |
| _Roll_DEC | 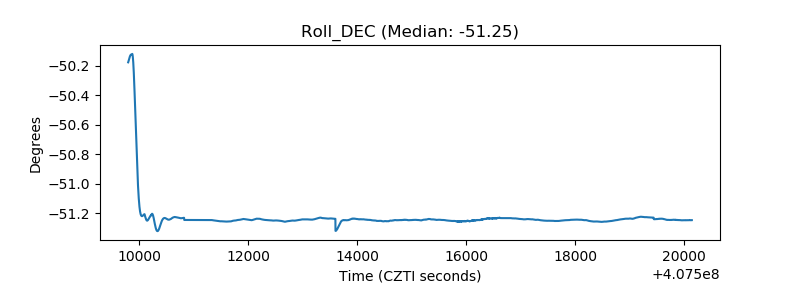 |
| _Roll_RA | 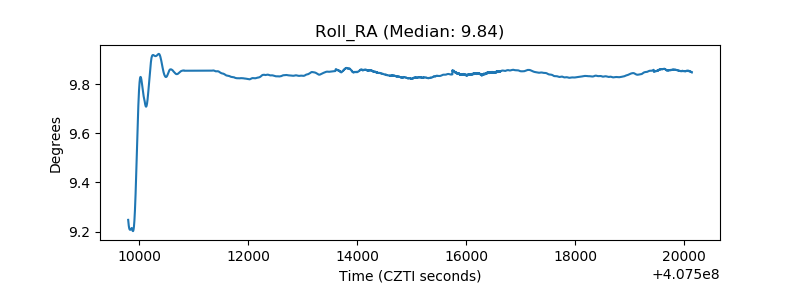 |
| Veto Counter | 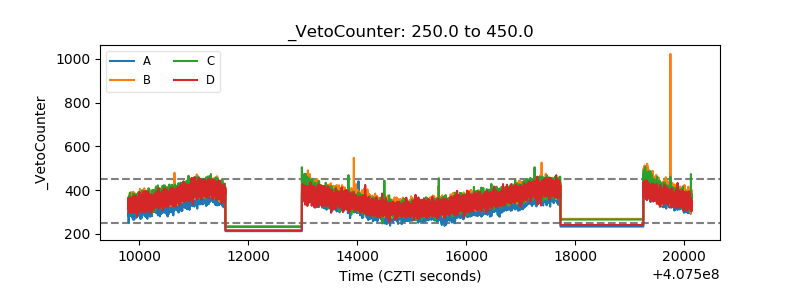 |