| Param | Original file | Final file |
|---|---|---|
| Filename | modeM0/AS1A12_044T04_9000005396_38790cztM0_level2.fits | modeM0/AS1A12_044T04_9000005396_38790cztM0_level2_quad_clean.evt |
| Size (bytes) | 368,939,520 | 93,441,600 |
| Size | 351.8 MB | 89.1 MB |
| Events in quadrant A | 3,113,869 | 630,542 |
| Events in quadrant B | 2,800,118 | 646,187 |
| Events in quadrant C | 2,700,775 | 608,191 |
| Events in quadrant D | 4,599,701 | 547,219 |
| Mode M0 | |||
|---|---|---|---|
| Quadrant | BADHDUFLAG | Total packets | Discarded packets |
| A | 0 | 12929 | 3 |
| B | 0 | 12205 | 2 |
| C | 0 | 11770 | 2 |
| D | 0 | 17512 | 2 |
| Mode SS | |||
|---|---|---|---|
| Quadrant | BADHDUFLAG | Total packets | Discarded packets |
| A | 0 | 114 | 0 |
| B | 0 | 114 | 0 |
| C | 0 | 114 | 0 |
| D | 0 | 114 | 0 |
| Mode M9 | |||
|---|---|---|---|
| Quadrant | BADHDUFLAG | Total packets | Discarded packets |
| A | 0 | 18 | 0 |
| B | 0 | 18 | 0 |
| C | 0 | 18 | 0 |
| D | 0 | 19 | 0 |
| Quadrant | Total seconds | Saturated seconds | Saturation percentage |
|---|---|---|---|
| A | 5686 | 45 | 0.791418% |
| B | 5686 | 45 | 0.791418% |
| C | 5686 | 26 | 0.457263% |
| D | 5686 | 290 | 5.100246% |
Noise dominated data is calculated using 1-second bins in cleaned event files. If a bin has >2000 counts, and if more than 50% of those come from <1% of pixels, then it is considered to be noise-dominated and hence unusable.
| Quadrant | # 1 sec bins | Bins with >0 counts | Bins with >2000 counts | High rate bins dominated by noise | Noise dominated (total time) | Noise dominated (detector-on time) | Marked lightcurve |
|---|---|---|---|---|---|---|---|
| A | 7329 | 5687 | 30 | 30 | 0.41% | 0.53% | 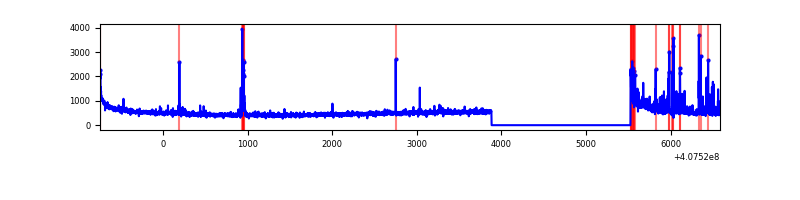 |
| B | 7329 | 5687 | 35 | 35 | 0.48% | 0.62% | 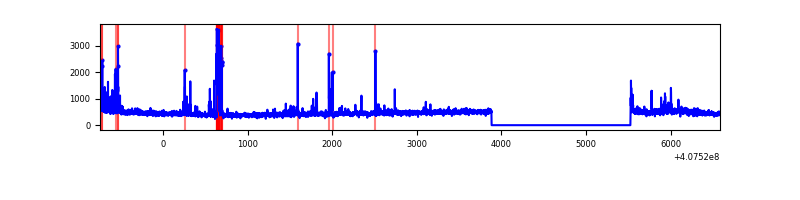 |
| C | 7329 | 5687 | 22 | 22 | 0.30% | 0.39% | 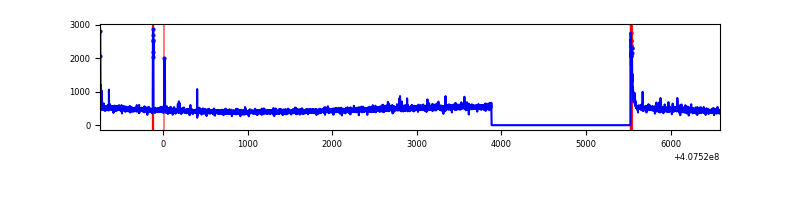 |
| D | 7329 | 5687 | 300 | 300 | 4.09% | 5.28% | 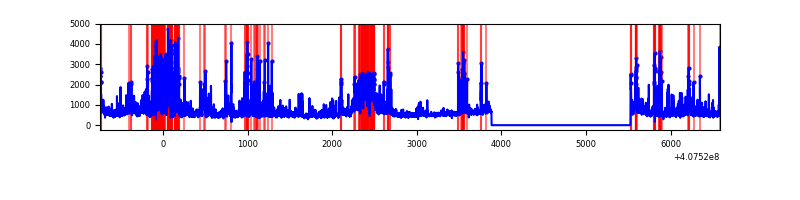 |
Top three noisy pixels from each quadrant. If the there are fewer than three noisy pixels in the level2.evt file, extra rows are filled as -1
| Pixel properties | Quadrant properties | ||||||
|---|---|---|---|---|---|---|---|
| Quadrant | DetID | PixID | Counts | Sigma | Mean | Median | Sigma |
| A | 10 | 83 | 442850 | 3465.37 | 621 | 609 | 127.6 |
| A | 13 | 248 | 212842 | 1663.04 | 621 | 609 | 127.6 |
| A | 12 | 16 | 20735 | 157.71 | 621 | 609 | 127.6 |
| B | 5 | 184 | 145398 | 1205.84 | 622 | 607 | 120.1 |
| B | 4 | 171 | 107445 | 889.76 | 622 | 607 | 120.1 |
| B | 0 | 230 | 41495 | 340.52 | 622 | 607 | 120.1 |
| C | 15 | 214 | 252700 | 1777.19 | 602 | 604 | 141.9 |
| C | 0 | 10 | 61484 | 429.18 | 602 | 604 | 141.9 |
| C | 2 | 16 | 30277 | 209.18 | 602 | 604 | 141.9 |
| D | 12 | 235 | 1041366 | 7196.4 | 588 | 569 | 144.6 |
| D | 5 | 222 | 457937 | 3162.39 | 588 | 569 | 144.6 |
| D | 2 | 249 | 341402 | 2356.63 | 588 | 569 | 144.6 |
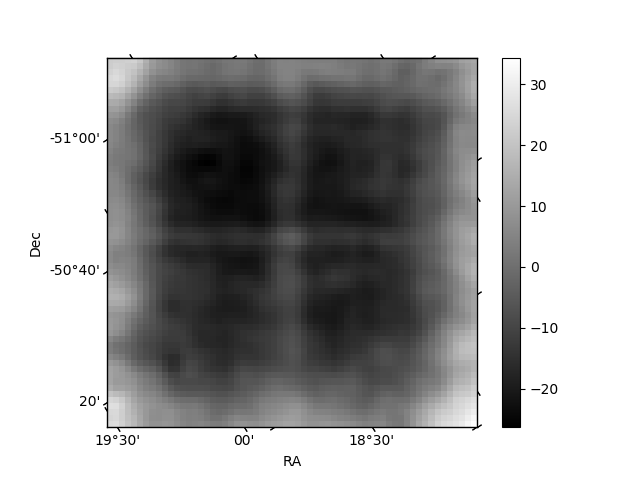
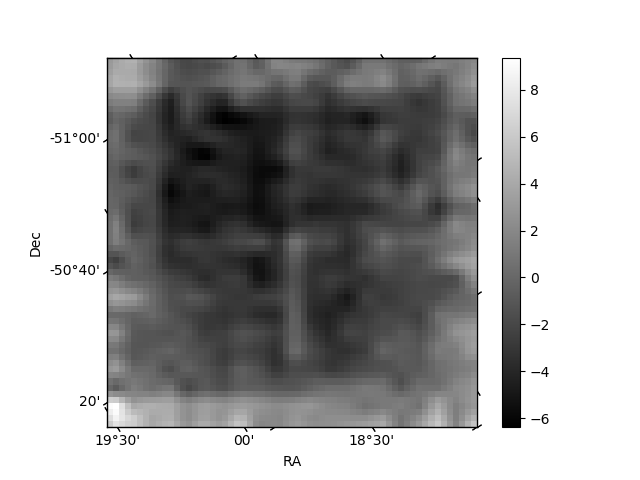
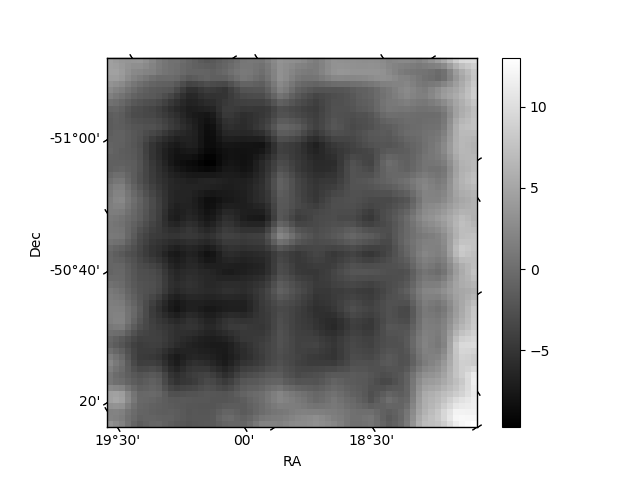
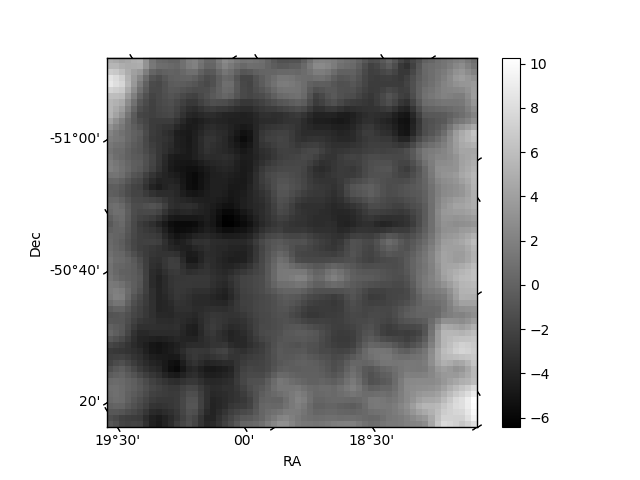
Histogram calculated using DETX and DETY for each event in the final _common_clean file
| Quadrant A | 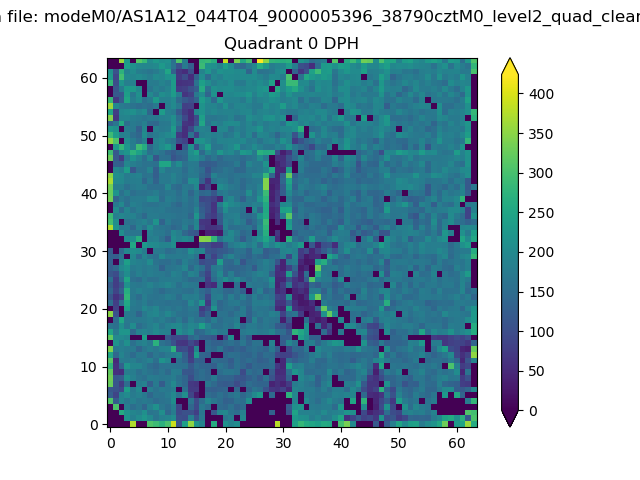 |
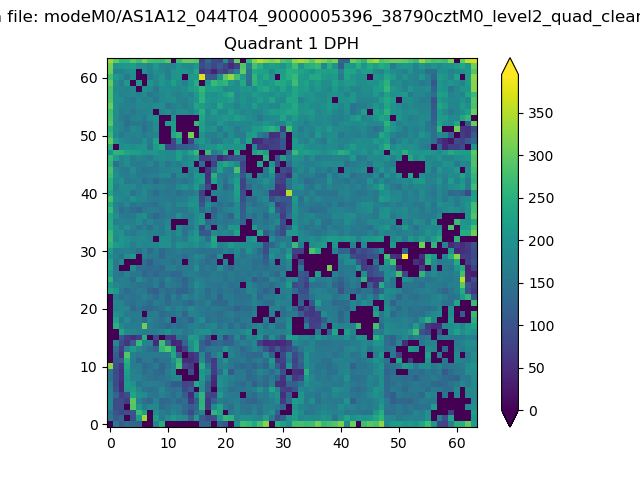 |
Quadrant B |
|---|---|---|---|
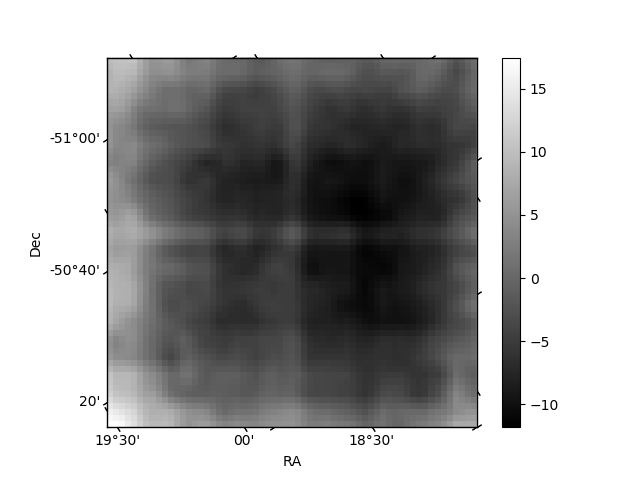
| Quadrant D | 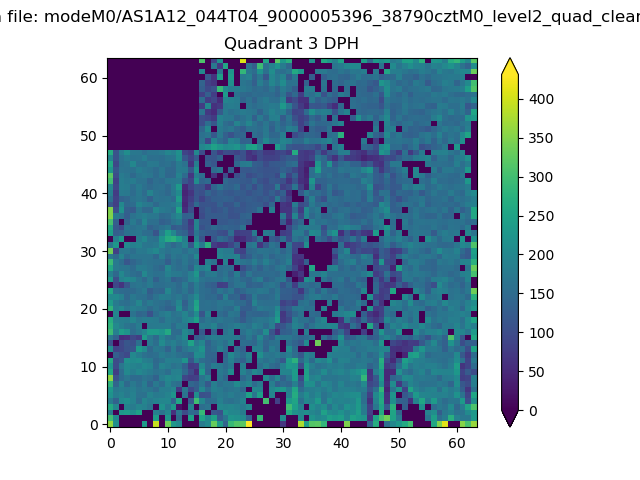 |
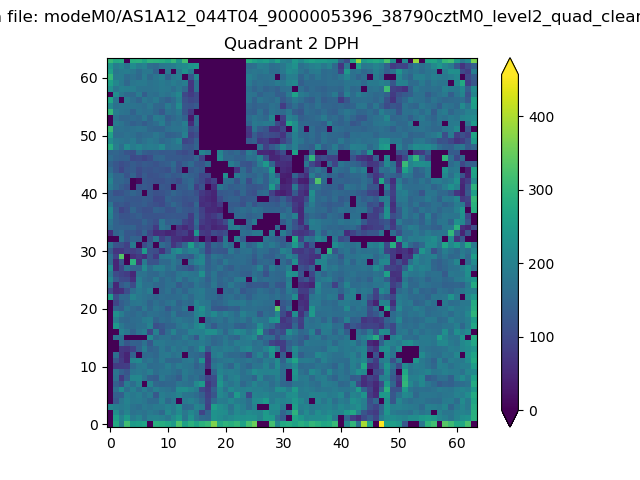 |
Quadrant C |
| Plot type | Count rate plots | Images |
|---|---|---|
| Comparison with Poisson distribution Blue bars denote a histogram of data divided into 1 sec bins. Red curve is a Poisson curve with rate = median count rate of data. |
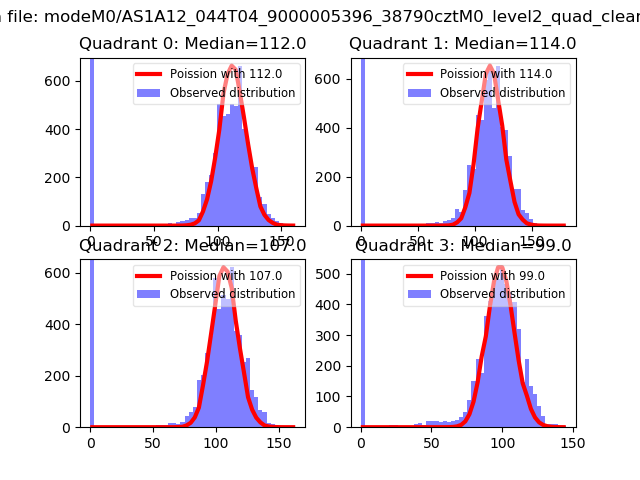 |
 |
| Quadrant-wise count rates Data is divided into 100 sec bins |
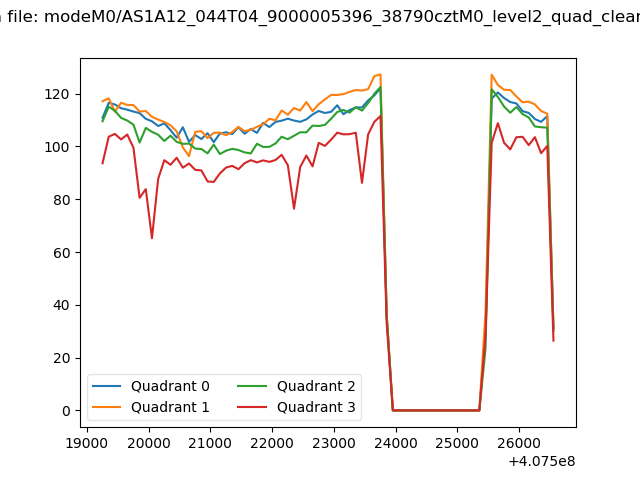 |
|
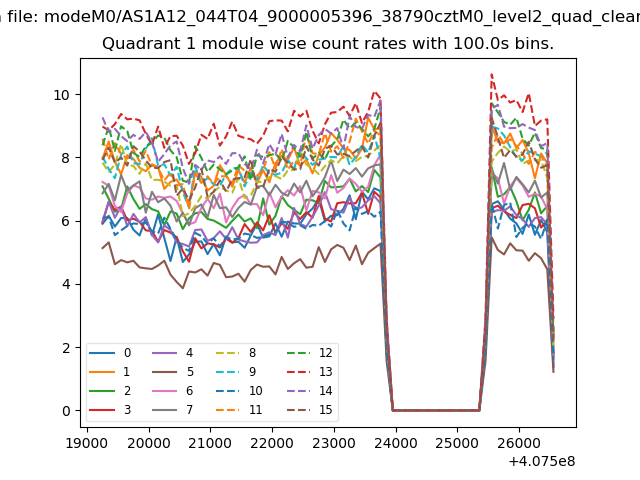
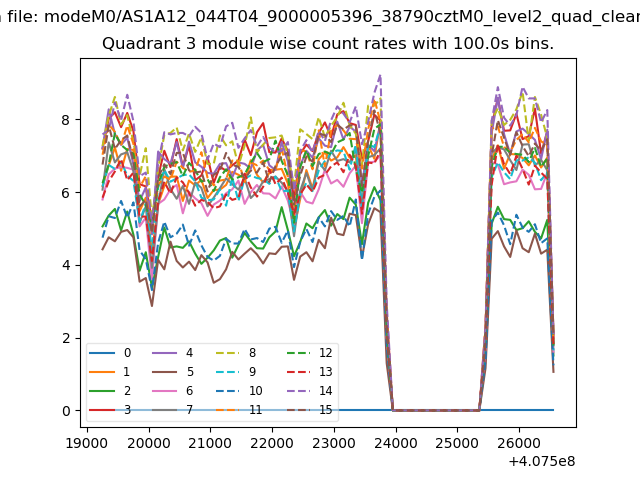
| Module-wise count rates for Quadrant A Data is divided into 100 sec bins |
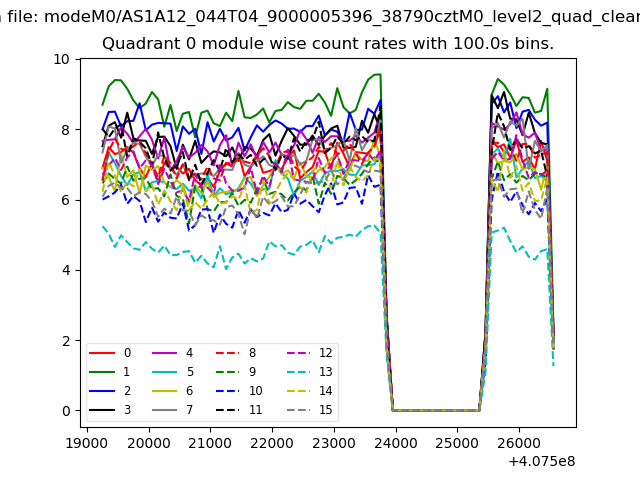 |
 |
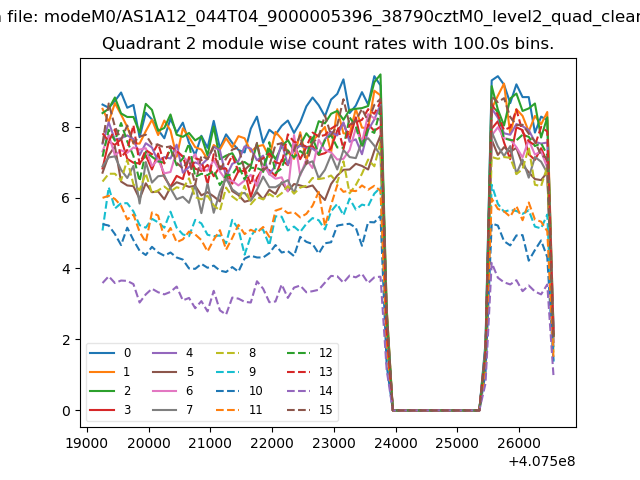
| Module-wise count rates for Quadrant B Data is divided into 100 sec bins |
 |
 |
| Module-wise count rates for Quadrant C Data is divided into 100 sec bins |
 |
 |
| Module-wise count rates for Quadrant D Data is divided into 100 sec bins |
 |
 |
| Parameter | Plot |
|---|---|
| CZT HV Monitor | 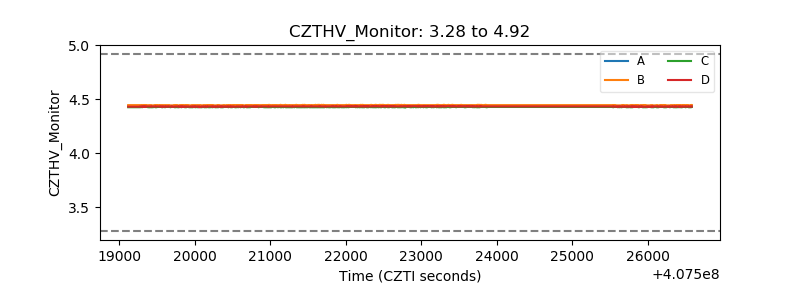 |
| D_VDD | 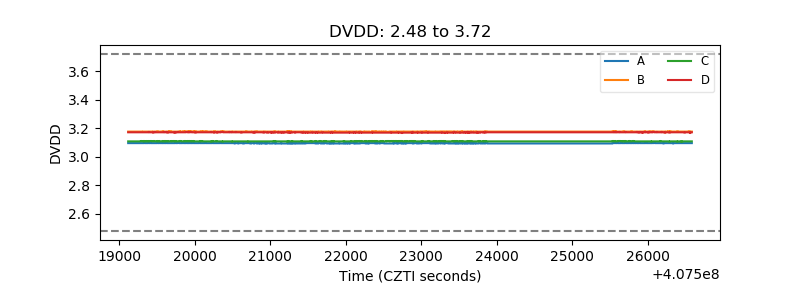 |
| Temperature 1 | 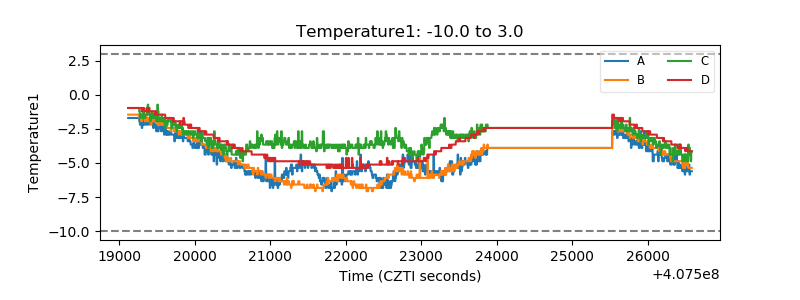 |
| Veto HV Monitor | 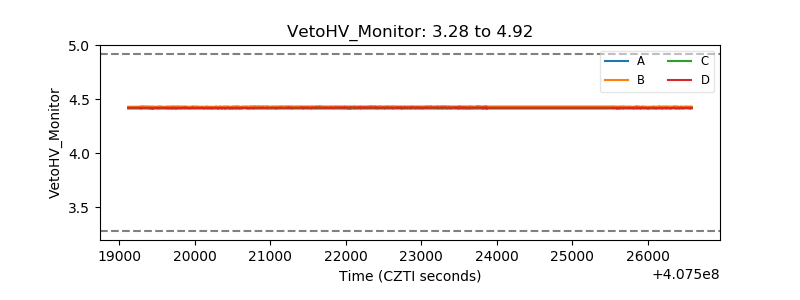 |
| Veto LLD | 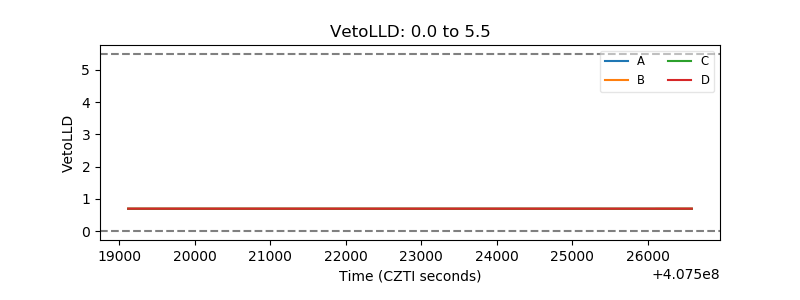 |
| Alpha Counter | 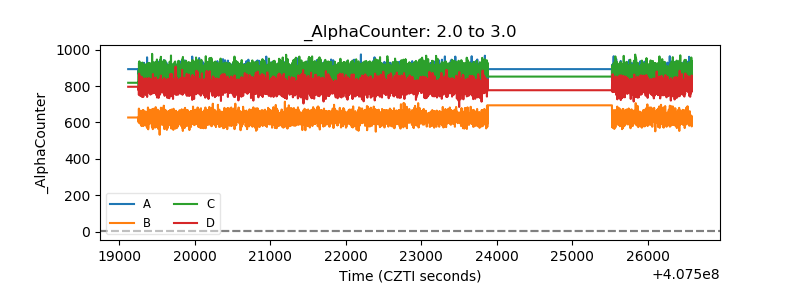 |
| _CPM_Rate | 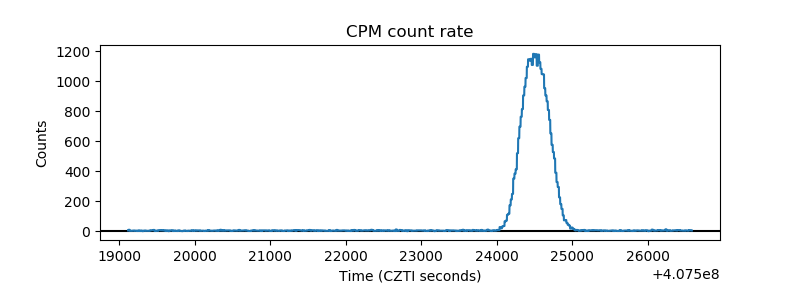 |
| CZT Counter | 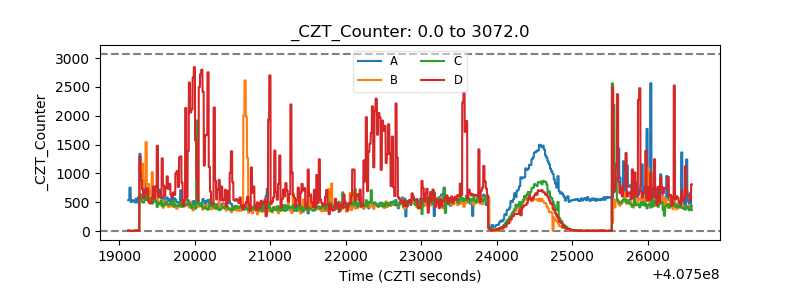 |
| +2.5 Volts monitor | 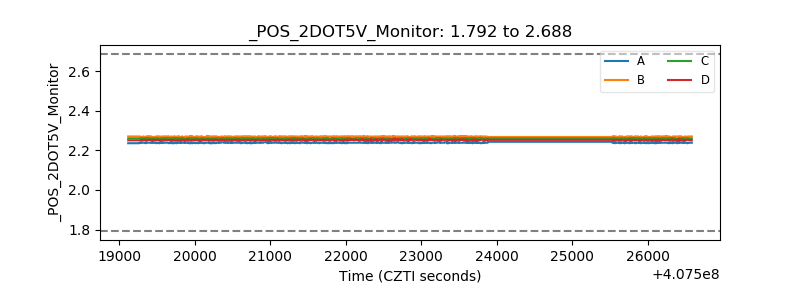 |
| +5 Volts monitor |  |
| _ROLL_ROT | 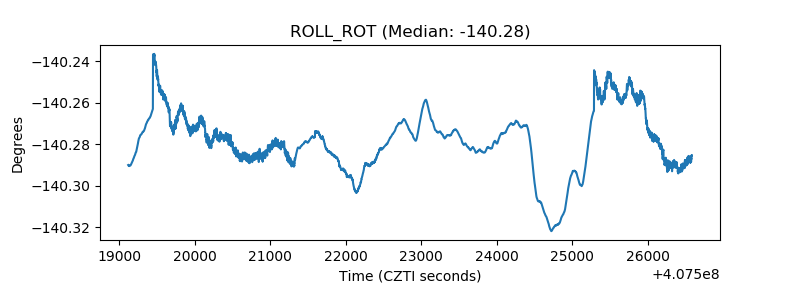 |
| _Roll_DEC | 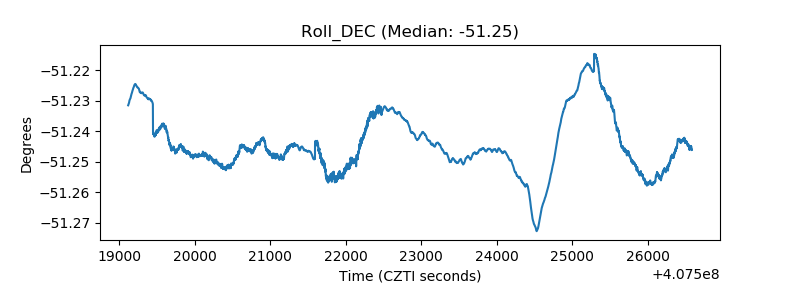 |
| _Roll_RA | 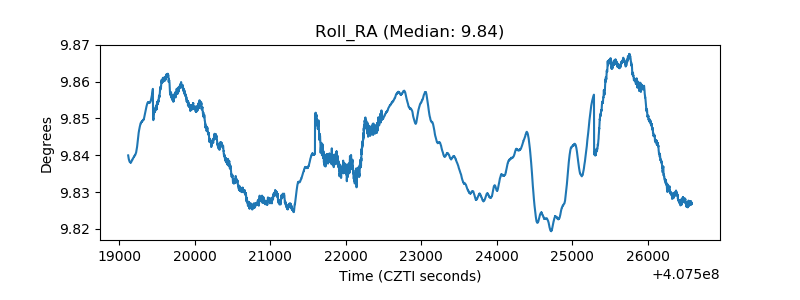 |
| Veto Counter | 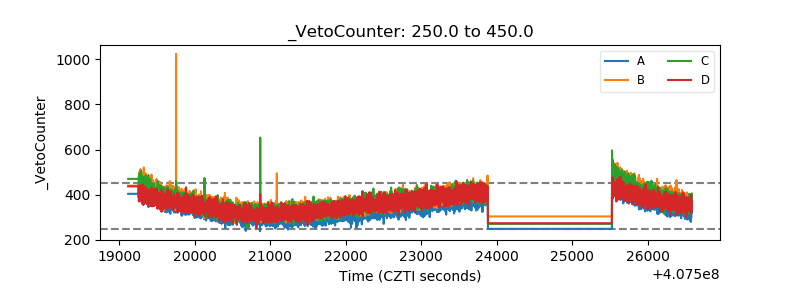 |