| Param | Original file | Final file |
|---|---|---|
| Filename | modeM0/AS1A12_044T04_9000005396_38792cztM0_level2.fits | modeM0/AS1A12_044T04_9000005396_38792cztM0_level2_quad_clean.evt |
| Size (bytes) | 357,304,320 | 90,354,240 |
| Size | 340.8 MB | 86.2 MB |
| Events in quadrant A | 3,150,760 | 614,646 |
| Events in quadrant B | 3,383,981 | 612,356 |
| Events in quadrant C | 2,628,192 | 593,920 |
| Events in quadrant D | 3,645,019 | 539,097 |
| Mode M0 | |||
|---|---|---|---|
| Quadrant | BADHDUFLAG | Total packets | Discarded packets |
| A | 0 | 12792 | 3 |
| B | 0 | 13754 | 2 |
| C | 0 | 11218 | 2 |
| D | 0 | 14367 | 2 |
| Mode SS | |||
|---|---|---|---|
| Quadrant | BADHDUFLAG | Total packets | Discarded packets |
| A | 0 | 108 | 0 |
| B | 0 | 108 | 0 |
| C | 0 | 108 | 0 |
| D | 0 | 108 | 0 |
| Mode M9 | |||
|---|---|---|---|
| Quadrant | BADHDUFLAG | Total packets | Discarded packets |
| A | 0 | 22 | 0 |
| B | 0 | 22 | 0 |
| C | 0 | 22 | 0 |
| D | 0 | 23 | 0 |
| Quadrant | Total seconds | Saturated seconds | Saturation percentage |
|---|---|---|---|
| A | 5373 | 56 | 1.042248% |
| B | 5373 | 237 | 4.410944% |
| C | 5373 | 33 | 0.614182% |
| D | 5373 | 139 | 2.587009% |
Noise dominated data is calculated using 1-second bins in cleaned event files. If a bin has >2000 counts, and if more than 50% of those come from <1% of pixels, then it is considered to be noise-dominated and hence unusable.
| Quadrant | # 1 sec bins | Bins with >0 counts | Bins with >2000 counts | High rate bins dominated by noise | Noise dominated (total time) | Noise dominated (detector-on time) | Marked lightcurve |
|---|---|---|---|---|---|---|---|
| A | 7166 | 5374 | 43 | 43 | 0.60% | 0.80% | 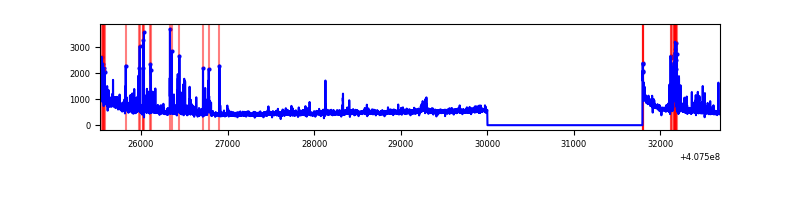 |
| B | 7166 | 5374 | 180 | 180 | 2.51% | 3.35% | 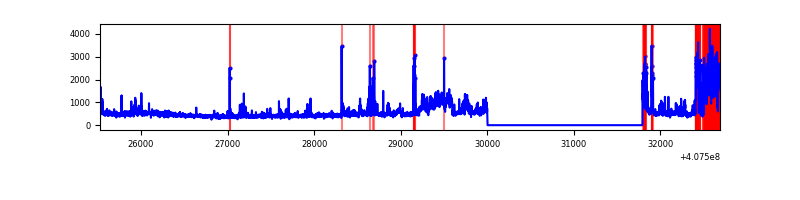 |
| C | 7166 | 5374 | 28 | 28 | 0.39% | 0.52% | 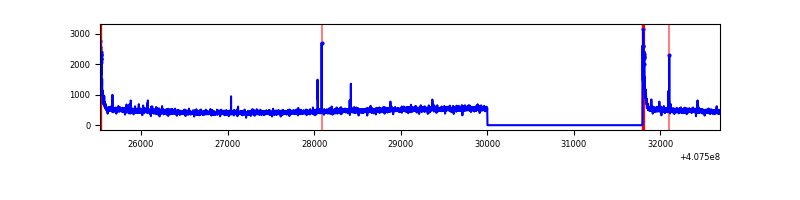 |
| D | 7166 | 5374 | 129 | 129 | 1.80% | 2.40% | 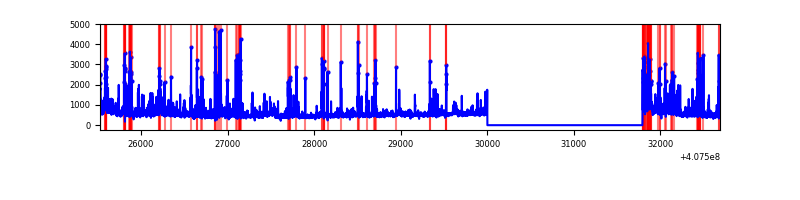 |
Top three noisy pixels from each quadrant. If the there are fewer than three noisy pixels in the level2.evt file, extra rows are filled as -1
| Pixel properties | Quadrant properties | ||||||
|---|---|---|---|---|---|---|---|
| Quadrant | DetID | PixID | Counts | Sigma | Mean | Median | Sigma |
| A | 10 | 83 | 420745 | 3466.64 | 593 | 580 | 121.2 |
| A | 13 | 248 | 336993 | 2775.63 | 593 | 580 | 121.2 |
| A | 12 | 16 | 64965 | 531.22 | 593 | 580 | 121.2 |
| B | 4 | 171 | 614015 | 5313.96 | 591 | 574 | 115.4 |
| B | 5 | 200 | 288521 | 2494.36 | 591 | 574 | 115.4 |
| B | 5 | 184 | 48270 | 413.17 | 591 | 574 | 115.4 |
| C | 15 | 214 | 238785 | 1734.83 | 579 | 583 | 137.3 |
| C | 0 | 10 | 97454 | 705.51 | 579 | 583 | 137.3 |
| C | 15 | 208 | 11542 | 79.81 | 579 | 583 | 137.3 |
| D | 2 | 249 | 479958 | 3427.73 | 568 | 552 | 139.9 |
| D | 2 | 16 | 272083 | 1941.44 | 568 | 552 | 139.9 |
| D | 5 | 222 | 240264 | 1713.93 | 568 | 552 | 139.9 |
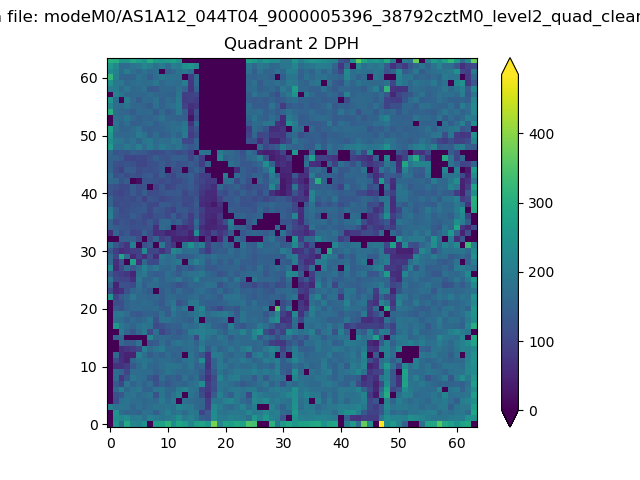
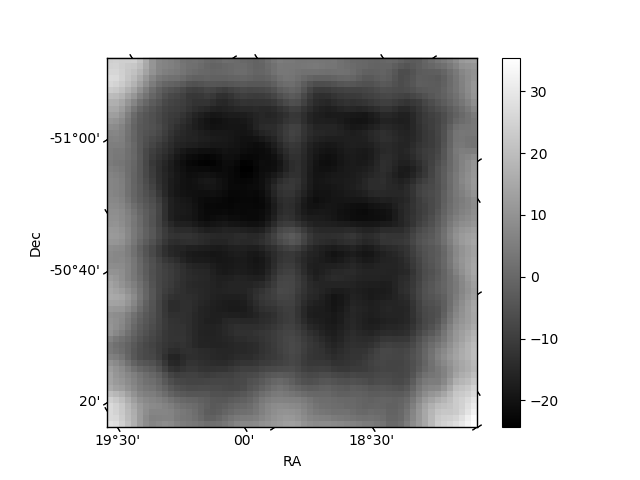
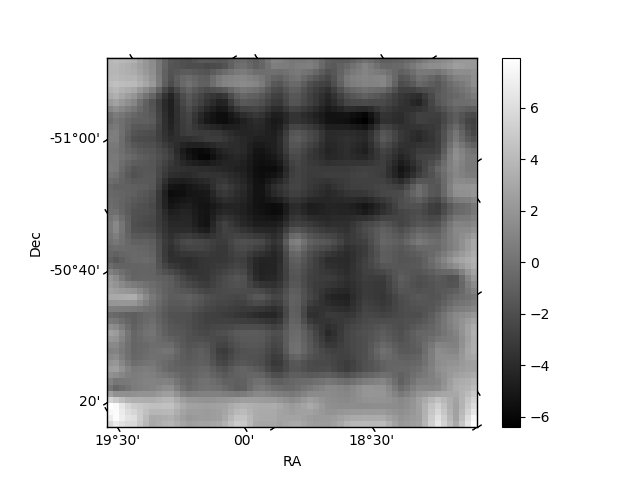
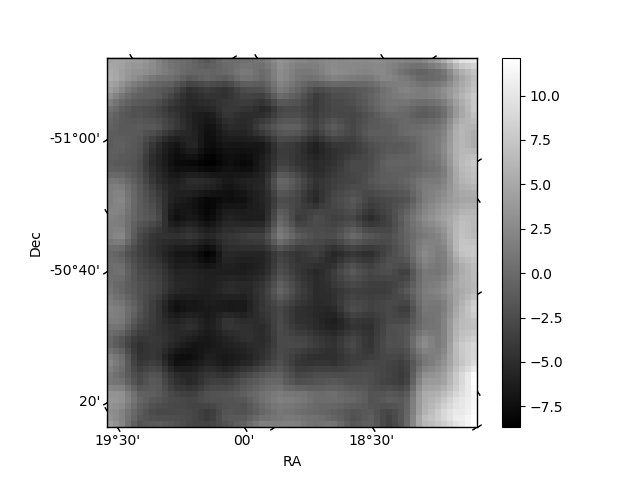
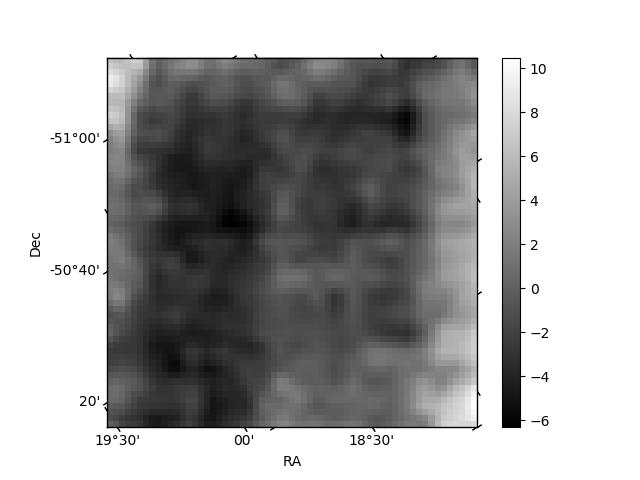
Histogram calculated using DETX and DETY for each event in the final _common_clean file
| Quadrant A | 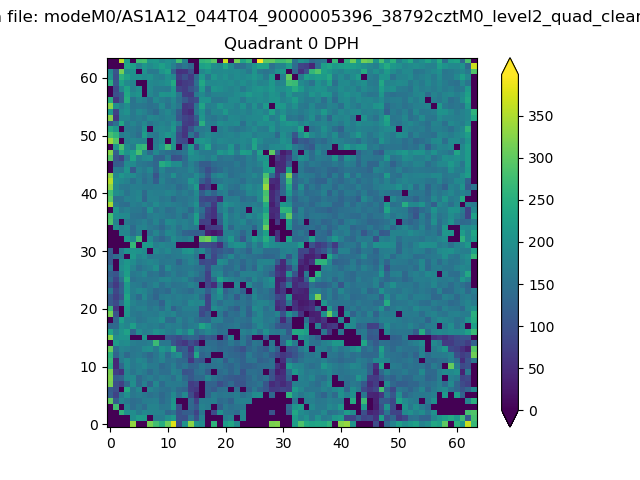 |
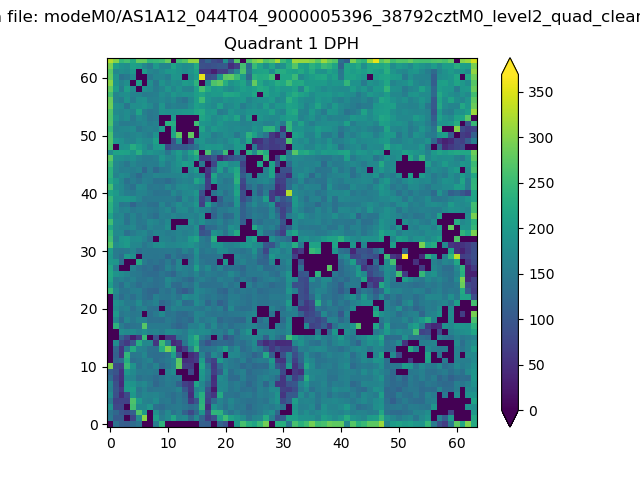 |
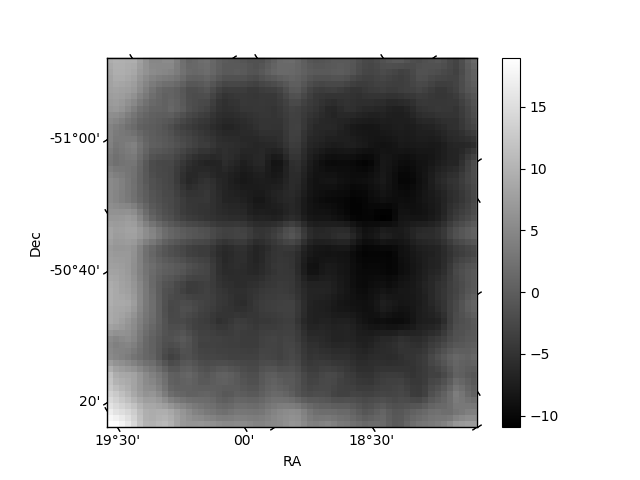
Quadrant B |
|---|---|---|---|
| Quadrant D | 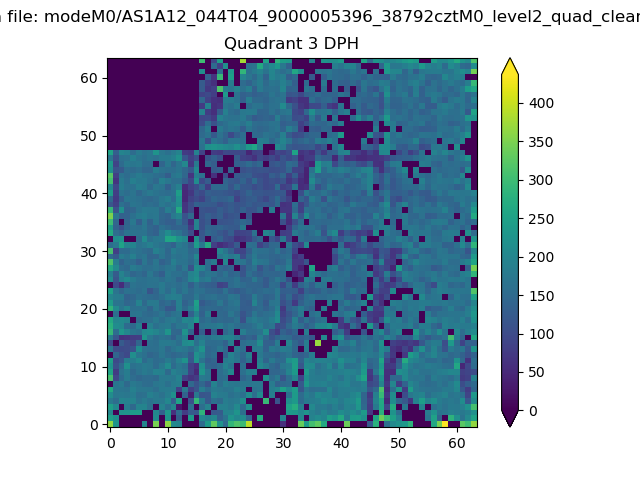 |
 |
Quadrant C |
| Plot type | Count rate plots | Images |
|---|---|---|
| Comparison with Poisson distribution Blue bars denote a histogram of data divided into 1 sec bins. Red curve is a Poisson curve with rate = median count rate of data. |
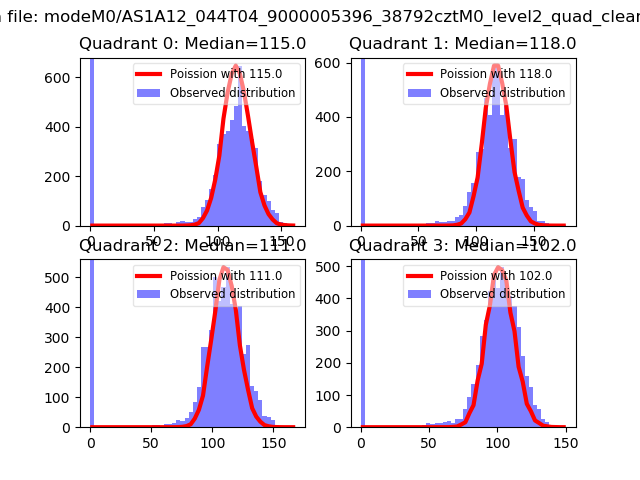 |
 |
| Quadrant-wise count rates Data is divided into 100 sec bins |
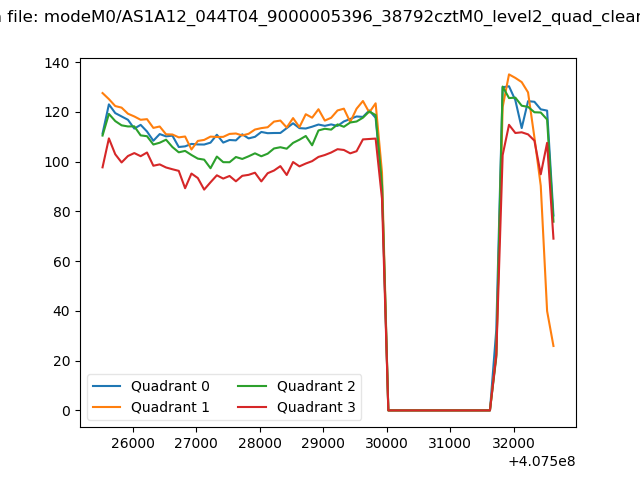 |
|
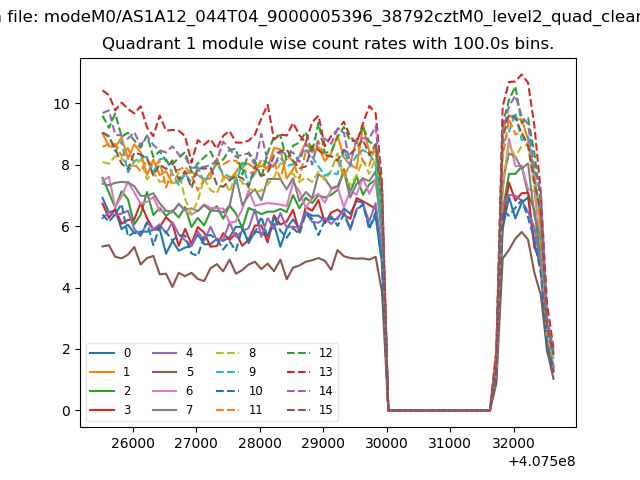
| Module-wise count rates for Quadrant A Data is divided into 100 sec bins |
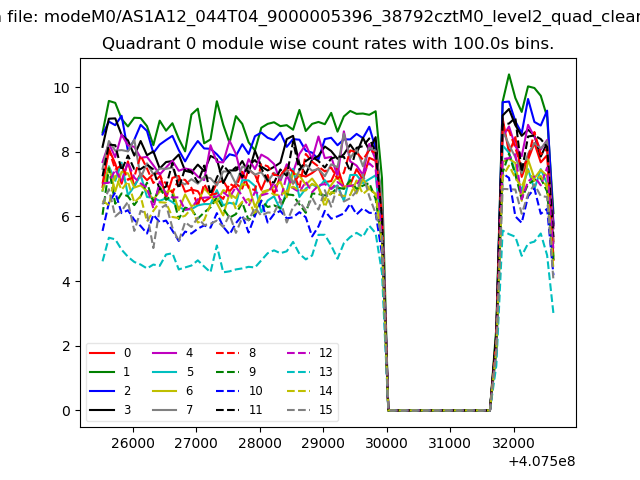 |
 |
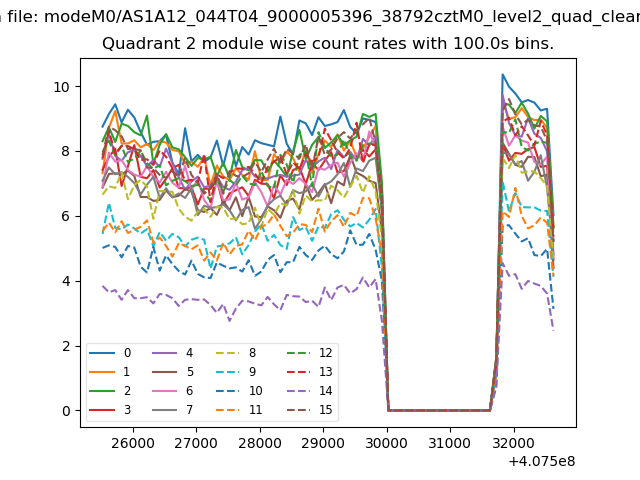
| Module-wise count rates for Quadrant B Data is divided into 100 sec bins |
 |
 |
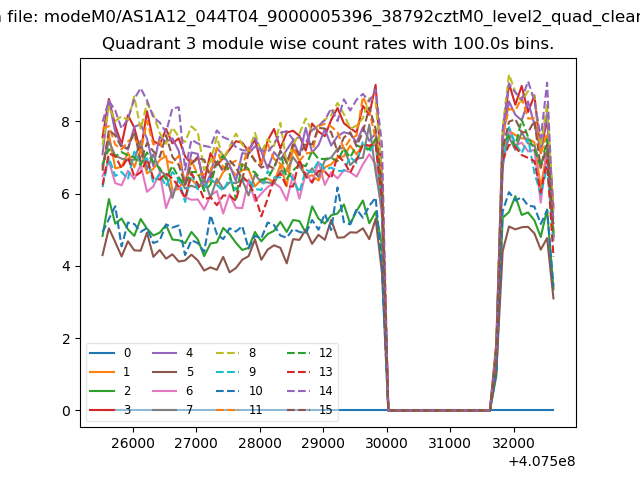
| Module-wise count rates for Quadrant C Data is divided into 100 sec bins |
 |
 |
| Module-wise count rates for Quadrant D Data is divided into 100 sec bins |
 |
 |
| Parameter | Plot |
|---|---|
| CZT HV Monitor | 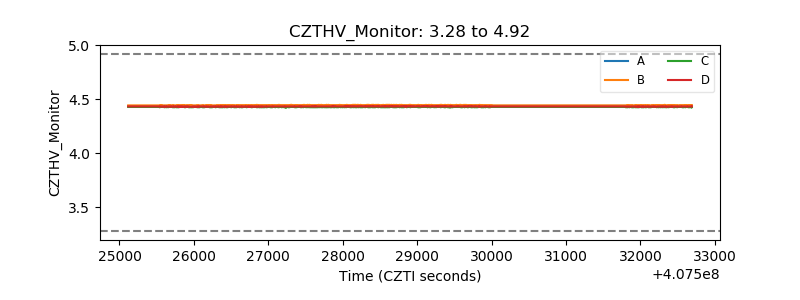 |
| D_VDD | 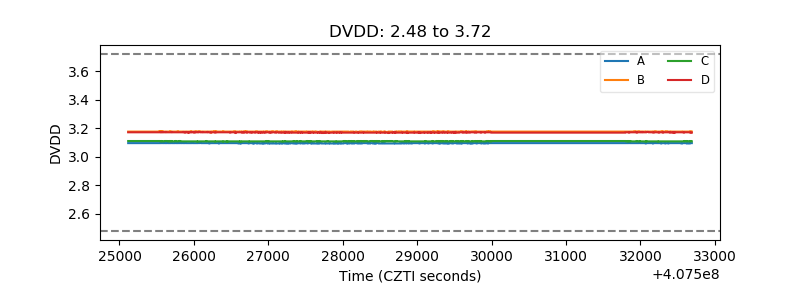 |
| Temperature 1 | 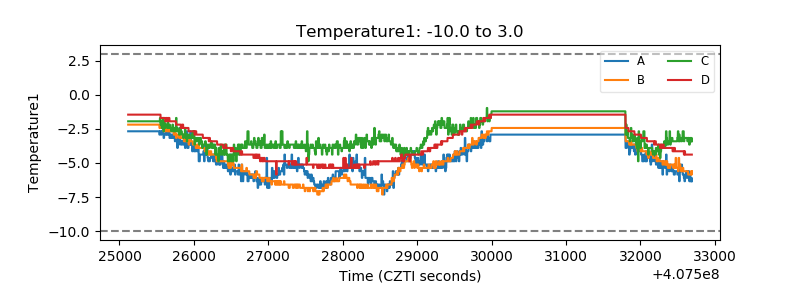 |
| Veto HV Monitor | 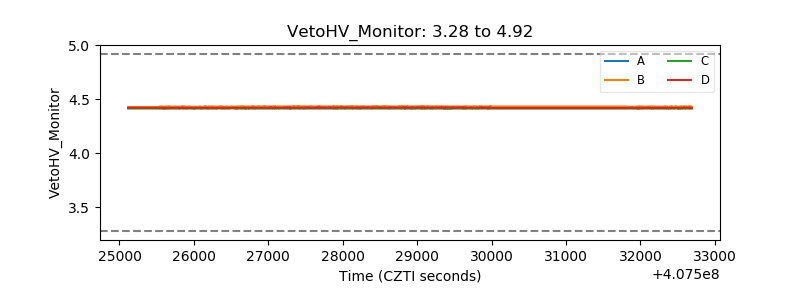 |
| Veto LLD | 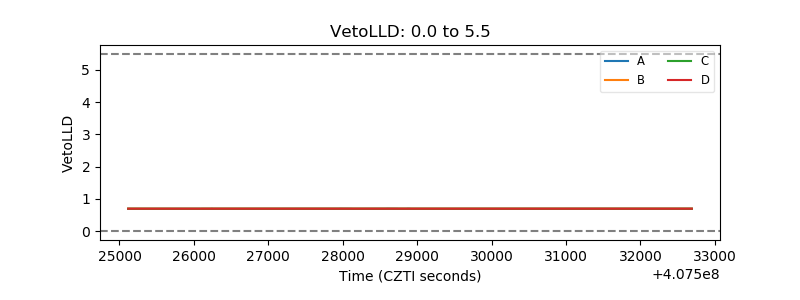 |
| Alpha Counter | 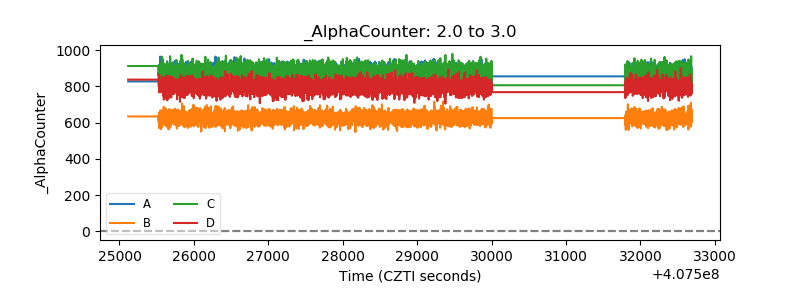 |
| _CPM_Rate | 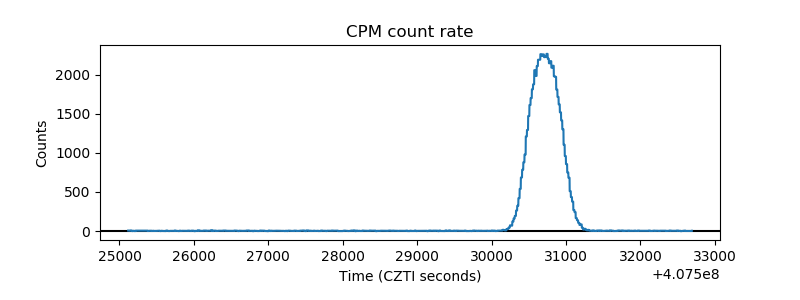 |
| CZT Counter | 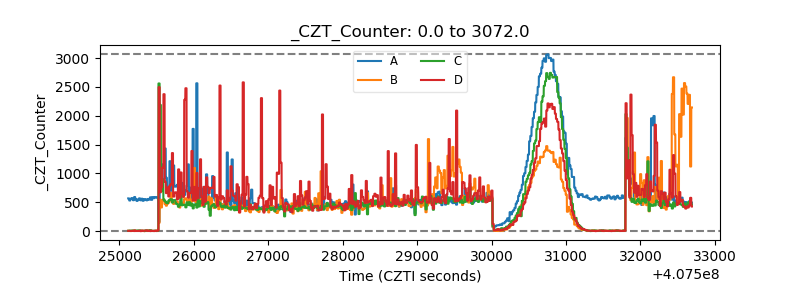 |
| +2.5 Volts monitor | 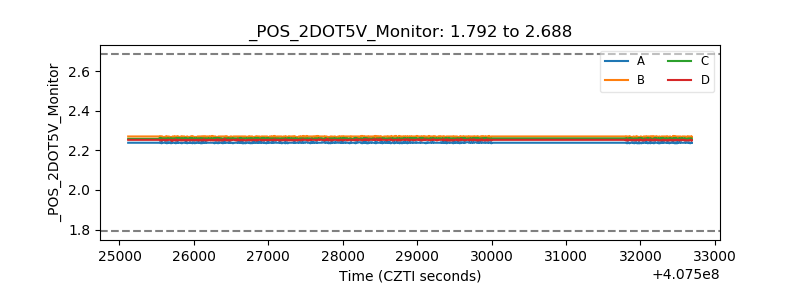 |
| +5 Volts monitor | 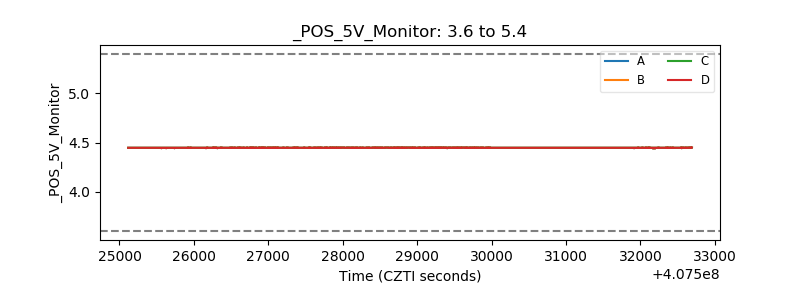 |
| _ROLL_ROT | 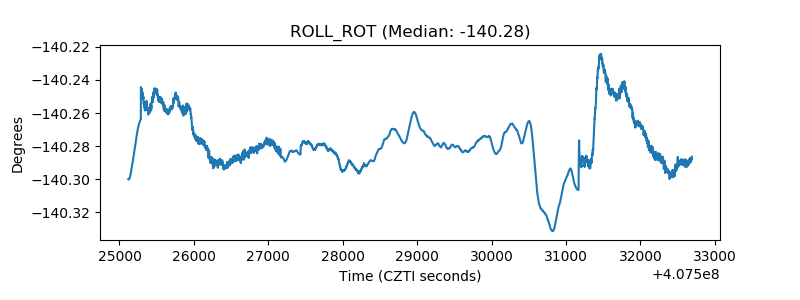 |
| _Roll_DEC | 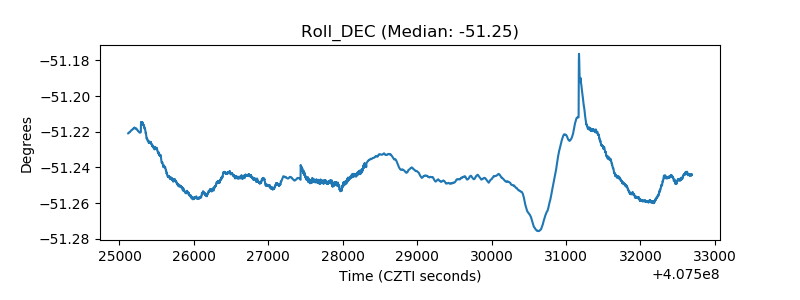 |
| _Roll_RA | 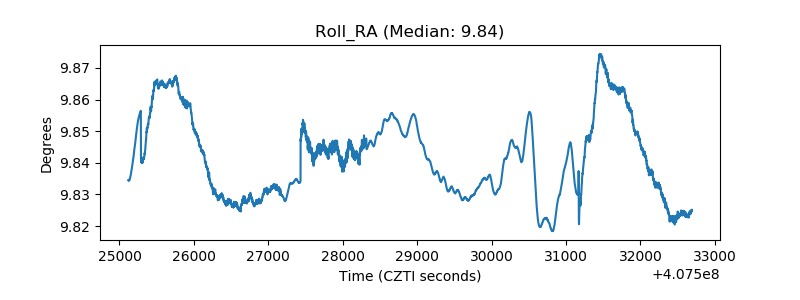 |
| Veto Counter | 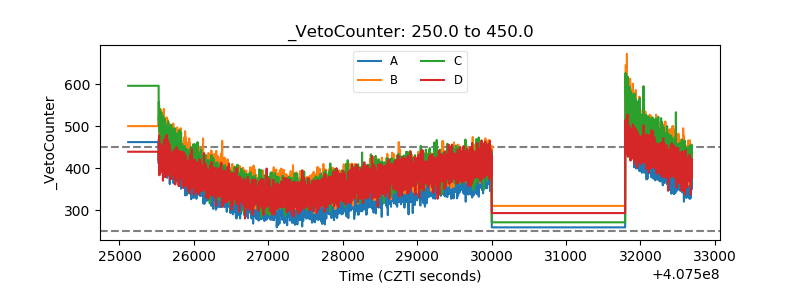 |