| Param | Original file | Final file |
|---|---|---|
| Filename | modeM0/AS1A12_044T04_9000005396_38793cztM0_level2.fits | modeM0/AS1A12_044T04_9000005396_38793cztM0_level2_quad_clean.evt |
| Size (bytes) | 339,442,560 | 89,412,480 |
| Size | 323.7 MB | 85.3 MB |
| Events in quadrant A | 2,891,322 | 613,952 |
| Events in quadrant B | 3,099,885 | 612,965 |
| Events in quadrant C | 2,560,175 | 595,872 |
| Events in quadrant D | 3,615,151 | 526,340 |
| Mode M0 | |||
|---|---|---|---|
| Quadrant | BADHDUFLAG | Total packets | Discarded packets |
| A | 0 | 11794 | 3 |
| B | 0 | 12434 | 2 |
| C | 0 | 10659 | 2 |
| D | 0 | 14275 | 2 |
| Mode SS | |||
|---|---|---|---|
| Quadrant | BADHDUFLAG | Total packets | Discarded packets |
| A | 0 | 104 | 0 |
| B | 0 | 104 | 0 |
| C | 0 | 104 | 0 |
| D | 0 | 104 | 0 |
| Mode M9 | |||
|---|---|---|---|
| Quadrant | BADHDUFLAG | Total packets | Discarded packets |
| A | 0 | 25 | 0 |
| B | 0 | 25 | 0 |
| C | 0 | 25 | 0 |
| D | 0 | 26 | 0 |
| Quadrant | Total seconds | Saturated seconds | Saturation percentage |
|---|---|---|---|
| A | 5115 | 34 | 0.664712% |
| B | 5115 | 242 | 4.731183% |
| C | 5115 | 26 | 0.508309% |
| D | 5115 | 230 | 4.496579% |
Noise dominated data is calculated using 1-second bins in cleaned event files. If a bin has >2000 counts, and if more than 50% of those come from <1% of pixels, then it is considered to be noise-dominated and hence unusable.
| Quadrant | # 1 sec bins | Bins with >0 counts | Bins with >2000 counts | High rate bins dominated by noise | Noise dominated (total time) | Noise dominated (detector-on time) | Marked lightcurve |
|---|---|---|---|---|---|---|---|
| A | 6999 | 5116 | 26 | 26 | 0.37% | 0.51% | 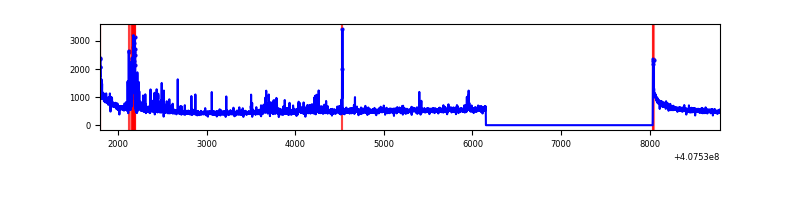 |
| B | 6999 | 5116 | 194 | 194 | 2.77% | 3.79% | 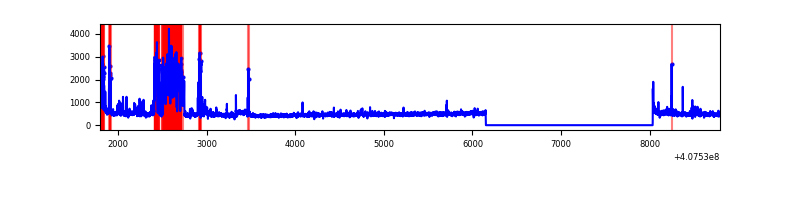 |
| C | 6999 | 5116 | 19 | 19 | 0.27% | 0.37% | 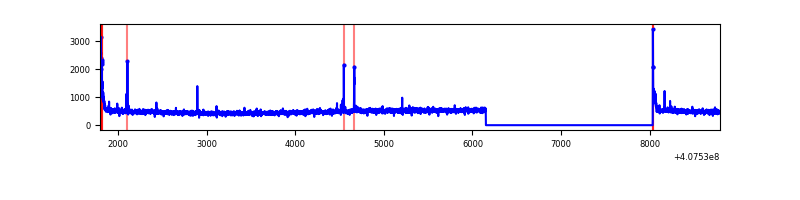 |
| D | 6999 | 5116 | 185 | 185 | 2.64% | 3.62% | 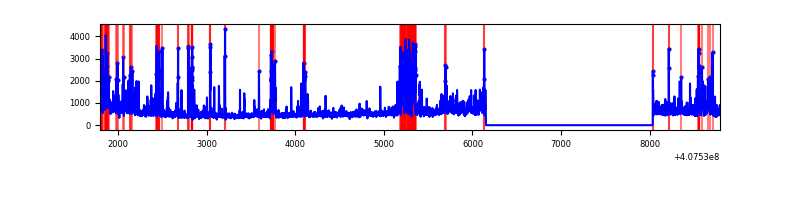 |
Top three noisy pixels from each quadrant. If the there are fewer than three noisy pixels in the level2.evt file, extra rows are filled as -1
| Pixel properties | Quadrant properties | ||||||
|---|---|---|---|---|---|---|---|
| Quadrant | DetID | PixID | Counts | Sigma | Mean | Median | Sigma |
| A | 10 | 83 | 393547 | 3322.43 | 578 | 567 | 118.3 |
| A | 13 | 248 | 131611 | 1107.91 | 578 | 567 | 118.3 |
| A | 12 | 16 | 76399 | 641.12 | 578 | 567 | 118.3 |
| B | 4 | 171 | 679157 | 6096.42 | 579 | 565 | 111.3 |
| B | 0 | 230 | 54323 | 482.96 | 579 | 565 | 111.3 |
| B | 5 | 184 | 29981 | 264.27 | 579 | 565 | 111.3 |
| C | 15 | 214 | 226609 | 1703.38 | 569 | 573 | 132.7 |
| C | 0 | 10 | 73681 | 550.93 | 569 | 573 | 132.7 |
| C | 14 | 254 | 20497 | 150.14 | 569 | 573 | 132.7 |
| D | 10 | 118 | 356353 | 2678.79 | 550 | 535 | 132.8 |
| D | 2 | 16 | 301028 | 2262.28 | 550 | 535 | 132.8 |
| D | 2 | 249 | 257886 | 1937.48 | 550 | 535 | 132.8 |
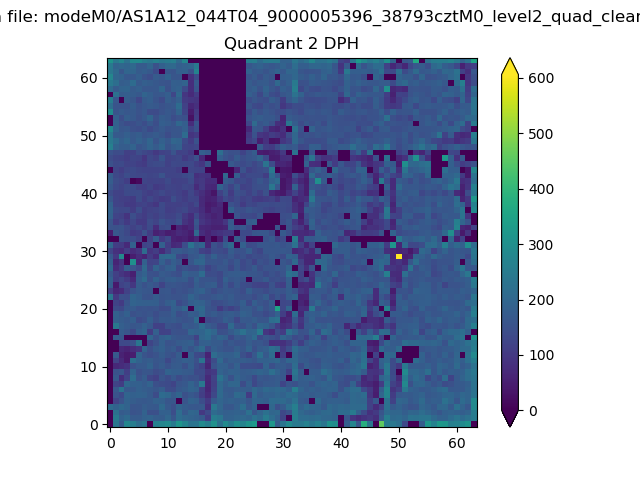
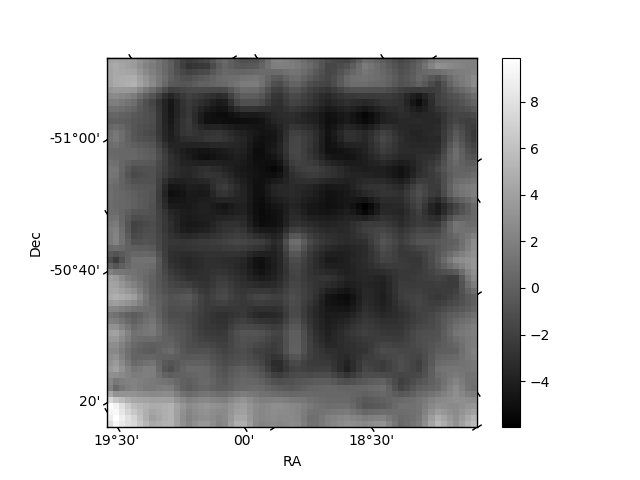
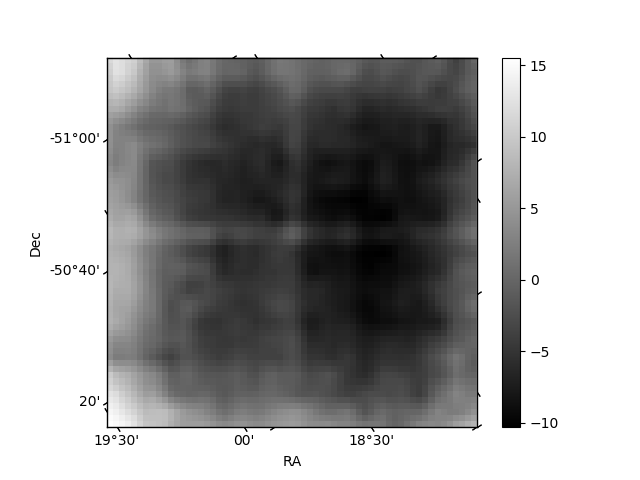
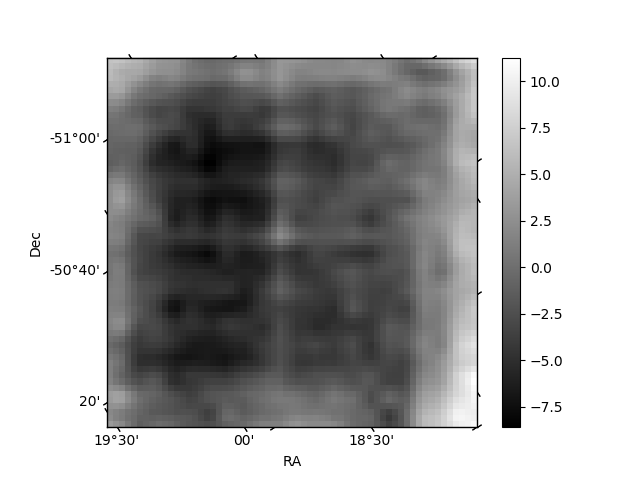
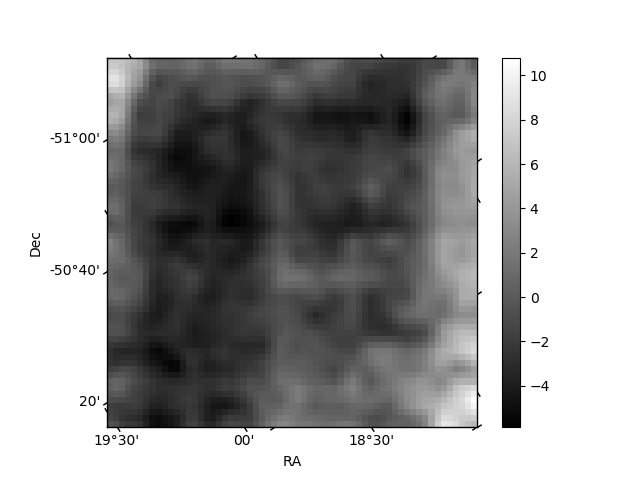
Histogram calculated using DETX and DETY for each event in the final _common_clean file
| Quadrant A | 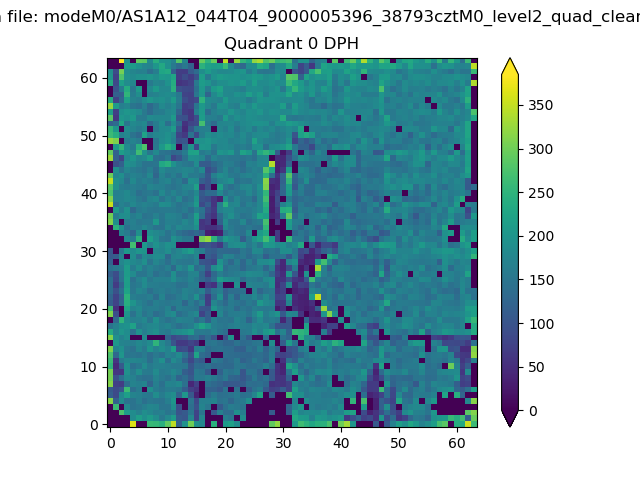 |
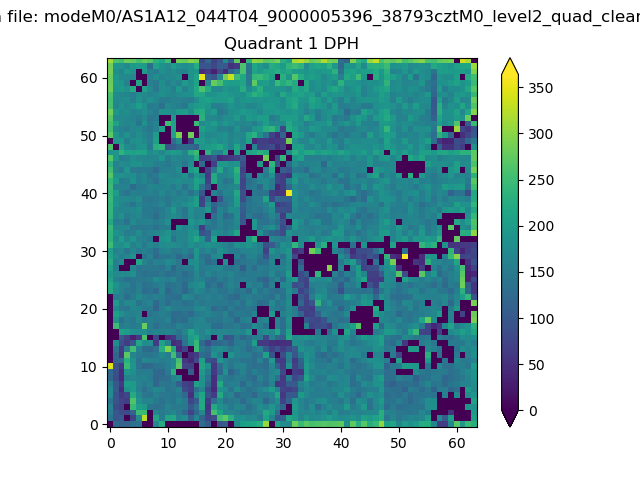 |
Quadrant B |
|---|---|---|---|
| Quadrant D | 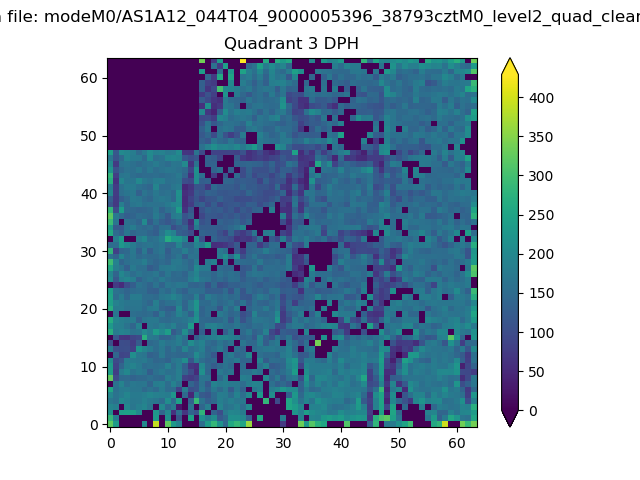 |
 |
Quadrant C |
| Plot type | Count rate plots | Images |
|---|---|---|
| Comparison with Poisson distribution Blue bars denote a histogram of data divided into 1 sec bins. Red curve is a Poisson curve with rate = median count rate of data. |
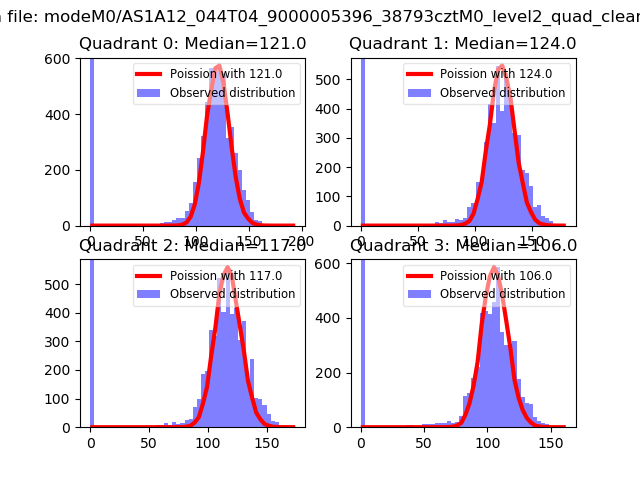 |
 |
| Quadrant-wise count rates Data is divided into 100 sec bins |
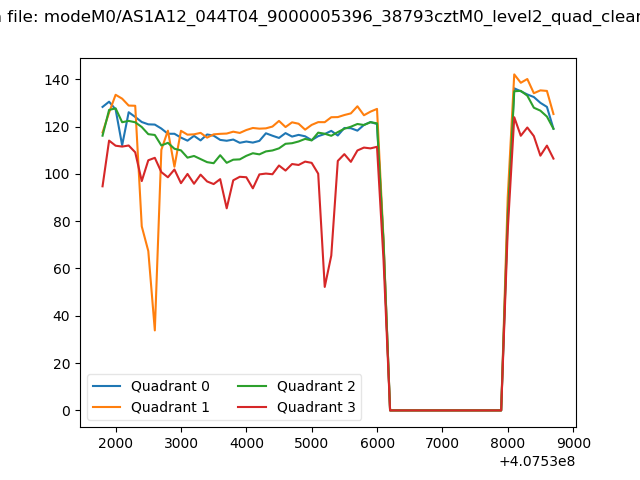 |
|
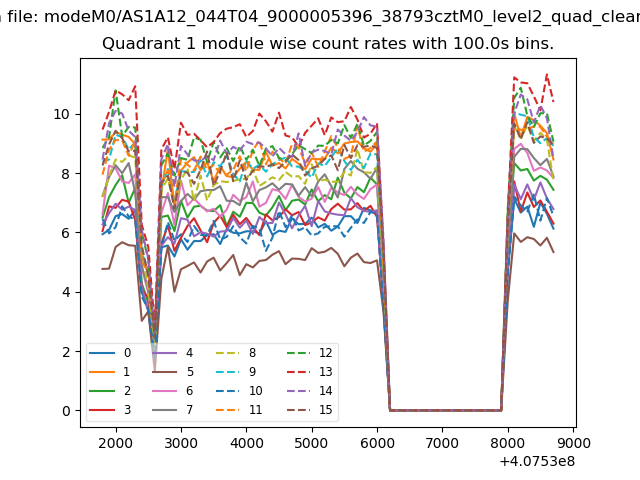
| Module-wise count rates for Quadrant A Data is divided into 100 sec bins |
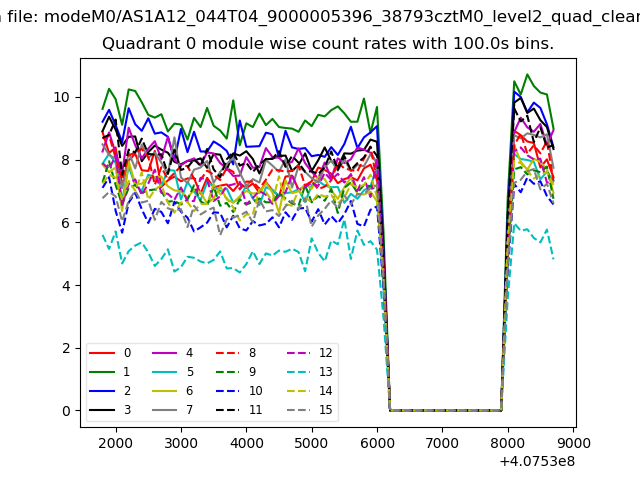 |
 |
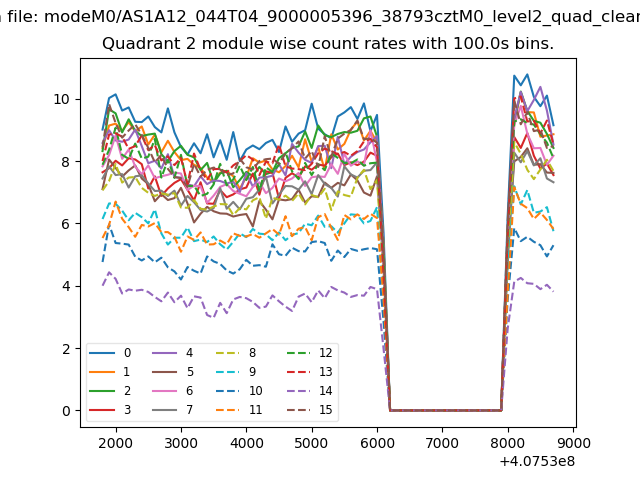
| Module-wise count rates for Quadrant B Data is divided into 100 sec bins |
 |
 |
| Module-wise count rates for Quadrant C Data is divided into 100 sec bins |
 |
 |
| Module-wise count rates for Quadrant D Data is divided into 100 sec bins |
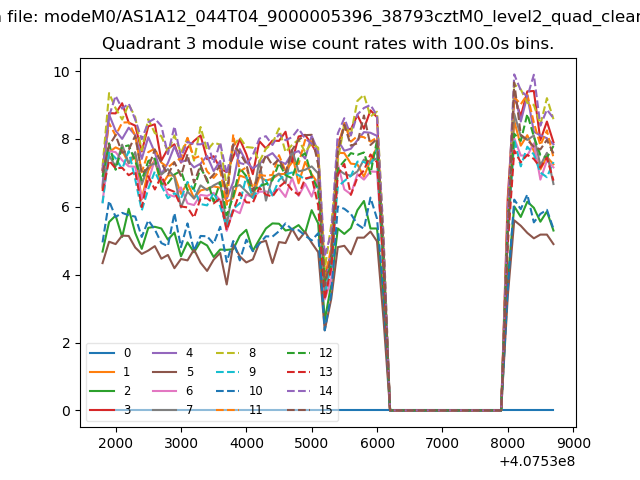 |
 |
| Parameter | Plot |
|---|---|
| CZT HV Monitor | 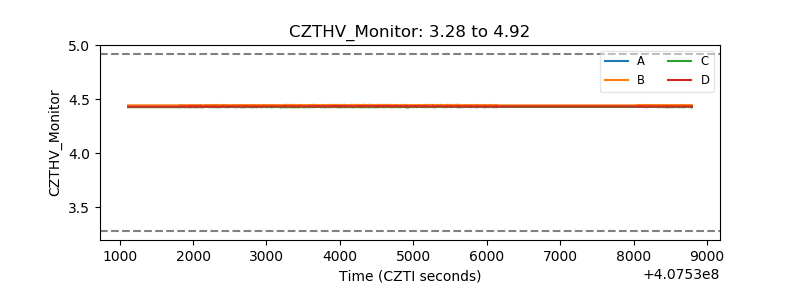 |
| D_VDD | 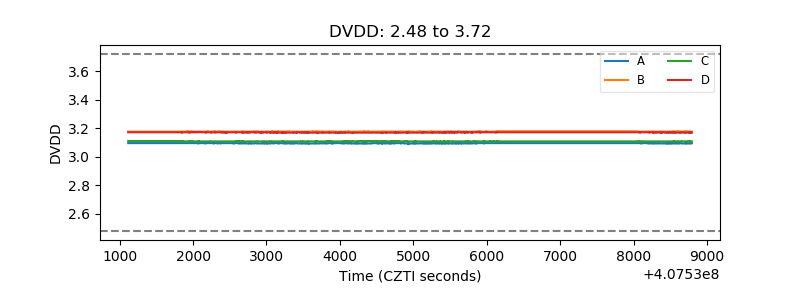 |
| Temperature 1 | 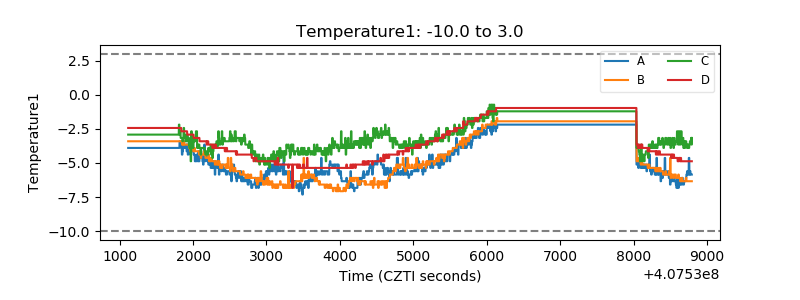 |
| Veto HV Monitor | 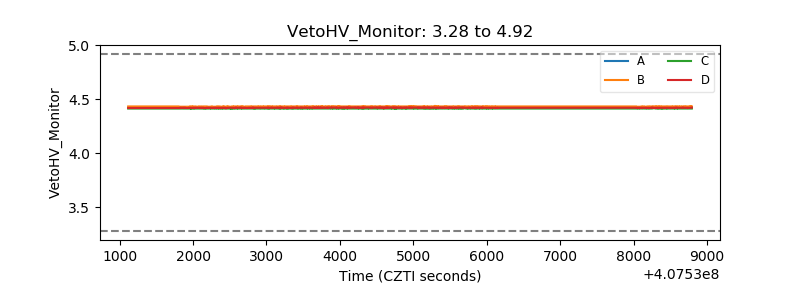 |
| Veto LLD | 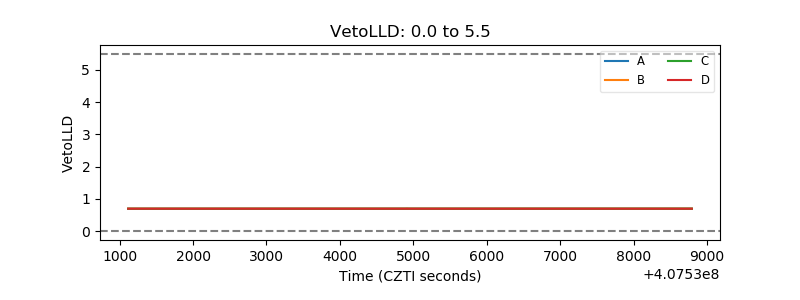 |
| Alpha Counter | 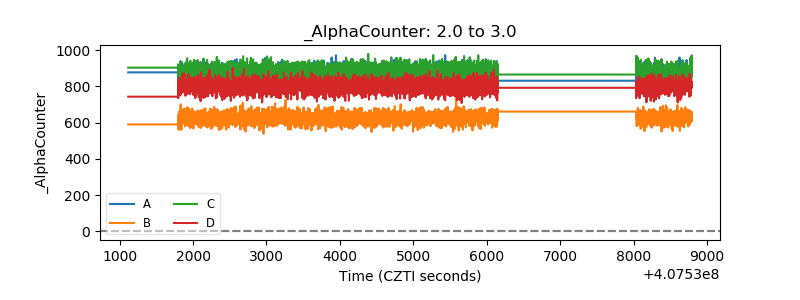 |
| _CPM_Rate | 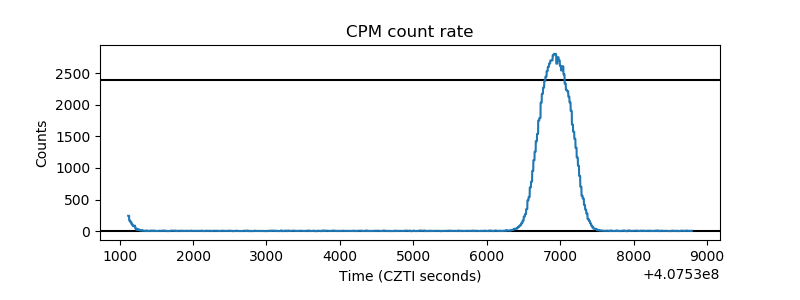 |
| CZT Counter | 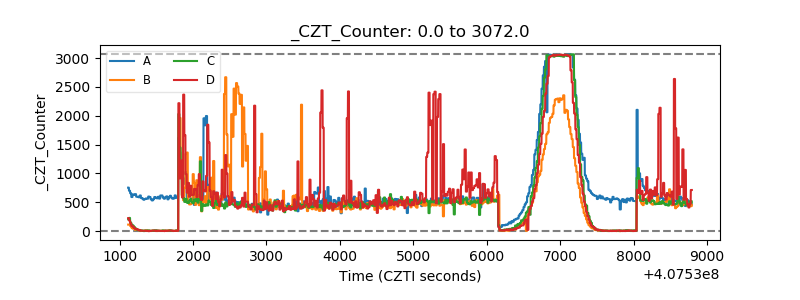 |
| +2.5 Volts monitor | 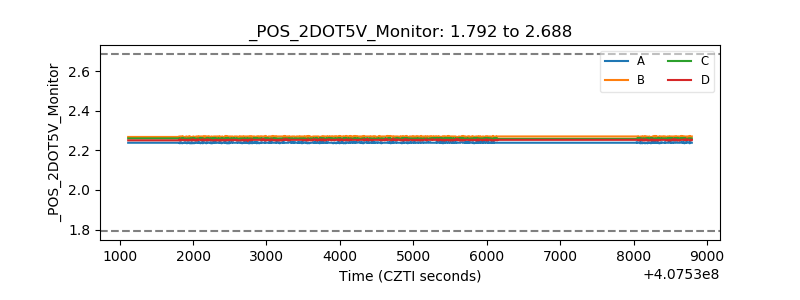 |
| +5 Volts monitor | 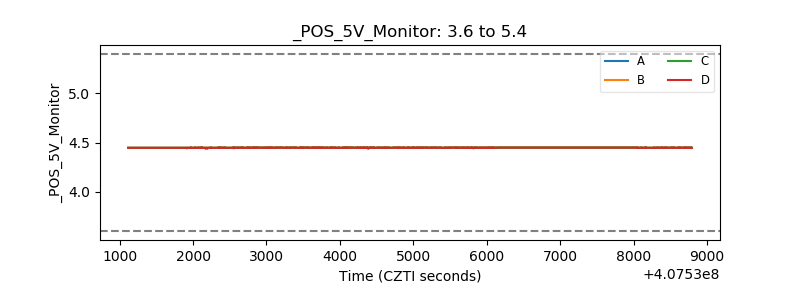 |
| _ROLL_ROT | 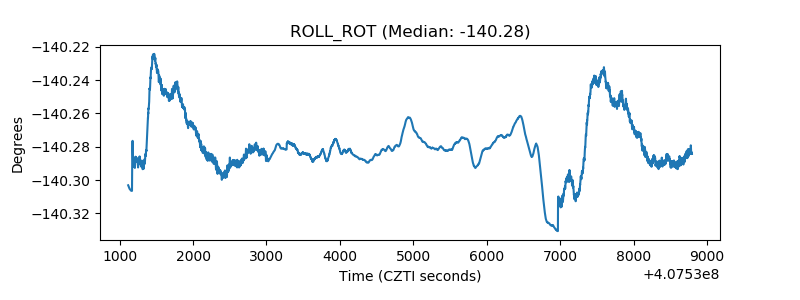 |
| _Roll_DEC | 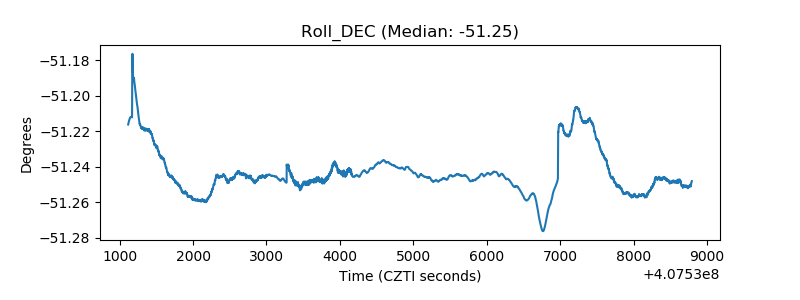 |
| _Roll_RA | 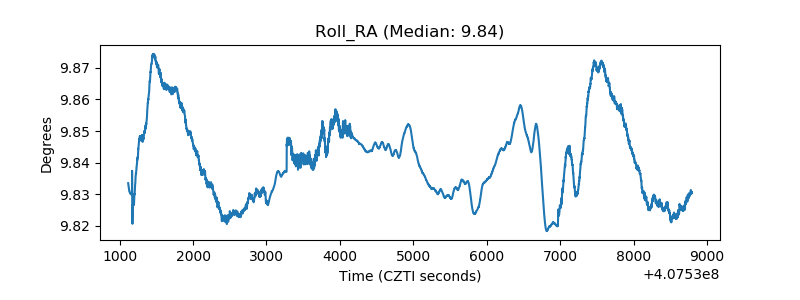 |
| Veto Counter | 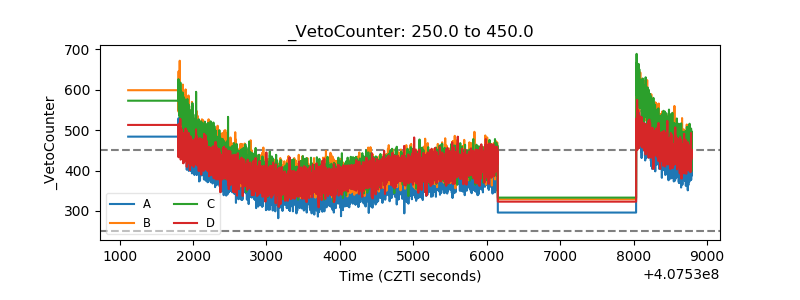 |