| Param | Original file | Final file |
|---|---|---|
| Filename | modeM0/AS1A12_044T04_9000005396_38794cztM0_level2.fits | modeM0/AS1A12_044T04_9000005396_38794cztM0_level2_quad_clean.evt |
| Size (bytes) | 349,200,000 | 96,943,680 |
| Size | 333.0 MB | 92.5 MB |
| Events in quadrant A | 2,879,916 | 658,332 |
| Events in quadrant B | 3,060,593 | 682,474 |
| Events in quadrant C | 2,723,029 | 643,819 |
| Events in quadrant D | 3,848,340 | 578,305 |
| Mode M0 | |||
|---|---|---|---|
| Quadrant | BADHDUFLAG | Total packets | Discarded packets |
| A | 0 | 11792 | 3 |
| B | 0 | 12401 | 2 |
| C | 0 | 11129 | 2 |
| D | 0 | 15154 | 2 |
| Mode SS | |||
|---|---|---|---|
| Quadrant | BADHDUFLAG | Total packets | Discarded packets |
| A | 0 | 108 | 0 |
| B | 0 | 108 | 0 |
| C | 0 | 108 | 0 |
| D | 0 | 108 | 0 |
| Mode M9 | |||
|---|---|---|---|
| Quadrant | BADHDUFLAG | Total packets | Discarded packets |
| A | 0 | 29 | 0 |
| B | 0 | 29 | 0 |
| C | 0 | 29 | 0 |
| D | 0 | 30 | 0 |
| Quadrant | Total seconds | Saturated seconds | Saturation percentage |
|---|---|---|---|
| A | 5324 | 11 | 0.206612% |
| B | 5324 | 81 | 1.521412% |
| C | 5324 | 10 | 0.187829% |
| D | 5324 | 107 | 2.009767% |
Noise dominated data is calculated using 1-second bins in cleaned event files. If a bin has >2000 counts, and if more than 50% of those come from <1% of pixels, then it is considered to be noise-dominated and hence unusable.
| Quadrant | # 1 sec bins | Bins with >0 counts | Bins with >2000 counts | High rate bins dominated by noise | Noise dominated (total time) | Noise dominated (detector-on time) | Marked lightcurve |
|---|---|---|---|---|---|---|---|
| A | 7327 | 5325 | 7 | 7 | 0.10% | 0.13% | 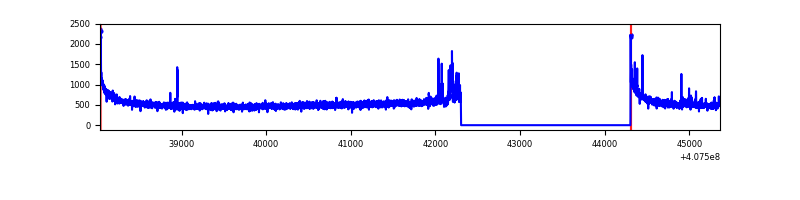 |
| B | 7327 | 5325 | 57 | 57 | 0.78% | 1.07% | 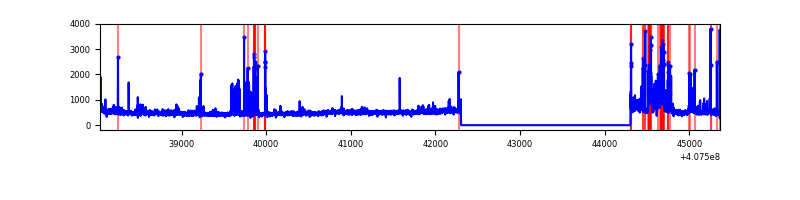 |
| C | 7327 | 5325 | 6 | 6 | 0.08% | 0.11% | 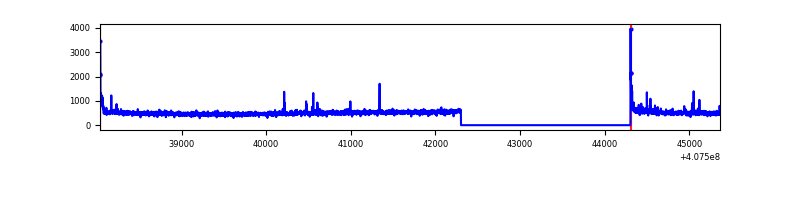 |
| D | 7327 | 5325 | 94 | 94 | 1.28% | 1.77% | 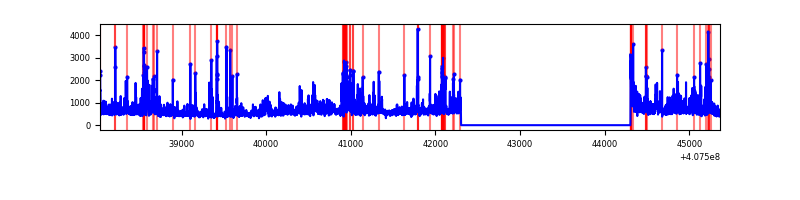 |
Top three noisy pixels from each quadrant. If the there are fewer than three noisy pixels in the level2.evt file, extra rows are filled as -1
| Pixel properties | Quadrant properties | ||||||
|---|---|---|---|---|---|---|---|
| Quadrant | DetID | PixID | Counts | Sigma | Mean | Median | Sigma |
| A | 10 | 83 | 400887 | 3235.42 | 613 | 602 | 123.7 |
| A | 12 | 16 | 62812 | 502.83 | 613 | 602 | 123.7 |
| A | 9 | 143 | 20859 | 163.73 | 613 | 602 | 123.7 |
| B | 5 | 184 | 241696 | 2060.56 | 620 | 604 | 117.0 |
| B | 5 | 200 | 167673 | 1427.9 | 620 | 604 | 117.0 |
| B | 4 | 171 | 94812 | 805.18 | 620 | 604 | 117.0 |
| C | 15 | 214 | 235701 | 1669.62 | 610 | 613 | 140.8 |
| C | 0 | 10 | 55731 | 391.45 | 610 | 613 | 140.8 |
| C | 14 | 254 | 33963 | 236.86 | 610 | 613 | 140.8 |
| D | 12 | 235 | 574426 | 3998.58 | 594 | 580 | 143.5 |
| D | 2 | 16 | 442828 | 3081.6 | 594 | 580 | 143.5 |
| D | 10 | 118 | 197857 | 1374.63 | 594 | 580 | 143.5 |
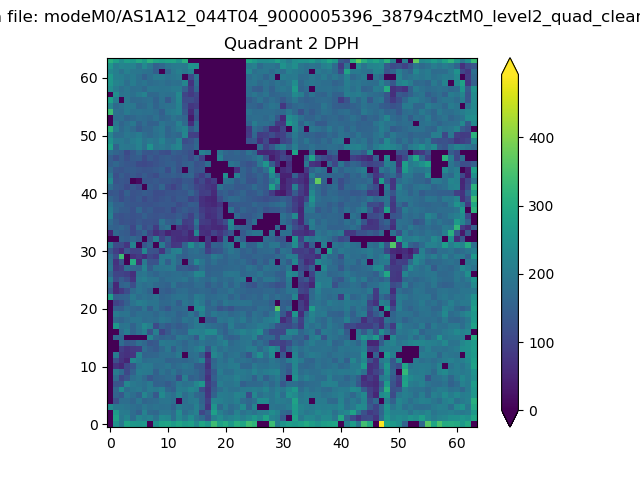
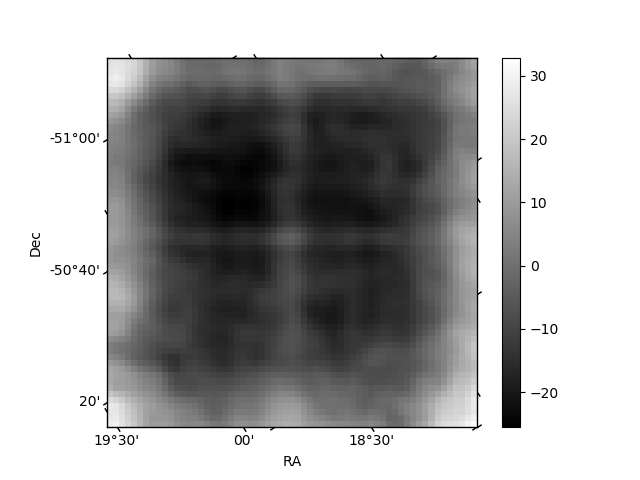
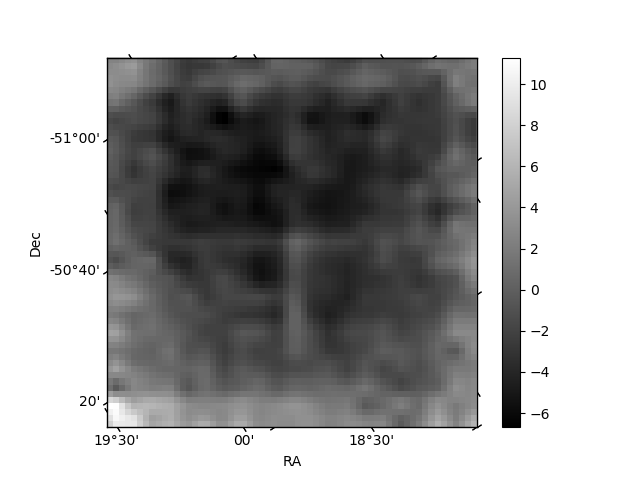
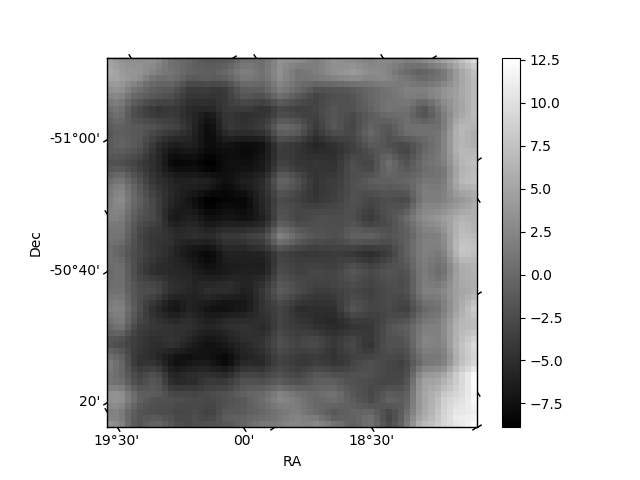
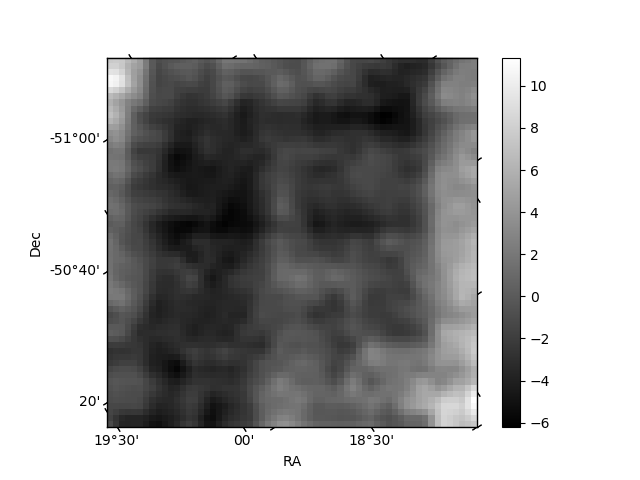
Histogram calculated using DETX and DETY for each event in the final _common_clean file
| Quadrant A | 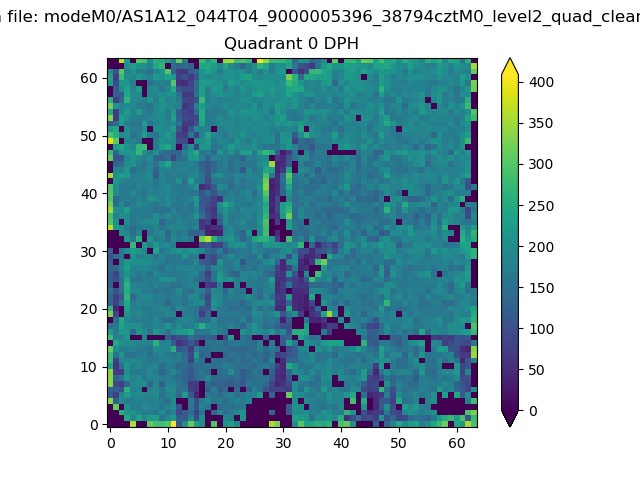 |
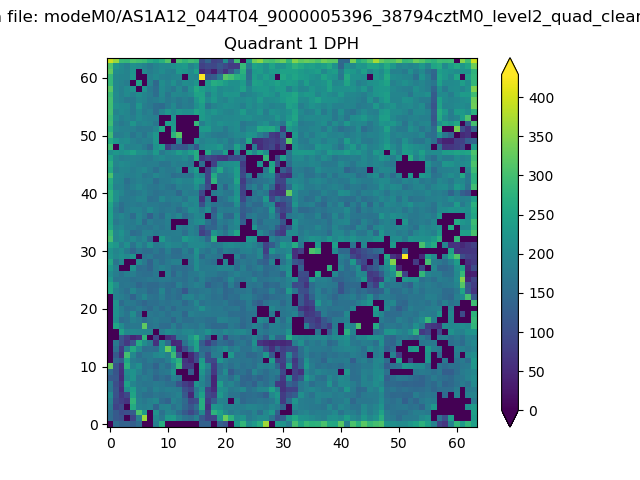 |
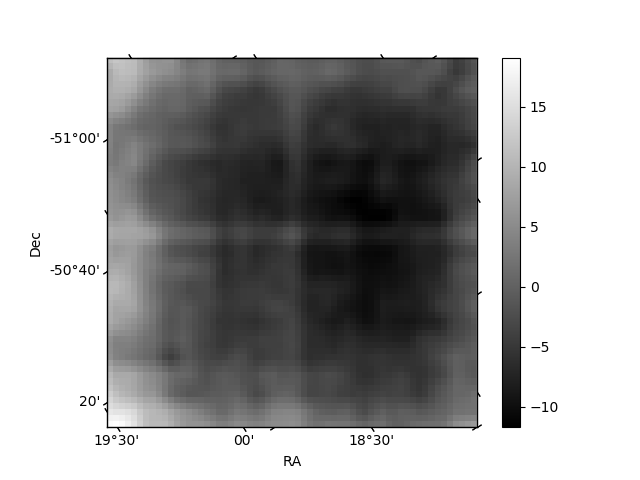
Quadrant B |
|---|---|---|---|
| Quadrant D | 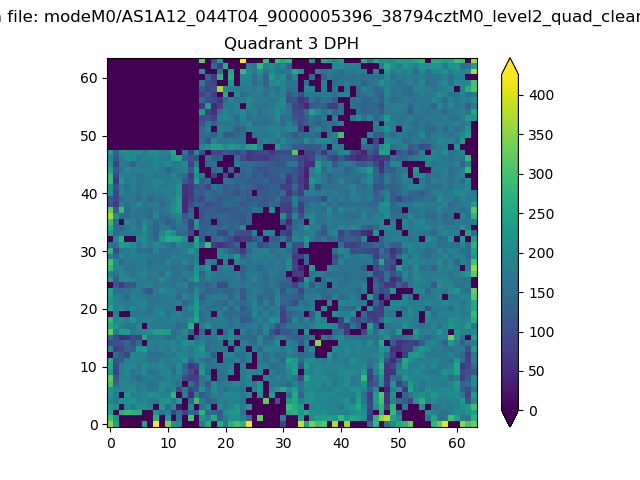 |
 |
Quadrant C |
| Plot type | Count rate plots | Images |
|---|---|---|
| Comparison with Poisson distribution Blue bars denote a histogram of data divided into 1 sec bins. Red curve is a Poisson curve with rate = median count rate of data. |
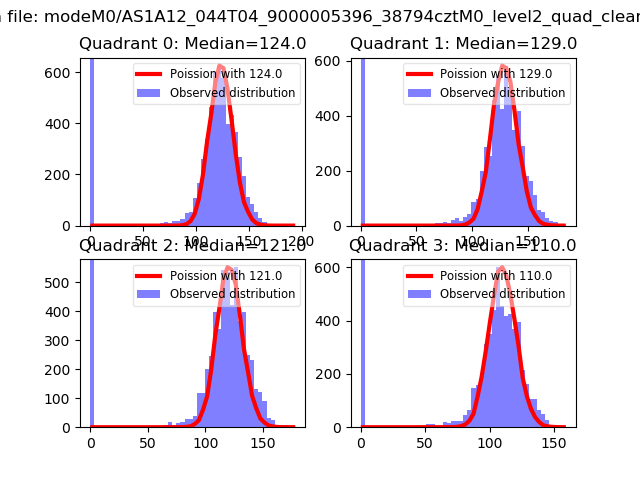 |
 |
| Quadrant-wise count rates Data is divided into 100 sec bins |
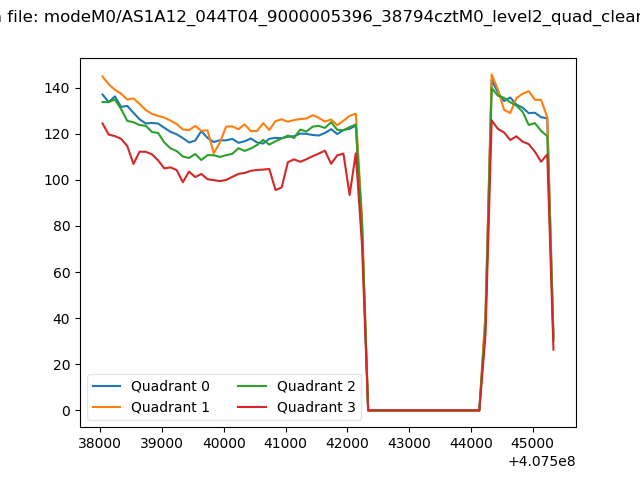 |
|
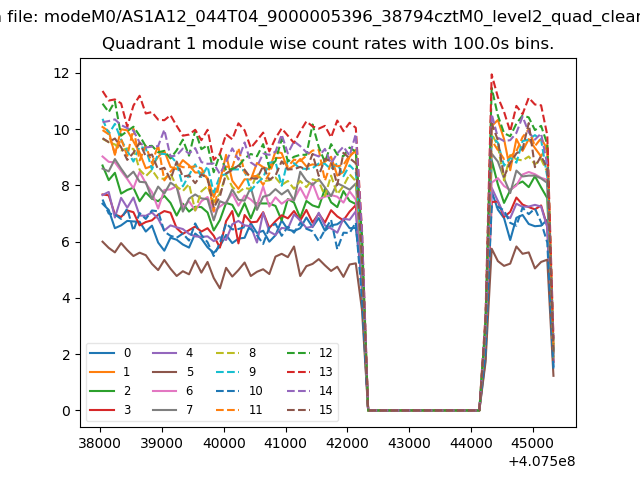
| Module-wise count rates for Quadrant A Data is divided into 100 sec bins |
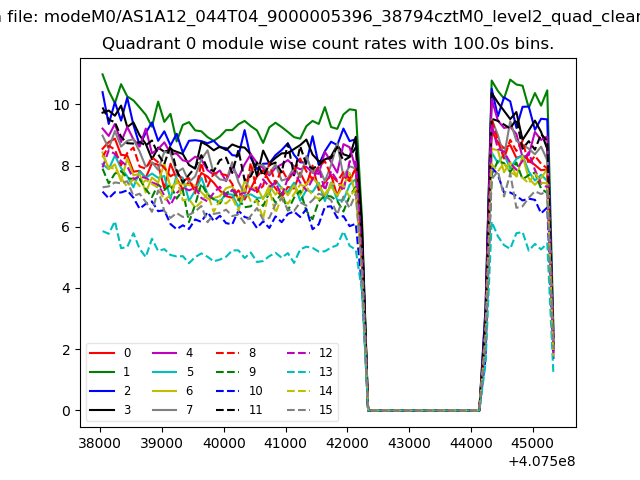 |
 |
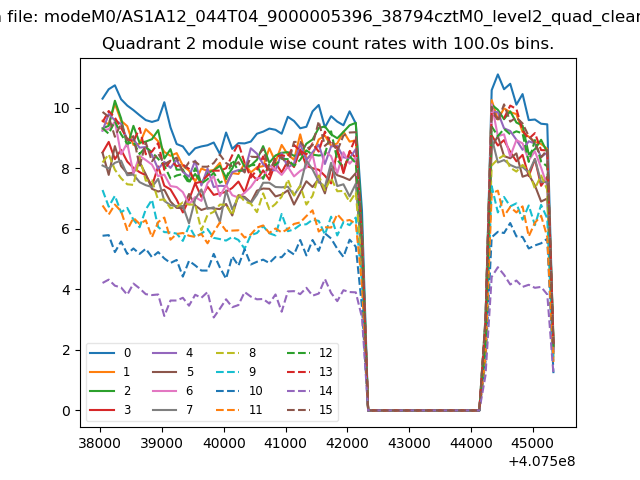
| Module-wise count rates for Quadrant B Data is divided into 100 sec bins |
 |
 |
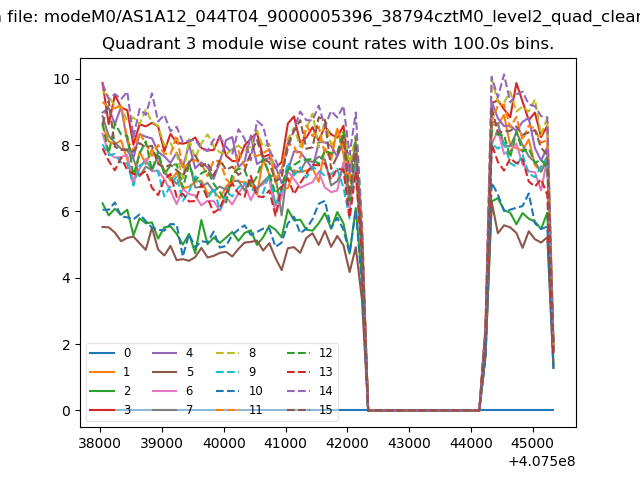
| Module-wise count rates for Quadrant C Data is divided into 100 sec bins |
 |
 |
| Module-wise count rates for Quadrant D Data is divided into 100 sec bins |
 |
 |
| Parameter | Plot |
|---|---|
| CZT HV Monitor | 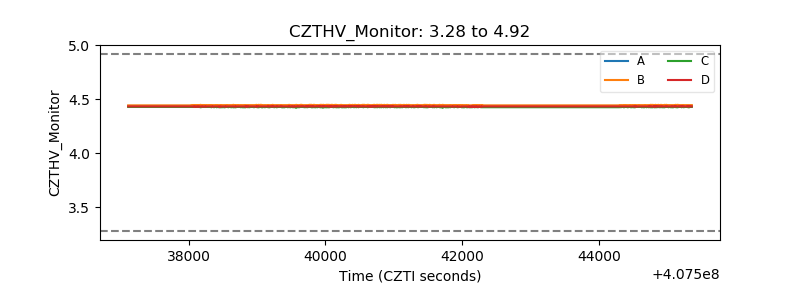 |
| D_VDD | 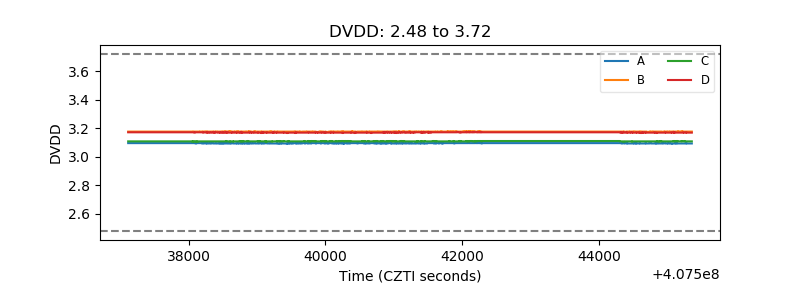 |
| Temperature 1 | 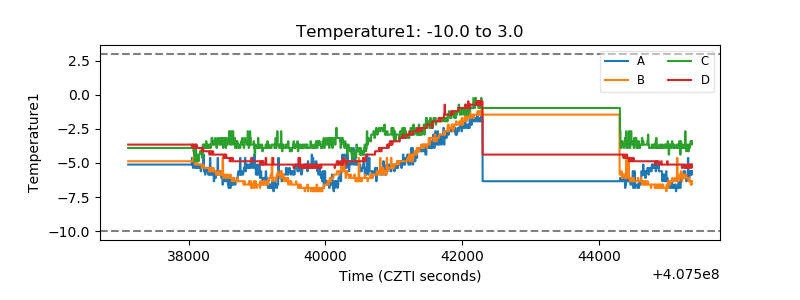 |
| Veto HV Monitor | 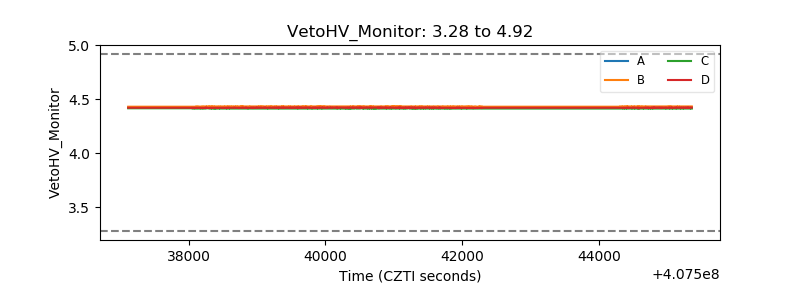 |
| Veto LLD | 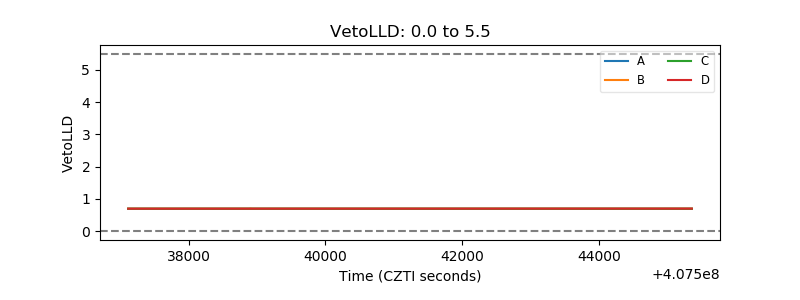 |
| Alpha Counter | 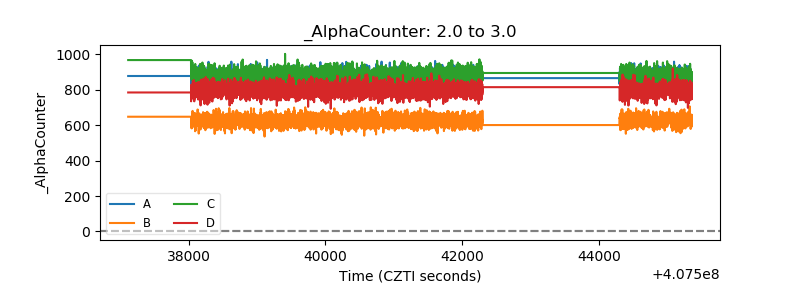 |
| _CPM_Rate | 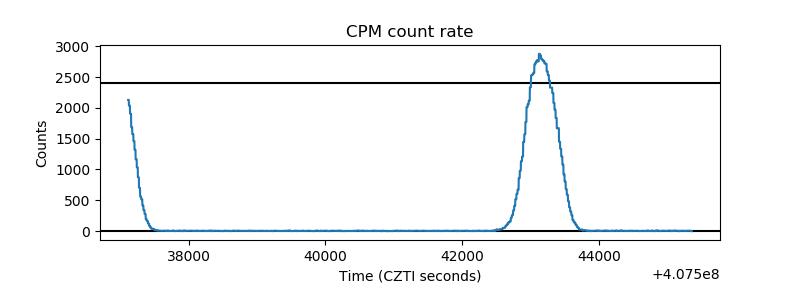 |
| CZT Counter | 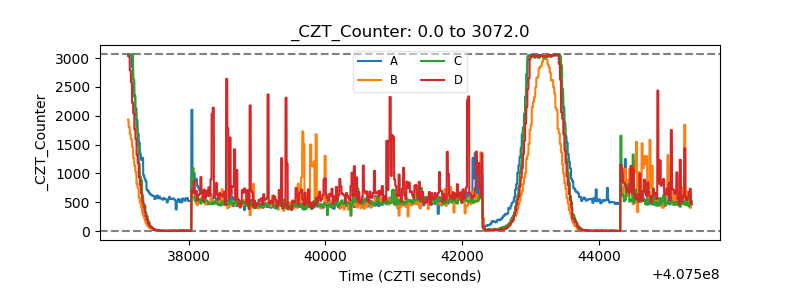 |
| +2.5 Volts monitor | 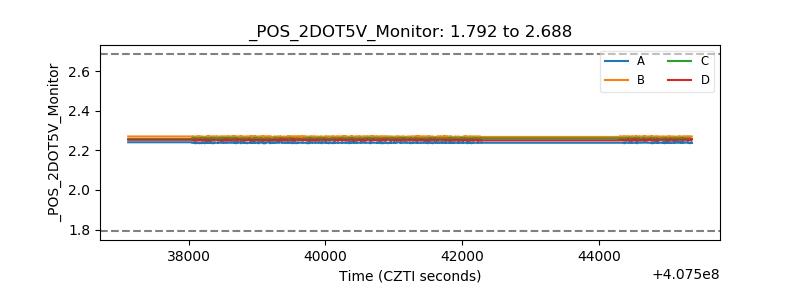 |
| +5 Volts monitor | 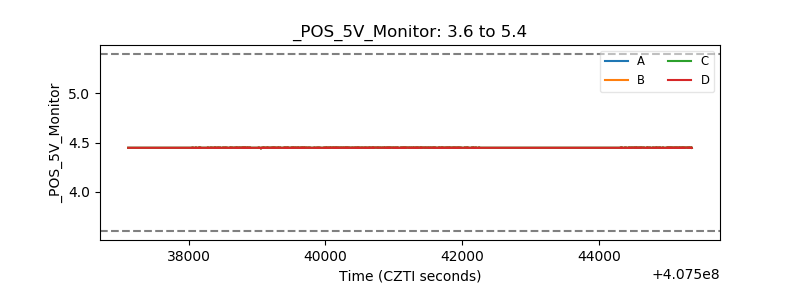 |
| _ROLL_ROT | 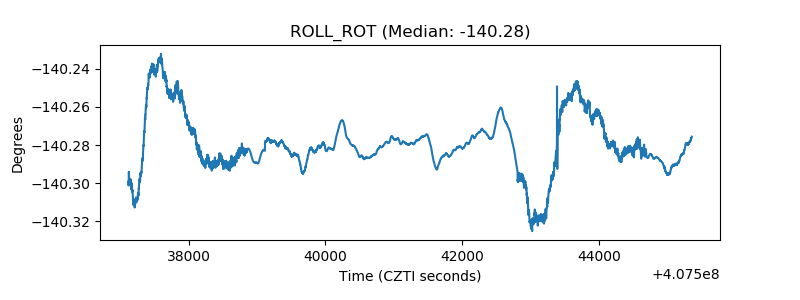 |
| _Roll_DEC | 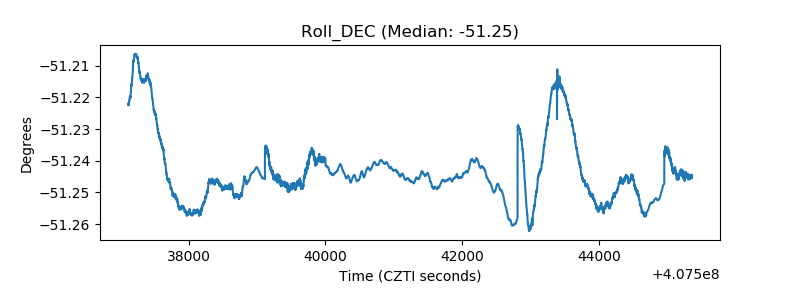 |
| _Roll_RA | 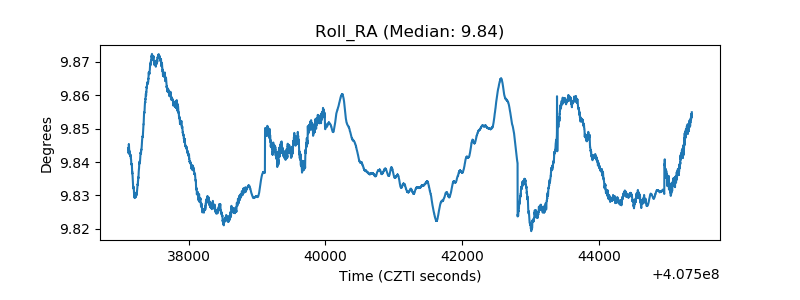 |
| Veto Counter | 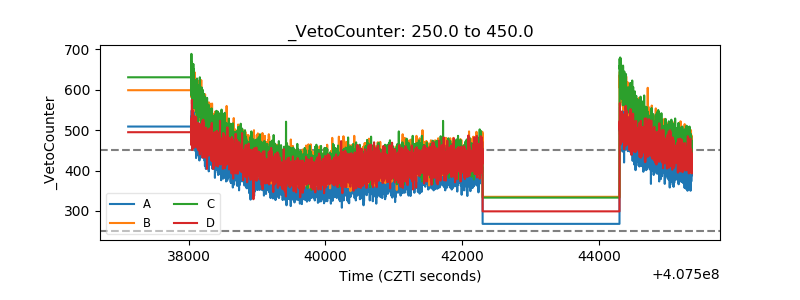 |