| Param | Original file | Final file |
|---|---|---|
| Filename | modeM0/AS1A12_044T04_9000005396_38795cztM0_level2.fits | modeM0/AS1A12_044T04_9000005396_38795cztM0_level2_quad_clean.evt |
| Size (bytes) | 401,477,760 | 95,520,960 |
| Size | 382.9 MB | 91.1 MB |
| Events in quadrant A | 2,910,617 | 652,409 |
| Events in quadrant B | 3,010,246 | 680,520 |
| Events in quadrant C | 3,039,581 | 638,803 |
| Events in quadrant D | 5,494,461 | 554,118 |
| Mode M0 | |||
|---|---|---|---|
| Quadrant | BADHDUFLAG | Total packets | Discarded packets |
| A | 0 | 11751 | 3 |
| B | 0 | 12140 | 2 |
| C | 0 | 12013 | 2 |
| D | 0 | 20011 | 2 |
| Mode SS | |||
|---|---|---|---|
| Quadrant | BADHDUFLAG | Total packets | Discarded packets |
| A | 0 | 108 | 0 |
| B | 0 | 108 | 0 |
| C | 0 | 108 | 0 |
| D | 0 | 108 | 0 |
| Mode M9 | |||
|---|---|---|---|
| Quadrant | BADHDUFLAG | Total packets | Discarded packets |
| A | 0 | 31 | 0 |
| B | 0 | 31 | 0 |
| C | 0 | 31 | 0 |
| D | 0 | 32 | 0 |
| Quadrant | Total seconds | Saturated seconds | Saturation percentage |
|---|---|---|---|
| A | 5231 | 25 | 0.477920% |
| B | 5231 | 70 | 1.338176% |
| C | 5231 | 49 | 0.936723% |
| D | 5231 | 405 | 7.742305% |
Noise dominated data is calculated using 1-second bins in cleaned event files. If a bin has >2000 counts, and if more than 50% of those come from <1% of pixels, then it is considered to be noise-dominated and hence unusable.
| Quadrant | # 1 sec bins | Bins with >0 counts | Bins with >2000 counts | High rate bins dominated by noise | Noise dominated (total time) | Noise dominated (detector-on time) | Marked lightcurve |
|---|---|---|---|---|---|---|---|
| A | 7324 | 5232 | 14 | 14 | 0.19% | 0.27% | 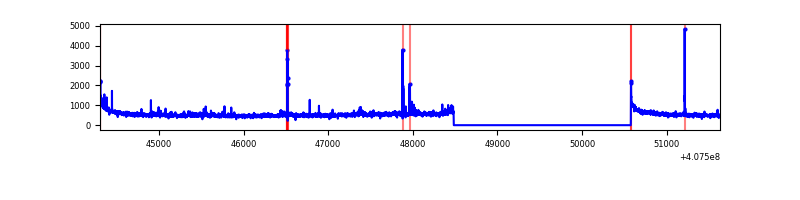 |
| B | 7324 | 5232 | 47 | 47 | 0.64% | 0.90% | 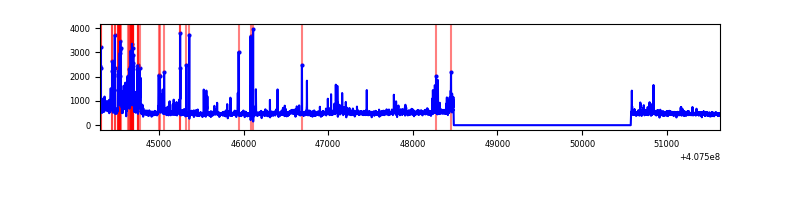 |
| C | 7324 | 5232 | 41 | 41 | 0.56% | 0.78% | 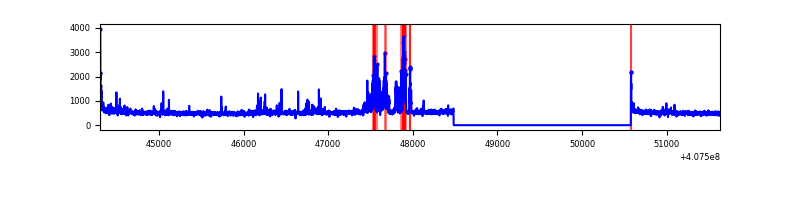 |
| D | 7324 | 5231 | 341 | 341 | 4.66% | 6.52% | 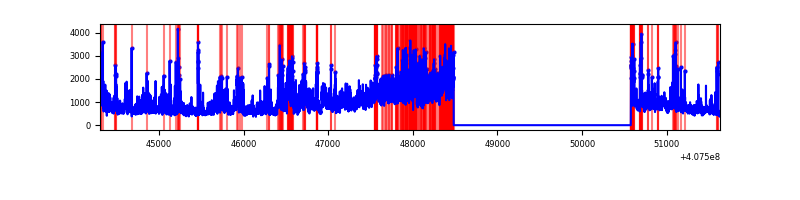 |
Top three noisy pixels from each quadrant. If the there are fewer than three noisy pixels in the level2.evt file, extra rows are filled as -1
| Pixel properties | Quadrant properties | ||||||
|---|---|---|---|---|---|---|---|
| Quadrant | DetID | PixID | Counts | Sigma | Mean | Median | Sigma |
| A | 10 | 83 | 390494 | 3183.97 | 609 | 599 | 122.5 |
| A | 12 | 16 | 71598 | 579.79 | 609 | 599 | 122.5 |
| A | 9 | 143 | 40635 | 326.94 | 609 | 599 | 122.5 |
| B | 5 | 184 | 225851 | 1915.39 | 617 | 602 | 117.6 |
| B | 4 | 171 | 200825 | 1702.58 | 617 | 602 | 117.6 |
| B | 0 | 230 | 62294 | 524.59 | 617 | 602 | 117.6 |
| C | 15 | 208 | 317381 | 2265.52 | 606 | 610 | 139.8 |
| C | 15 | 214 | 230497 | 1644.13 | 606 | 610 | 139.8 |
| C | 14 | 254 | 72323 | 512.89 | 606 | 610 | 139.8 |
| D | 12 | 235 | 2165319 | 15251.6 | 586 | 570 | 141.9 |
| D | 2 | 16 | 408133 | 2871.46 | 586 | 570 | 141.9 |
| D | 12 | 227 | 233673 | 1642.31 | 586 | 570 | 141.9 |
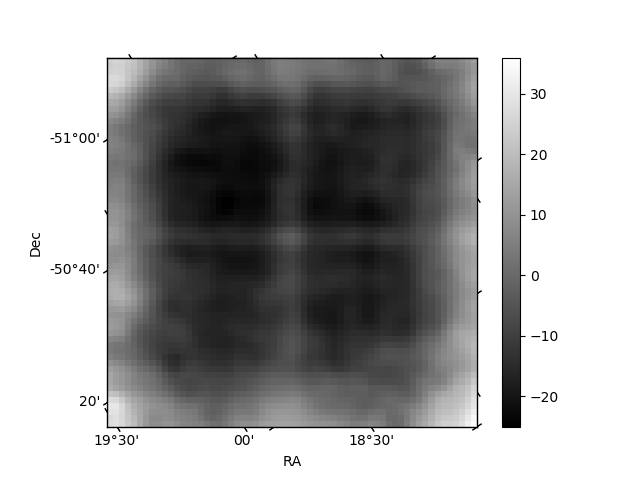
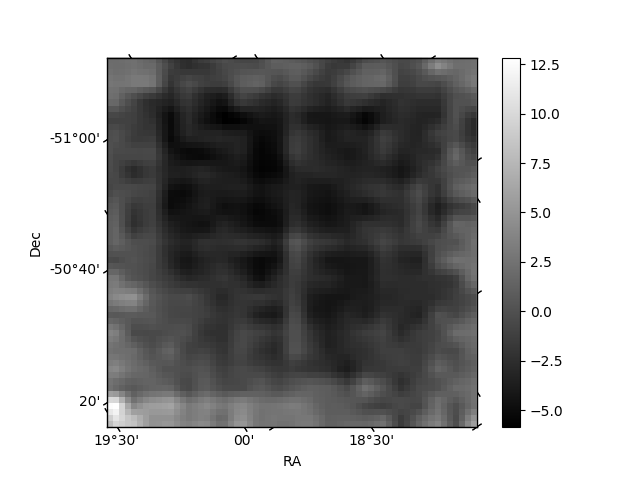
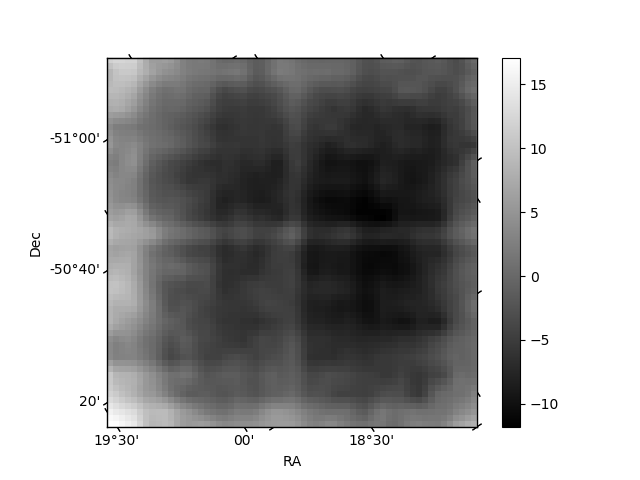
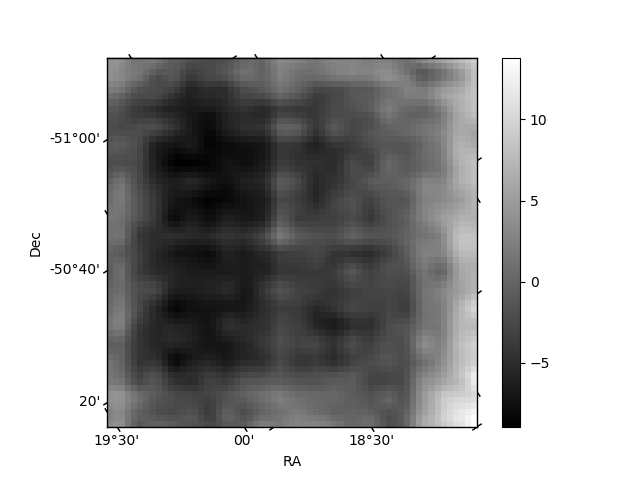
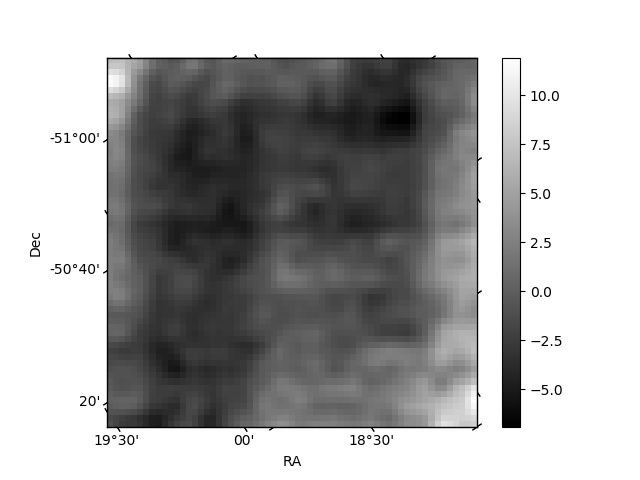
Histogram calculated using DETX and DETY for each event in the final _common_clean file
| Quadrant A | 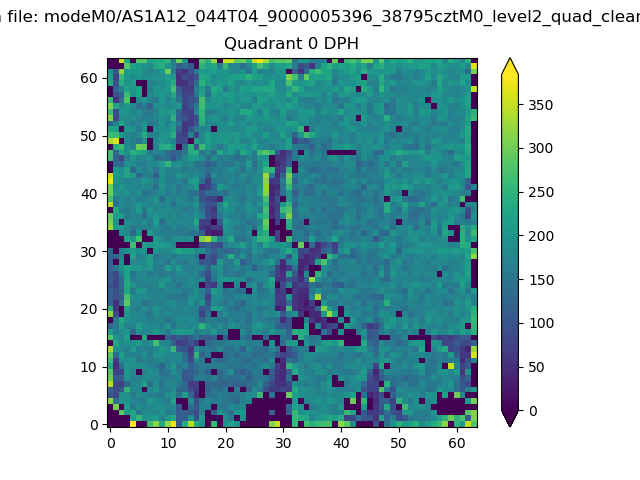 |
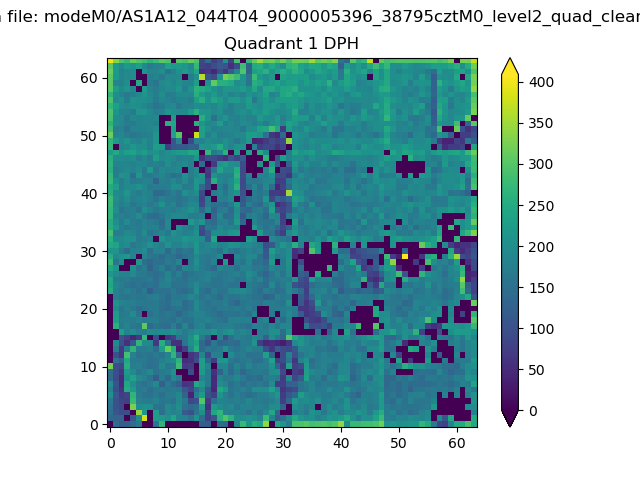 |
Quadrant B |
|---|---|---|---|
| Quadrant D | 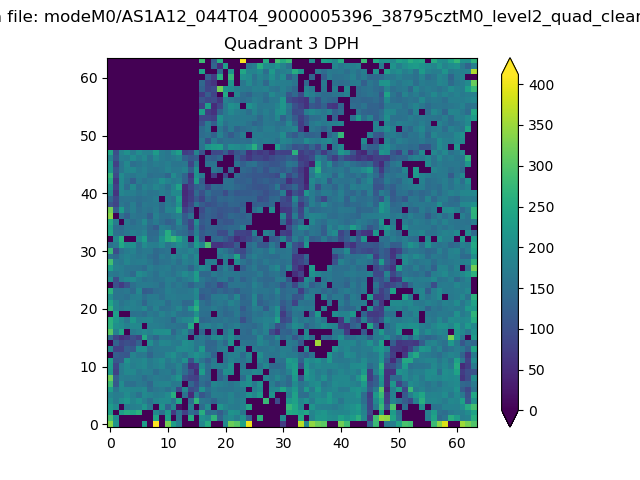 |
 |
Quadrant C |
| Plot type | Count rate plots | Images |
|---|---|---|
| Comparison with Poisson distribution Blue bars denote a histogram of data divided into 1 sec bins. Red curve is a Poisson curve with rate = median count rate of data. |
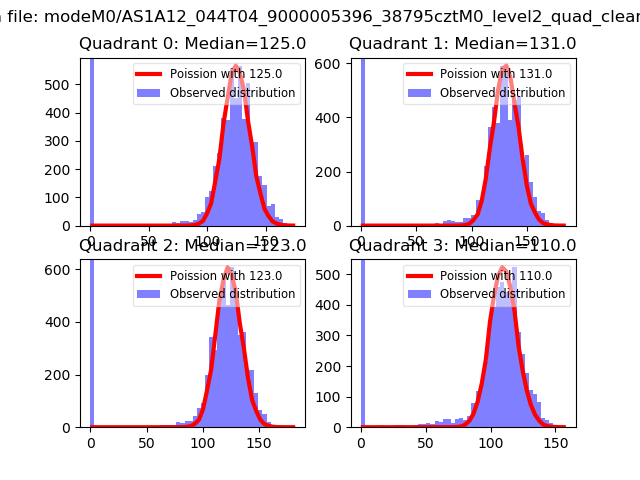 |
 |
| Quadrant-wise count rates Data is divided into 100 sec bins |
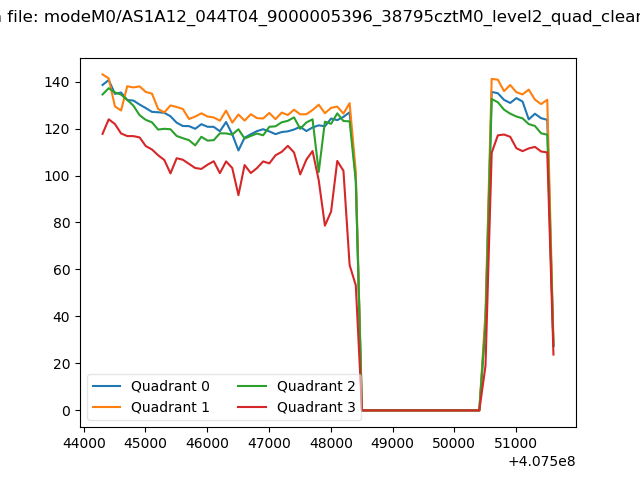 |
|
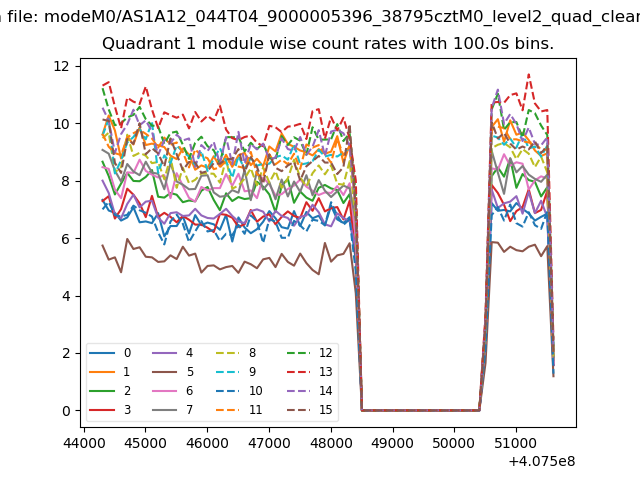
| Module-wise count rates for Quadrant A Data is divided into 100 sec bins |
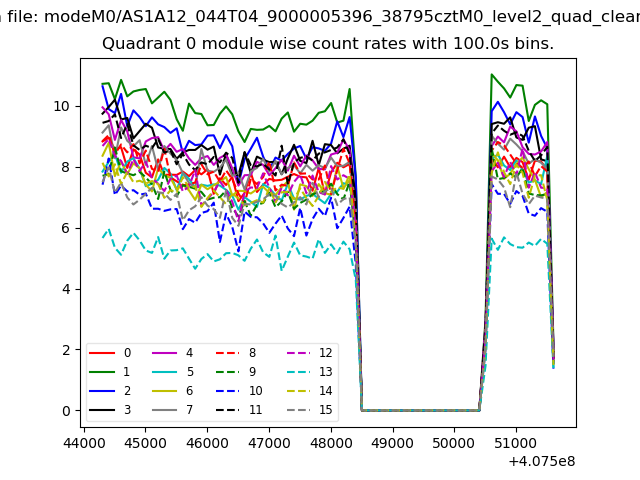 |
 |
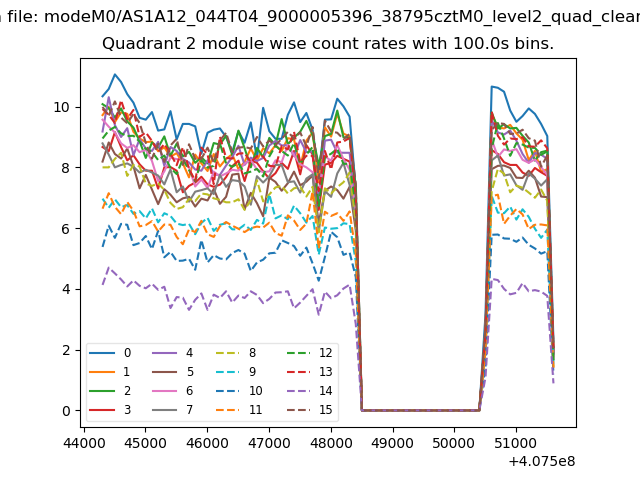
| Module-wise count rates for Quadrant B Data is divided into 100 sec bins |
 |
 |
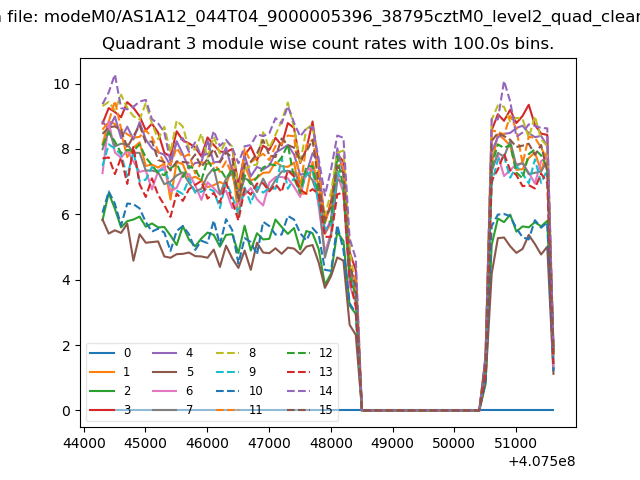
| Module-wise count rates for Quadrant C Data is divided into 100 sec bins |
 |
 |
| Module-wise count rates for Quadrant D Data is divided into 100 sec bins |
 |
 |
| Parameter | Plot |
|---|---|
| CZT HV Monitor | 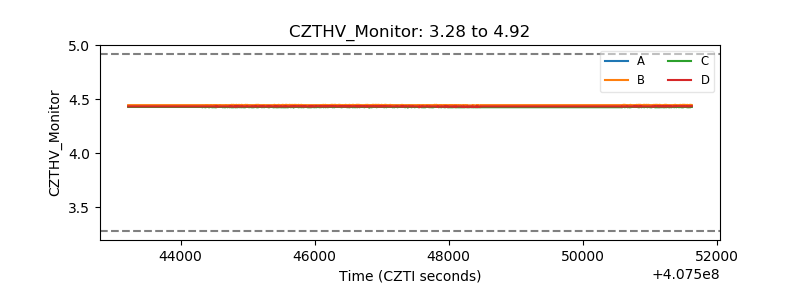 |
| D_VDD | 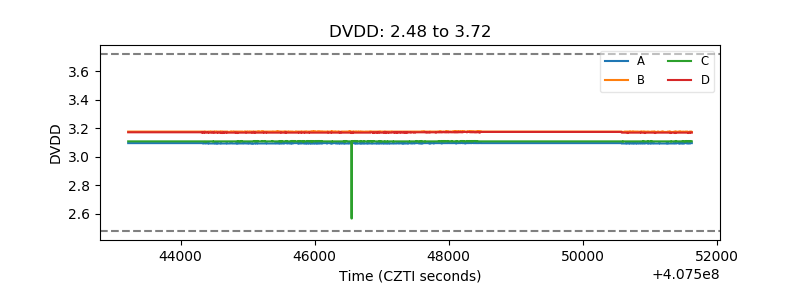 |
| Temperature 1 | 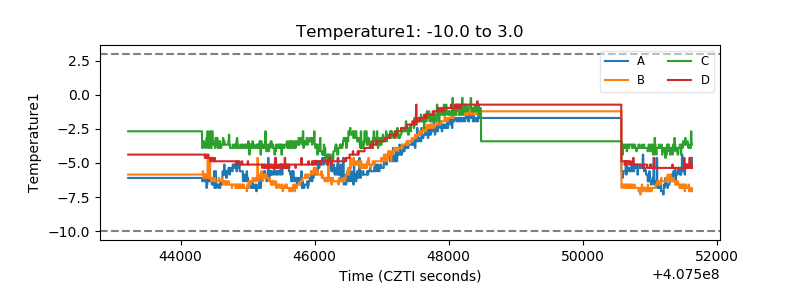 |
| Veto HV Monitor | 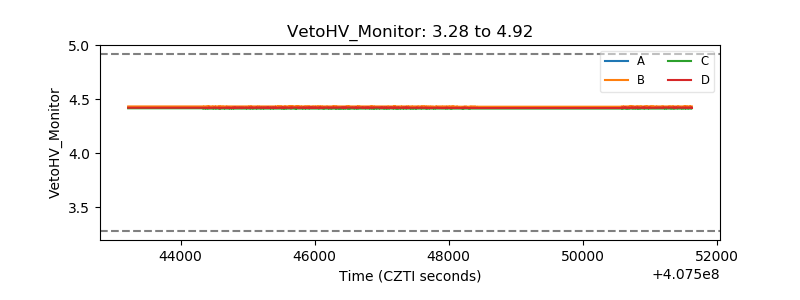 |
| Veto LLD | 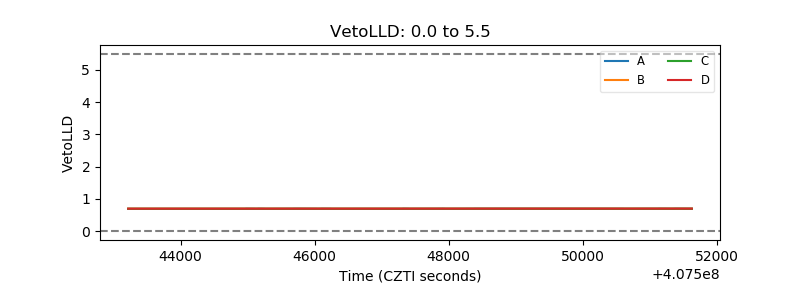 |
| Alpha Counter | 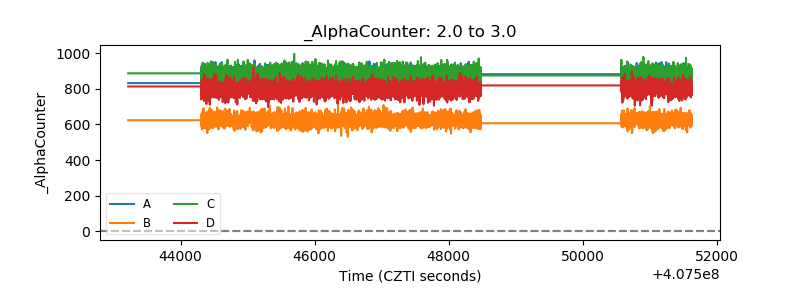 |
| _CPM_Rate | 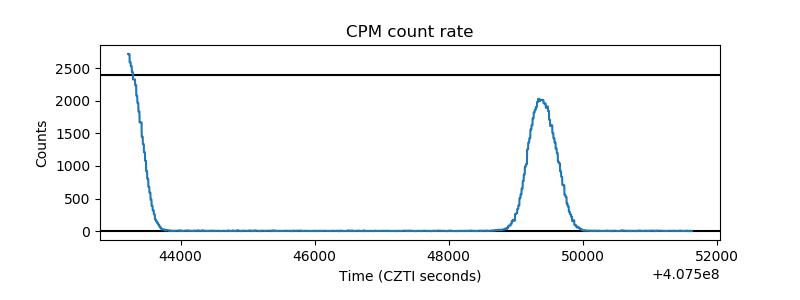 |
| CZT Counter | 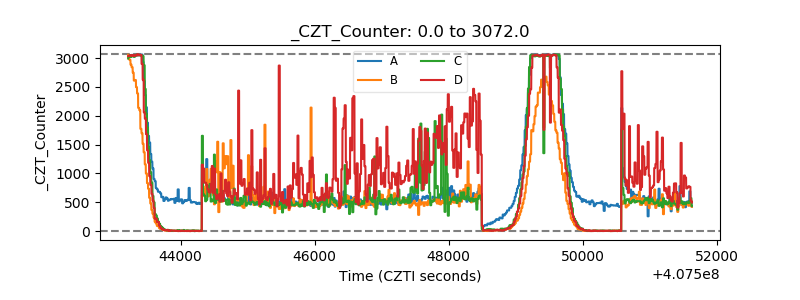 |
| +2.5 Volts monitor | 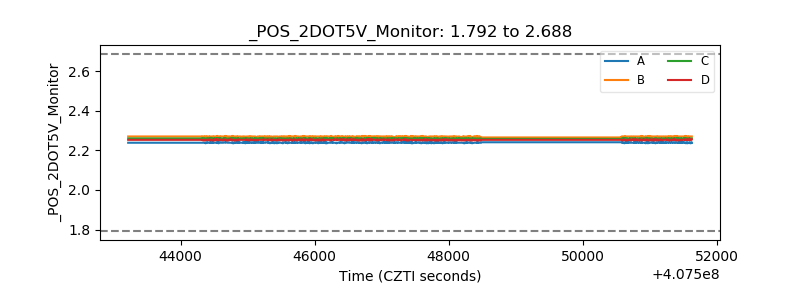 |
| +5 Volts monitor | 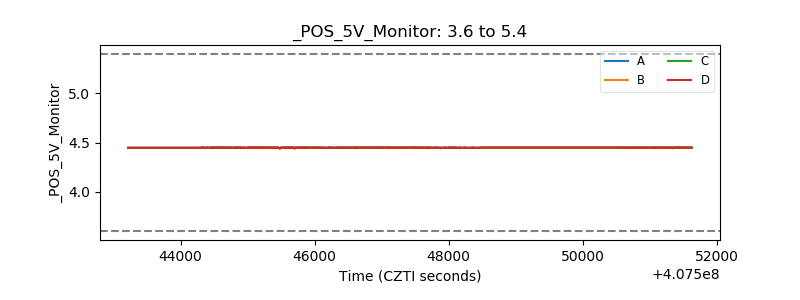 |
| _ROLL_ROT |  |
| _Roll_DEC | 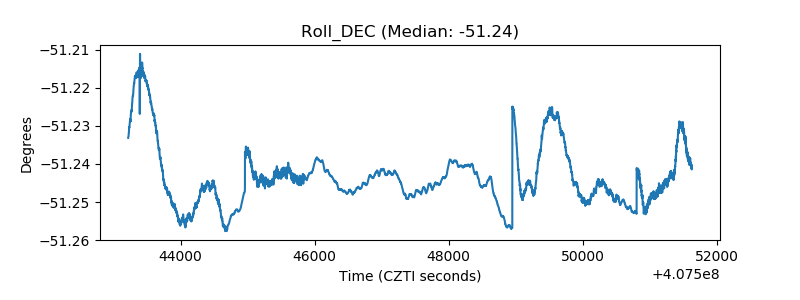 |
| _Roll_RA | 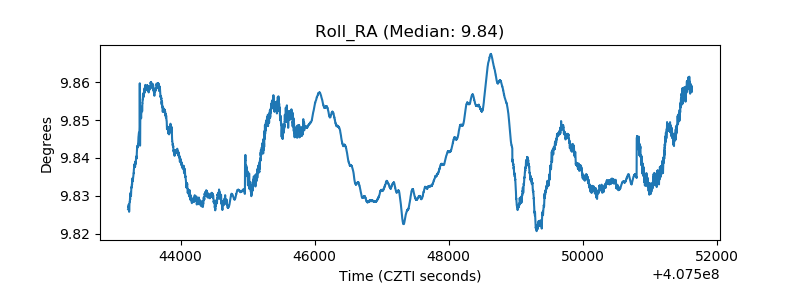 |
| Veto Counter | 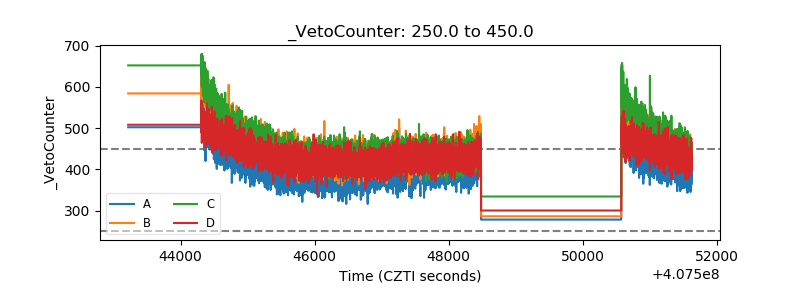 |