| Param | Original file | Final file |
|---|---|---|
| Filename | modeM0/AS1A12_044T04_9000005396_38796cztM0_level2.fits | modeM0/AS1A12_044T04_9000005396_38796cztM0_level2_quad_clean.evt |
| Size (bytes) | 421,649,280 | 87,419,520 |
| Size | 402.1 MB | 83.4 MB |
| Events in quadrant A | 2,951,702 | 619,996 |
| Events in quadrant B | 2,591,599 | 645,548 |
| Events in quadrant C | 2,570,658 | 608,735 |
| Events in quadrant D | 7,099,392 | 417,163 |
| Mode M0 | |||
|---|---|---|---|
| Quadrant | BADHDUFLAG | Total packets | Discarded packets |
| A | 0 | 11766 | 3 |
| B | 0 | 10886 | 2 |
| C | 0 | 10424 | 2 |
| D | 0 | 24652 | 2 |
| Mode SS | |||
|---|---|---|---|
| Quadrant | BADHDUFLAG | Total packets | Discarded packets |
| A | 0 | 104 | 0 |
| B | 0 | 104 | 0 |
| C | 0 | 104 | 0 |
| D | 0 | 104 | 0 |
| Mode M9 | |||
|---|---|---|---|
| Quadrant | BADHDUFLAG | Total packets | Discarded packets |
| A | 0 | 22 | 0 |
| B | 0 | 22 | 0 |
| C | 0 | 22 | 0 |
| D | 0 | 23 | 0 |
| Quadrant | Total seconds | Saturated seconds | Saturation percentage |
|---|---|---|---|
| A | 5074 | 15 | 0.295625% |
| B | 5074 | 35 | 0.689791% |
| C | 5074 | 9 | 0.177375% |
| D | 5074 | 1416 | 27.906977% |
Noise dominated data is calculated using 1-second bins in cleaned event files. If a bin has >2000 counts, and if more than 50% of those come from <1% of pixels, then it is considered to be noise-dominated and hence unusable.
| Quadrant | # 1 sec bins | Bins with >0 counts | Bins with >2000 counts | High rate bins dominated by noise | Noise dominated (total time) | Noise dominated (detector-on time) | Marked lightcurve |
|---|---|---|---|---|---|---|---|
| A | 7196 | 5075 | 5 | 5 | 0.07% | 0.10% | 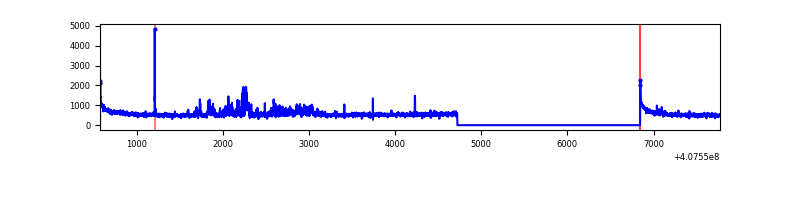 |
| B | 7196 | 5075 | 19 | 19 | 0.26% | 0.37% | 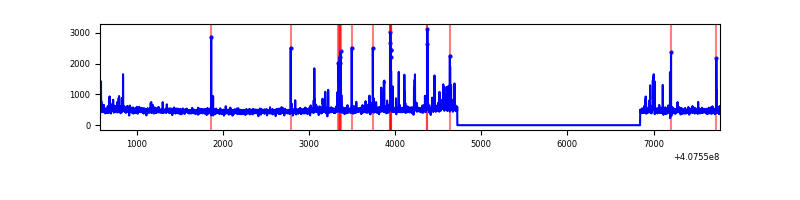 |
| C | 7196 | 5075 | 6 | 6 | 0.08% | 0.12% | 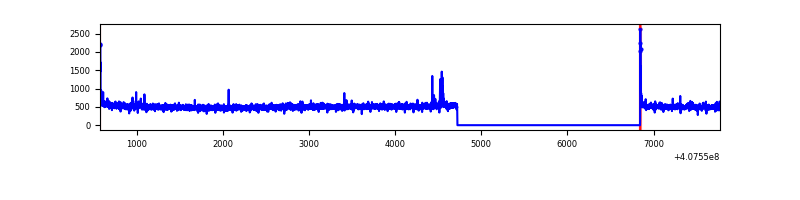 |
| D | 7196 | 5075 | 1297 | 1297 | 18.02% | 25.56% | 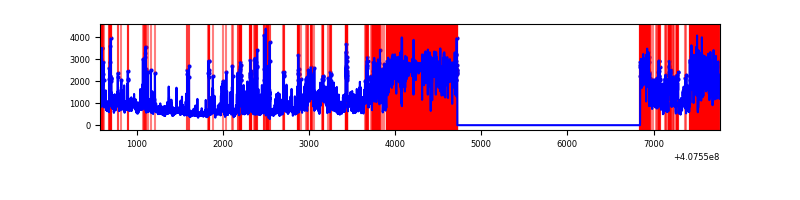 |
Top three noisy pixels from each quadrant. If the there are fewer than three noisy pixels in the level2.evt file, extra rows are filled as -1
| Pixel properties | Quadrant properties | ||||||
|---|---|---|---|---|---|---|---|
| Quadrant | DetID | PixID | Counts | Sigma | Mean | Median | Sigma |
| A | 10 | 83 | 391527 | 3322.8 | 587 | 576 | 117.7 |
| A | 12 | 16 | 231214 | 1960.26 | 587 | 576 | 117.7 |
| A | 12 | 194 | 36080 | 301.76 | 587 | 576 | 117.7 |
| B | 4 | 171 | 193214 | 1691.79 | 591 | 575 | 113.9 |
| B | 0 | 230 | 21006 | 179.43 | 591 | 575 | 113.9 |
| B | 5 | 200 | 15563 | 131.63 | 591 | 575 | 113.9 |
| C | 15 | 214 | 224913 | 1646.02 | 584 | 588 | 136.3 |
| C | 0 | 10 | 30611 | 220.3 | 584 | 588 | 136.3 |
| C | 14 | 254 | 23774 | 170.13 | 584 | 588 | 136.3 |
| D | 12 | 235 | 3402367 | 27675.86 | 506 | 492 | 122.9 |
| D | 12 | 227 | 619199 | 5033.47 | 506 | 492 | 122.9 |
| D | 10 | 118 | 536588 | 4361.39 | 506 | 492 | 122.9 |
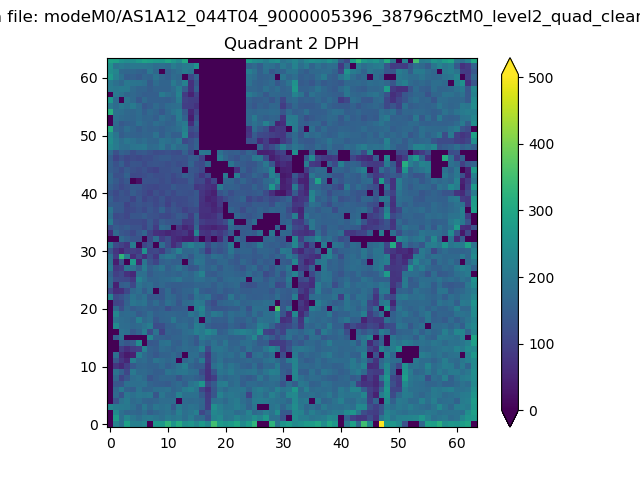
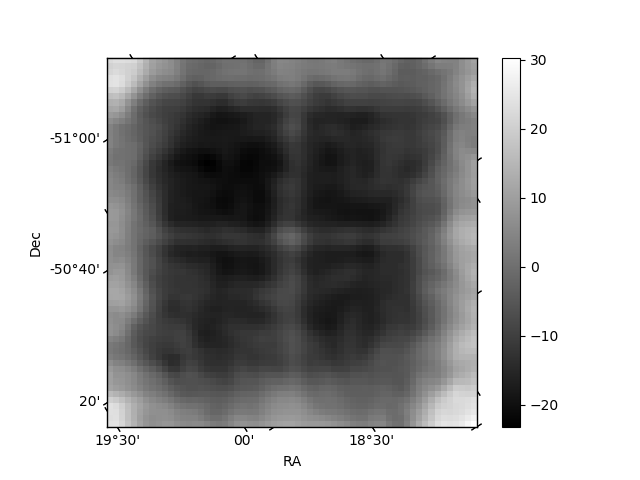
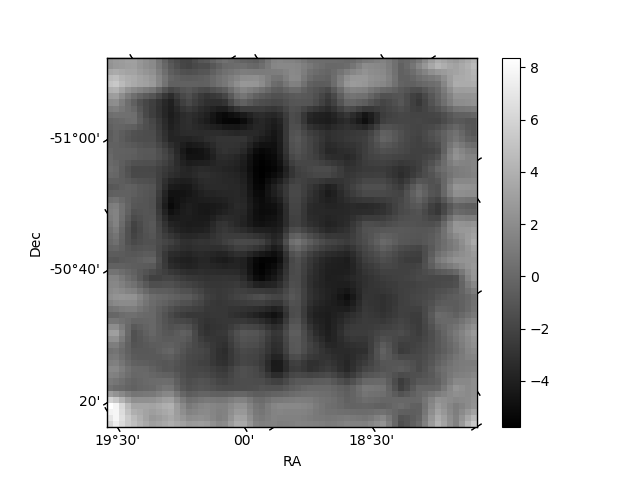
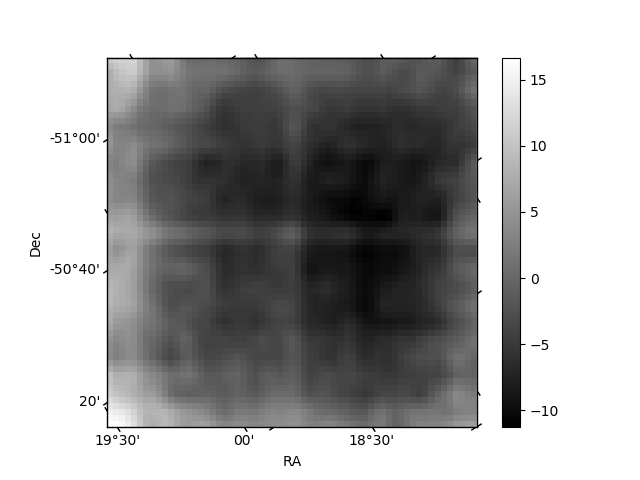
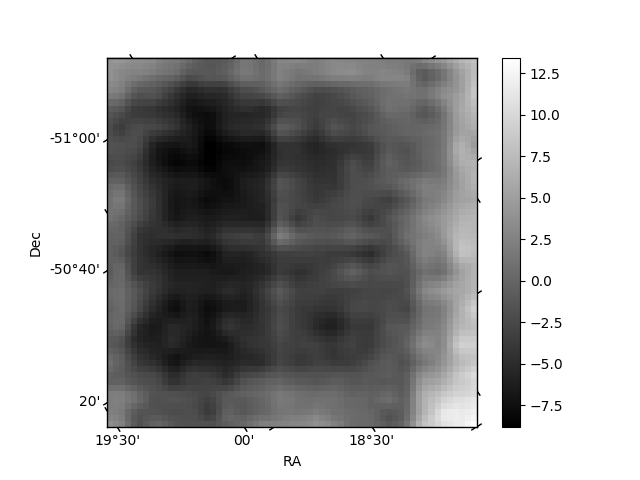
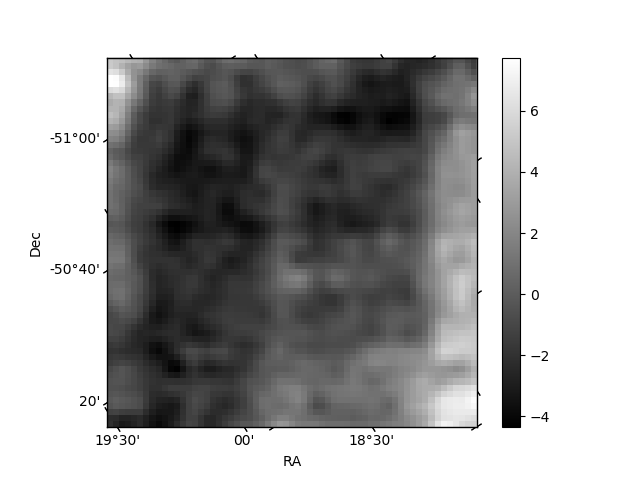
Histogram calculated using DETX and DETY for each event in the final _common_clean file
| Quadrant A | 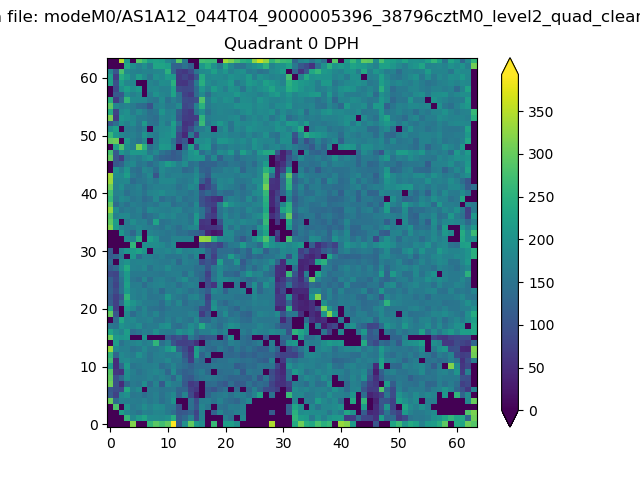 |
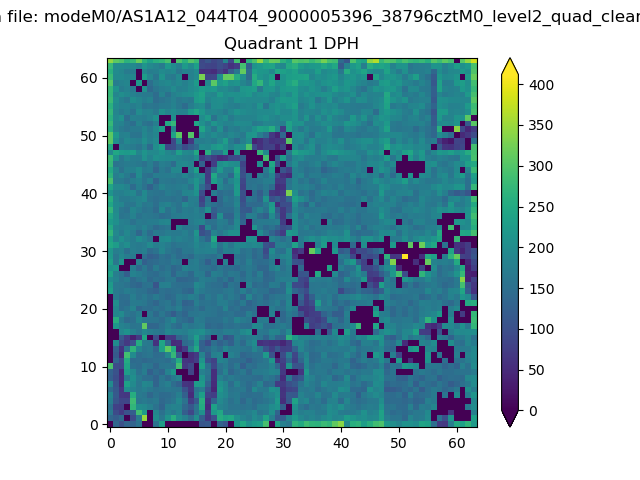 |
Quadrant B |
|---|---|---|---|
| Quadrant D | 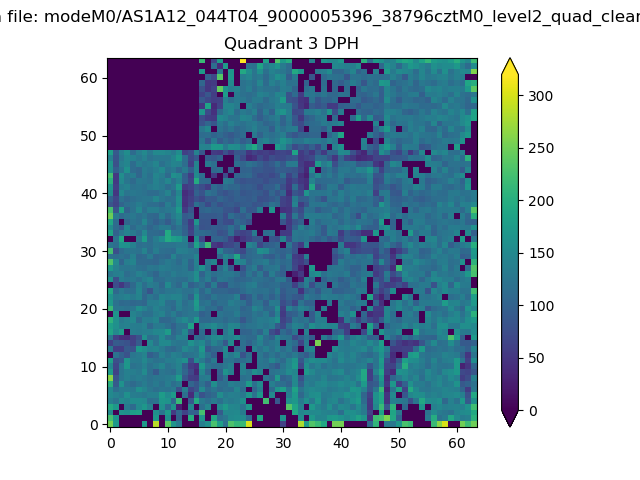 |
 |
Quadrant C |
| Plot type | Count rate plots | Images |
|---|---|---|
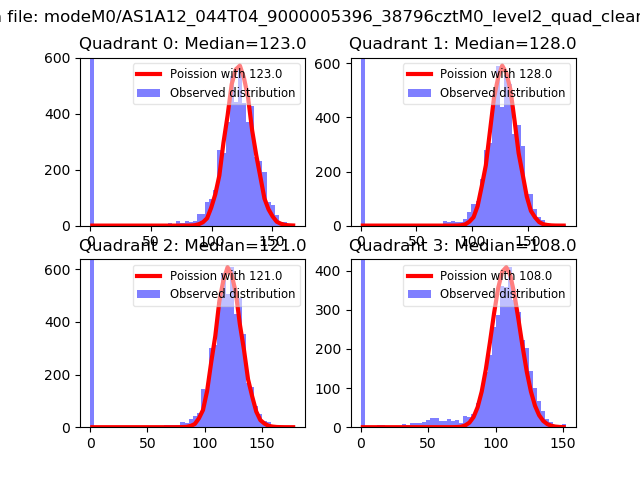
| Comparison with Poisson distribution Blue bars denote a histogram of data divided into 1 sec bins. Red curve is a Poisson curve with rate = median count rate of data. |
 |
 |
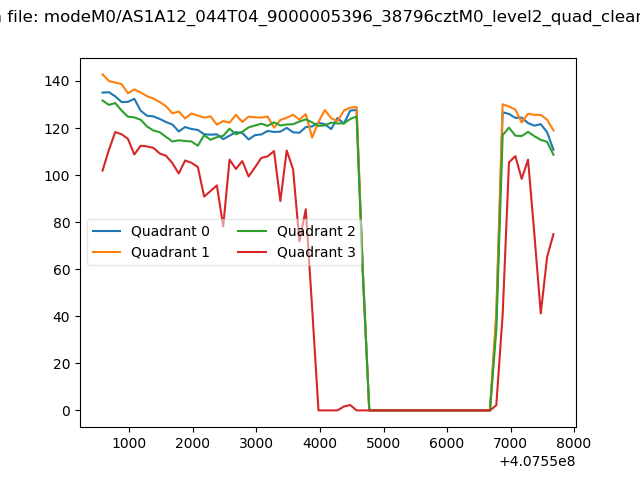
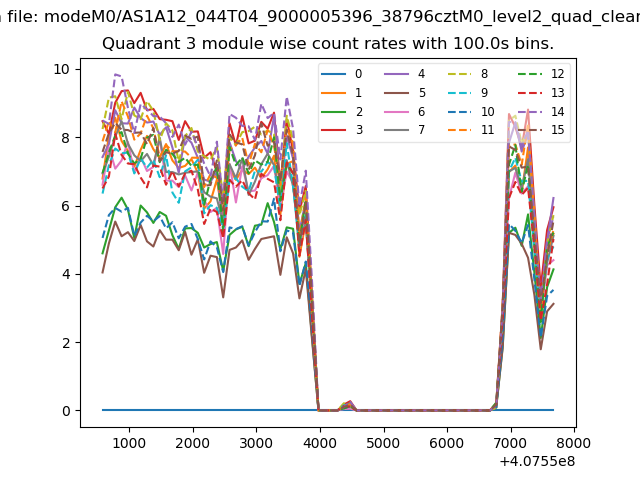
| Quadrant-wise count rates Data is divided into 100 sec bins |
 |
|
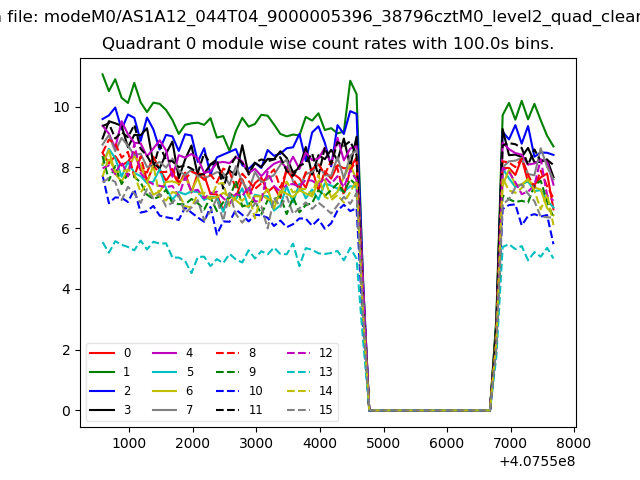
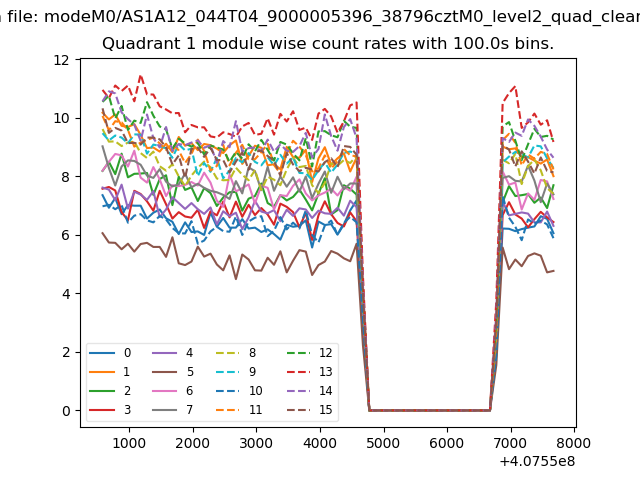
| Module-wise count rates for Quadrant A Data is divided into 100 sec bins |
 |
 |
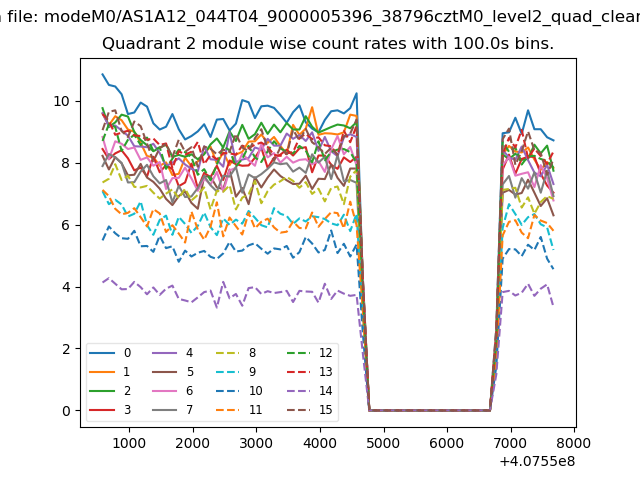
| Module-wise count rates for Quadrant B Data is divided into 100 sec bins |
 |
 |
| Module-wise count rates for Quadrant C Data is divided into 100 sec bins |
 |
 |
| Module-wise count rates for Quadrant D Data is divided into 100 sec bins |
 |
 |
| Parameter | Plot |
|---|---|
| CZT HV Monitor | 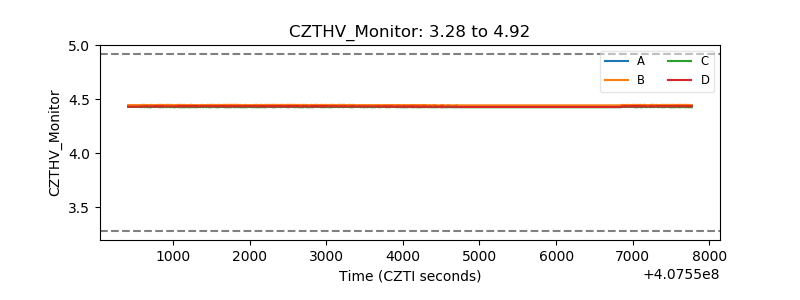 |
| D_VDD | 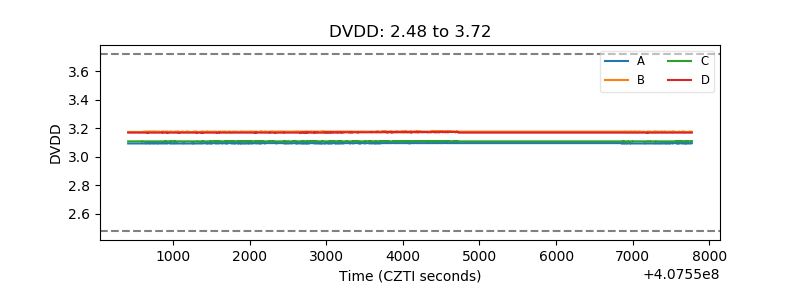 |
| Temperature 1 | 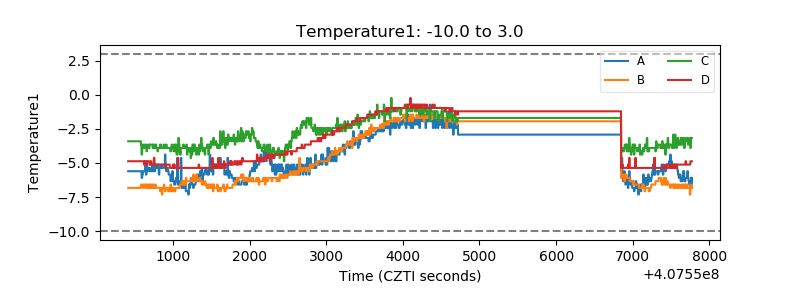 |
| Veto HV Monitor | 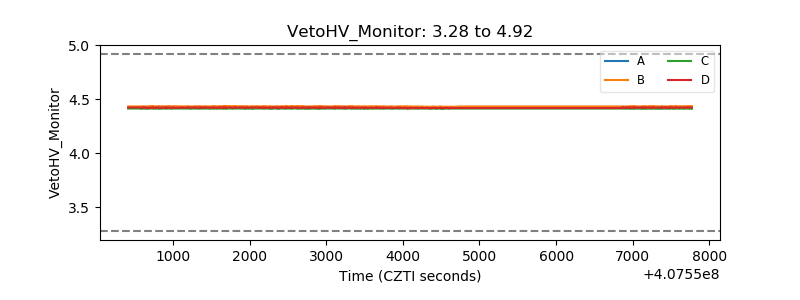 |
| Veto LLD | 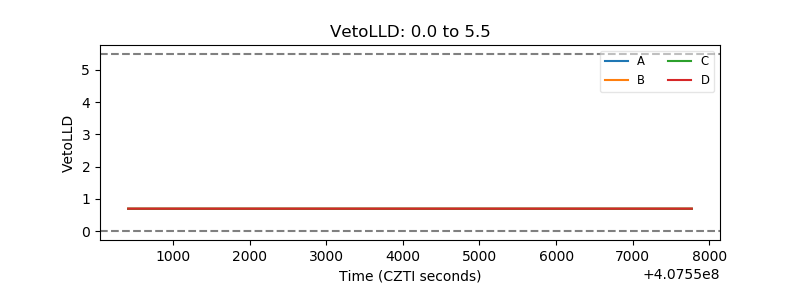 |
| Alpha Counter | 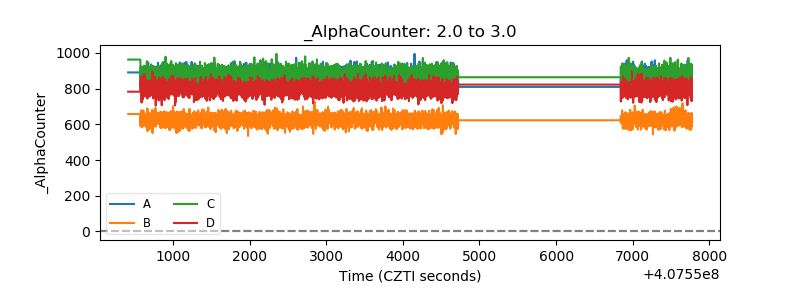 |
| _CPM_Rate | 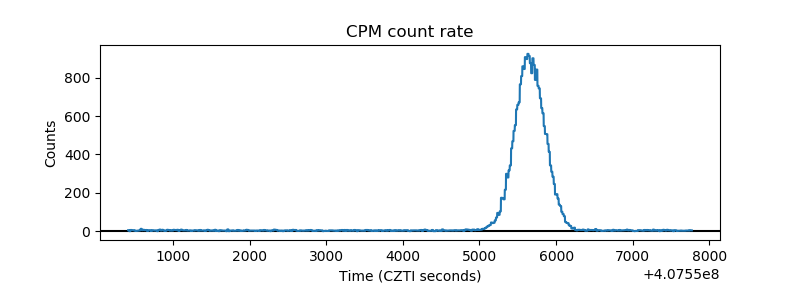 |
| CZT Counter | 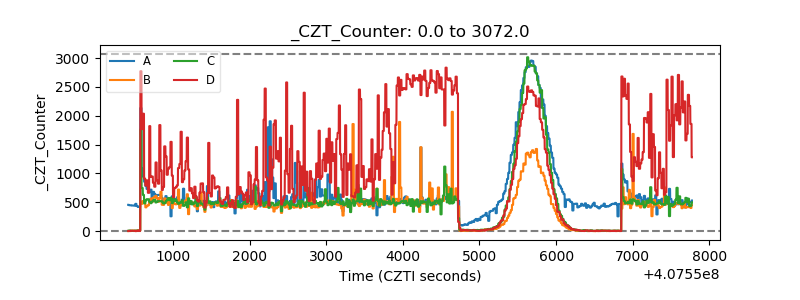 |
| +2.5 Volts monitor | 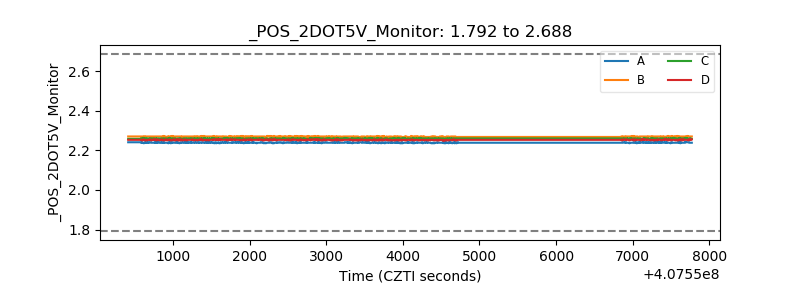 |
| +5 Volts monitor | 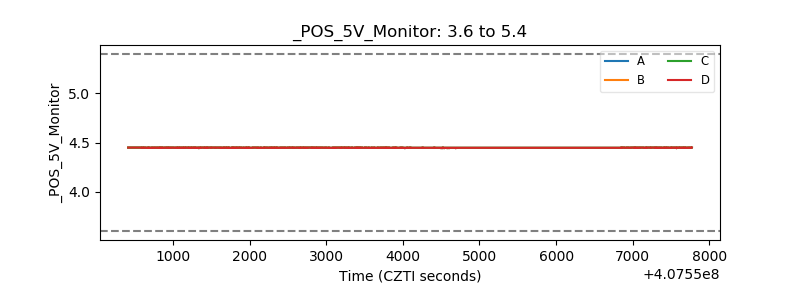 |
| _ROLL_ROT | 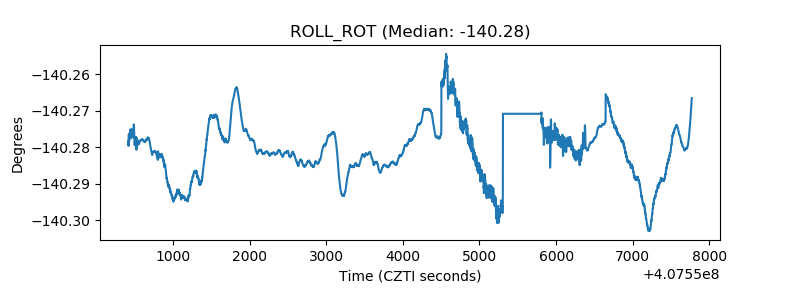 |
| _Roll_DEC | 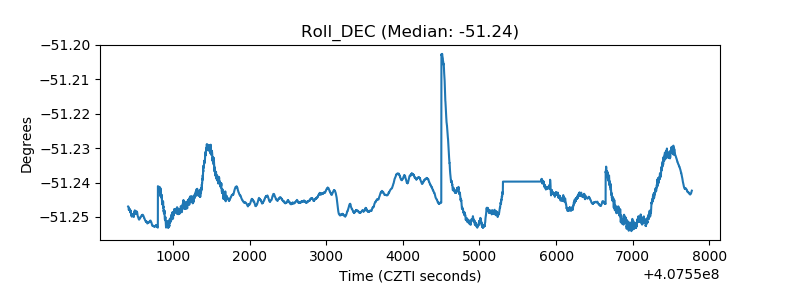 |
| _Roll_RA | 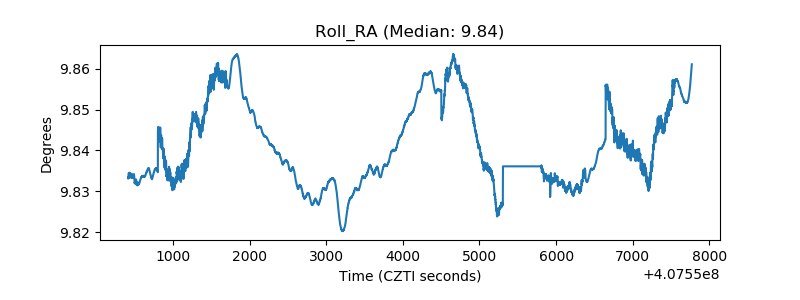 |
| Veto Counter | 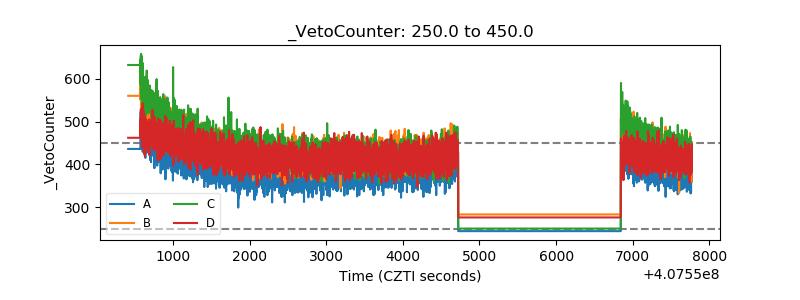 |