| Param | Original file | Final file |
|---|---|---|
| Filename | modeM0/AS1A12_044T04_9000005396_38797cztM0_level2.fits | modeM0/AS1A12_044T04_9000005396_38797cztM0_level2_quad_clean.evt |
| Size (bytes) | 437,376,960 | 81,368,640 |
| Size | 417.1 MB | 77.6 MB |
| Events in quadrant A | 2,625,038 | 579,525 |
| Events in quadrant B | 2,559,818 | 597,010 |
| Events in quadrant C | 2,453,341 | 568,682 |
| Events in quadrant D | 8,165,841 | 370,608 |
| Mode M0 | |||
|---|---|---|---|
| Quadrant | BADHDUFLAG | Total packets | Discarded packets |
| A | 0 | 10667 | 2 |
| B | 0 | 10813 | 1 |
| C | 0 | 10139 | 1 |
| D | 0 | 27698 | 1 |
| Mode SS | |||
|---|---|---|---|
| Quadrant | BADHDUFLAG | Total packets | Discarded packets |
| A | 0 | 100 | 0 |
| B | 0 | 100 | 0 |
| C | 0 | 100 | 0 |
| D | 0 | 100 | 0 |
| Mode M9 | |||
|---|---|---|---|
| Quadrant | BADHDUFLAG | Total packets | Discarded packets |
| A | 0 | 31 | 0 |
| B | 0 | 31 | 0 |
| C | 0 | 31 | 0 |
| D | 0 | 32 | 0 |
| Quadrant | Total seconds | Saturated seconds | Saturation percentage |
|---|---|---|---|
| A | 4965 | 9 | 0.181269% |
| B | 4965 | 60 | 1.208459% |
| C | 4965 | 10 | 0.201410% |
| D | 4965 | 1752 | 35.287009% |
Noise dominated data is calculated using 1-second bins in cleaned event files. If a bin has >2000 counts, and if more than 50% of those come from <1% of pixels, then it is considered to be noise-dominated and hence unusable.
| Quadrant | # 1 sec bins | Bins with >0 counts | Bins with >2000 counts | High rate bins dominated by noise | Noise dominated (total time) | Noise dominated (detector-on time) | Marked lightcurve |
|---|---|---|---|---|---|---|---|
| A | 7028 | 4966 | 5 | 5 | 0.07% | 0.10% | 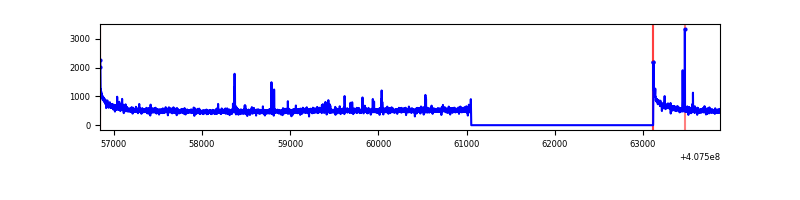 |
| B | 7028 | 4966 | 43 | 43 | 0.61% | 0.87% | 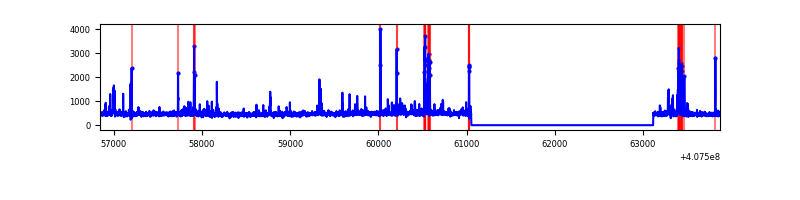 |
| C | 7028 | 4966 | 6 | 6 | 0.09% | 0.12% | 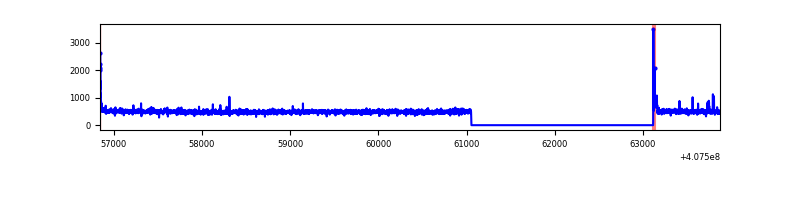 |
| D | 7028 | 4966 | 1659 | 1659 | 23.61% | 33.41% | 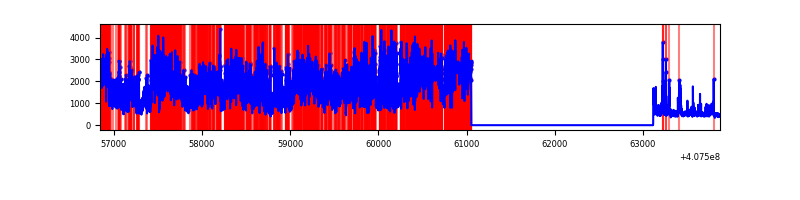 |
Top three noisy pixels from each quadrant. If the there are fewer than three noisy pixels in the level2.evt file, extra rows are filled as -1
| Pixel properties | Quadrant properties | ||||||
|---|---|---|---|---|---|---|---|
| Quadrant | DetID | PixID | Counts | Sigma | Mean | Median | Sigma |
| A | 10 | 83 | 392034 | 3454.67 | 562 | 552 | 113.3 |
| A | 13 | 248 | 25988 | 224.46 | 562 | 552 | 113.3 |
| A | 7 | 16 | 10810 | 90.52 | 562 | 552 | 113.3 |
| B | 4 | 171 | 214097 | 1976.78 | 561 | 546 | 108.0 |
| B | 0 | 186 | 66303 | 608.69 | 561 | 546 | 108.0 |
| B | 0 | 230 | 21745 | 196.23 | 561 | 546 | 108.0 |
| C | 15 | 214 | 220671 | 1706.03 | 554 | 558 | 129.0 |
| C | 0 | 10 | 39292 | 300.22 | 554 | 558 | 129.0 |
| C | 15 | 208 | 10078 | 73.79 | 554 | 558 | 129.0 |
| D | 12 | 235 | 4119167 | 35498.15 | 479 | 466 | 116.0 |
| D | 13 | 249 | 790638 | 6810.31 | 479 | 466 | 116.0 |
| D | 5 | 222 | 458632 | 3948.83 | 479 | 466 | 116.0 |
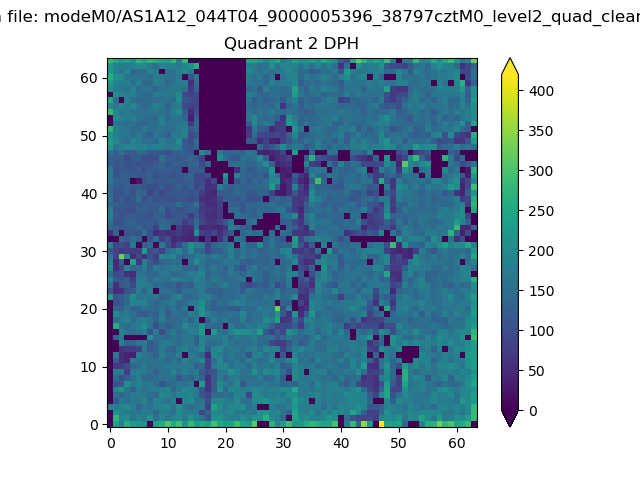
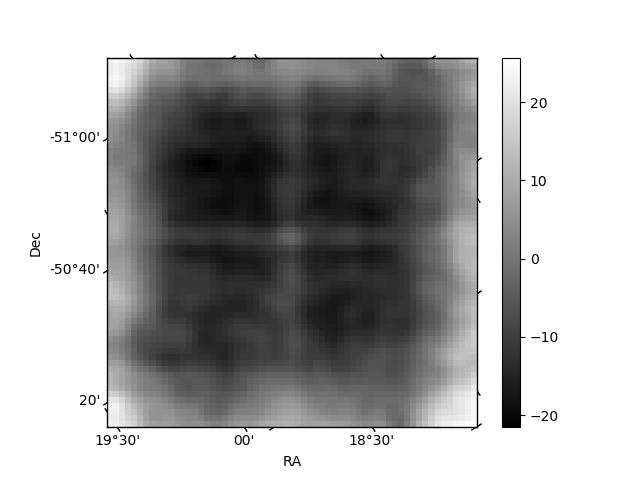
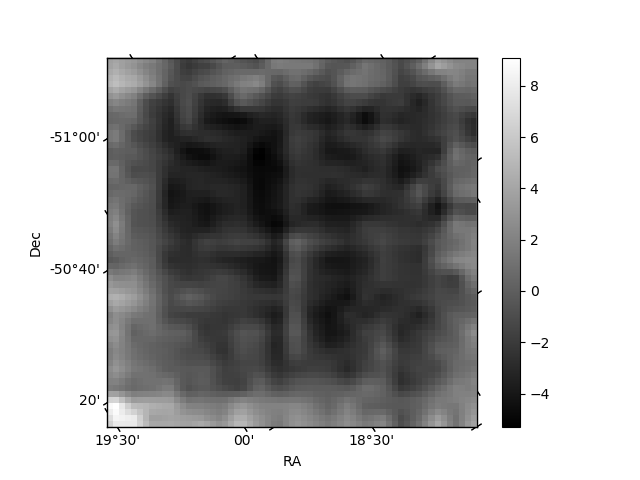
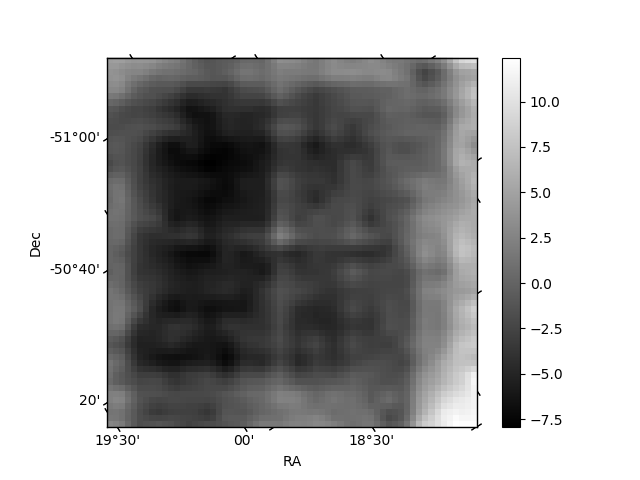
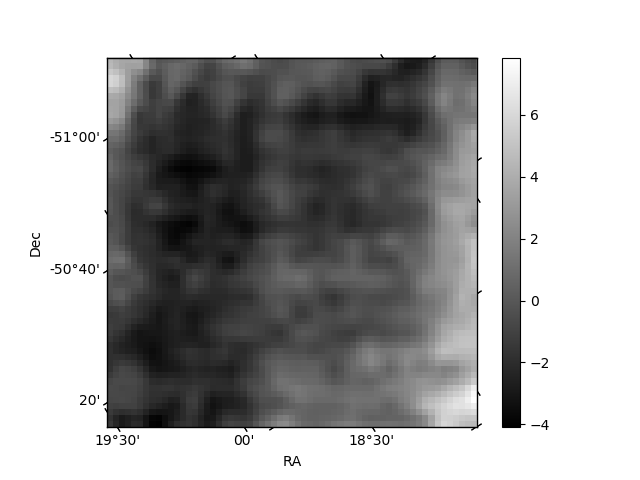
Histogram calculated using DETX and DETY for each event in the final _common_clean file
| Quadrant A | 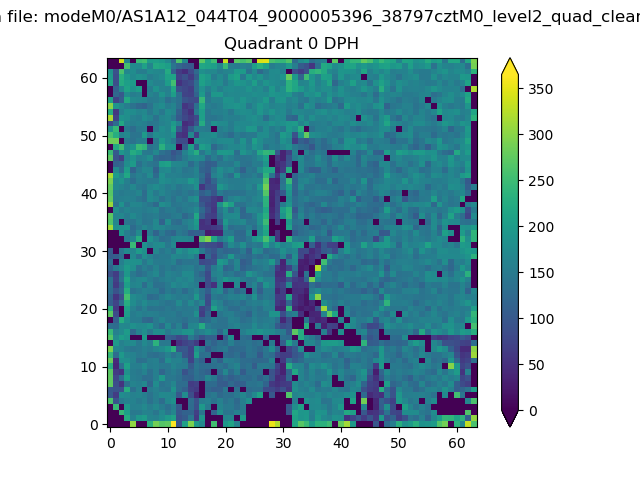 |
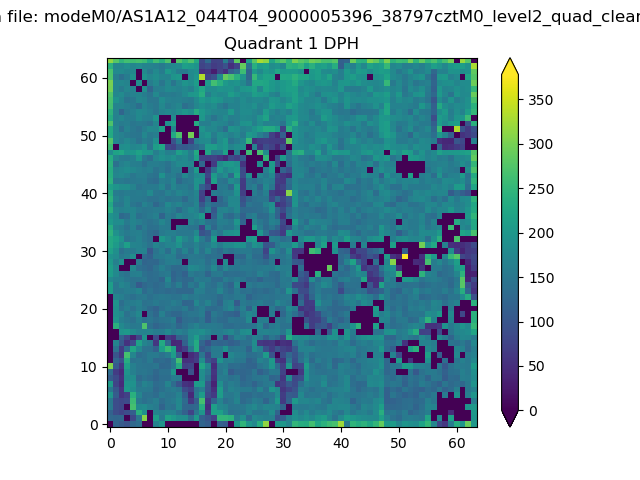 |
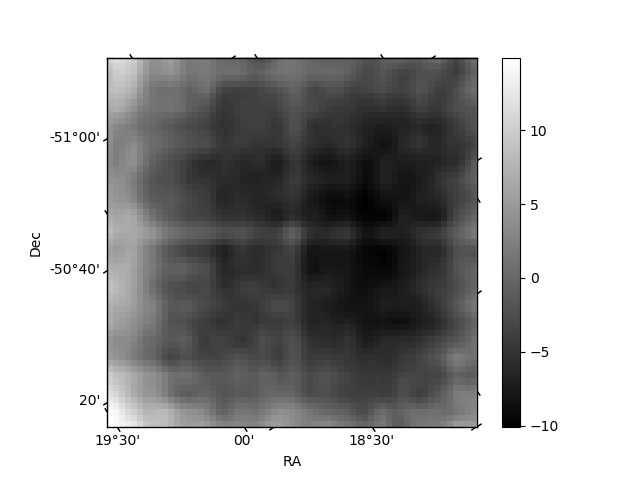
Quadrant B |
|---|---|---|---|
| Quadrant D | 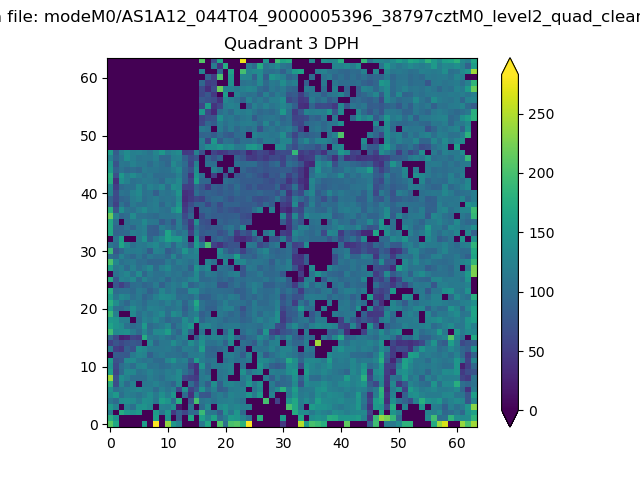 |
 |
Quadrant C |
| Plot type | Count rate plots | Images |
|---|---|---|
| Comparison with Poisson distribution Blue bars denote a histogram of data divided into 1 sec bins. Red curve is a Poisson curve with rate = median count rate of data. |
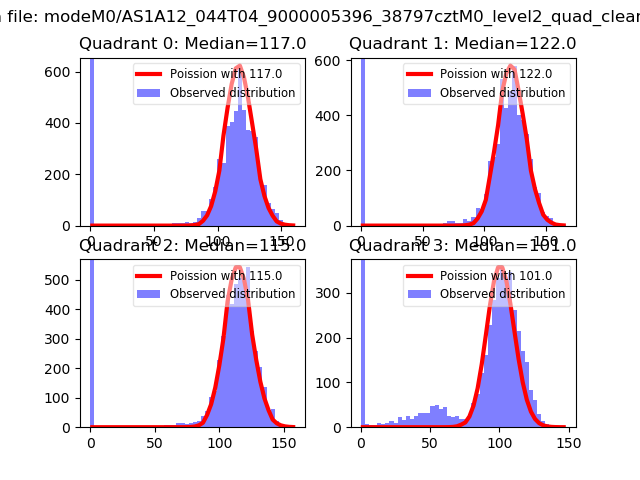 |
 |
| Quadrant-wise count rates Data is divided into 100 sec bins |
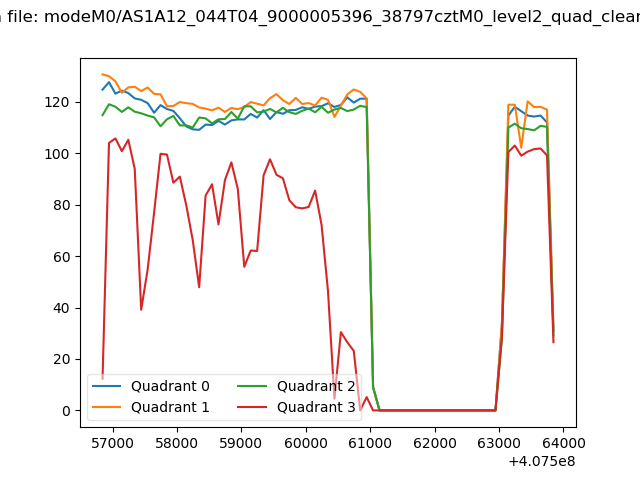 |
|
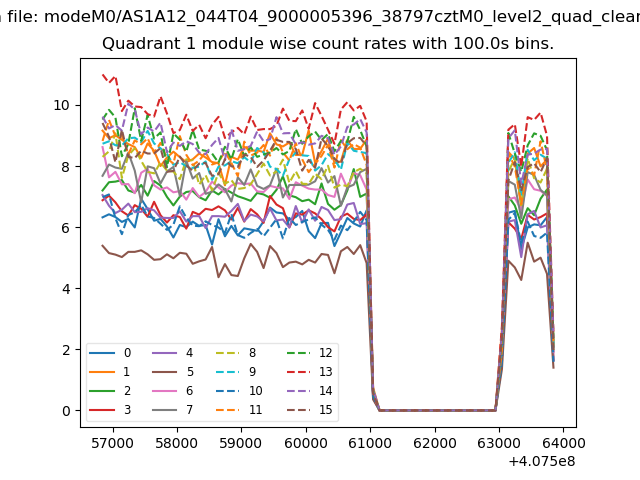
| Module-wise count rates for Quadrant A Data is divided into 100 sec bins |
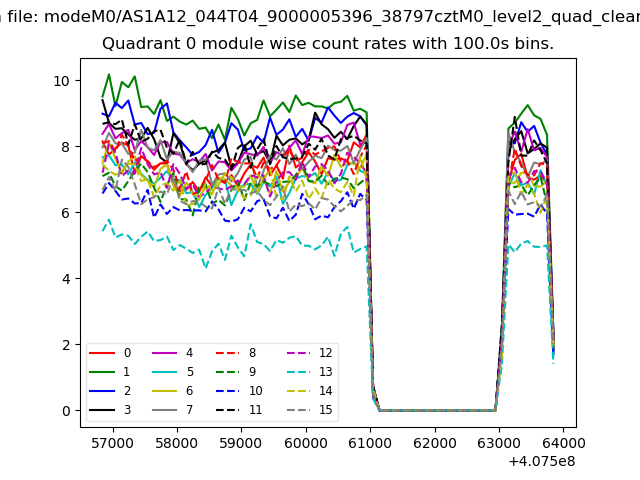 |
 |
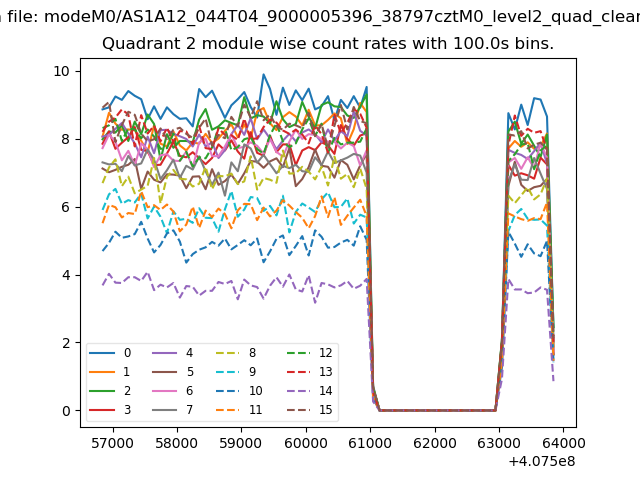
| Module-wise count rates for Quadrant B Data is divided into 100 sec bins |
 |
 |
| Module-wise count rates for Quadrant C Data is divided into 100 sec bins |
 |
 |
| Module-wise count rates for Quadrant D Data is divided into 100 sec bins |
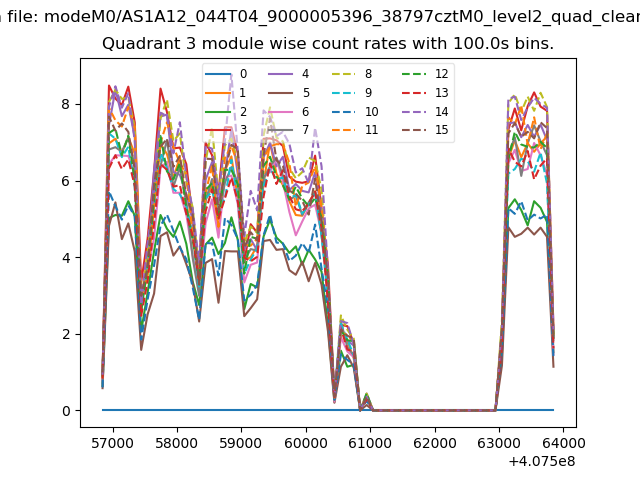 |
 |
| Parameter | Plot |
|---|---|
| CZT HV Monitor | 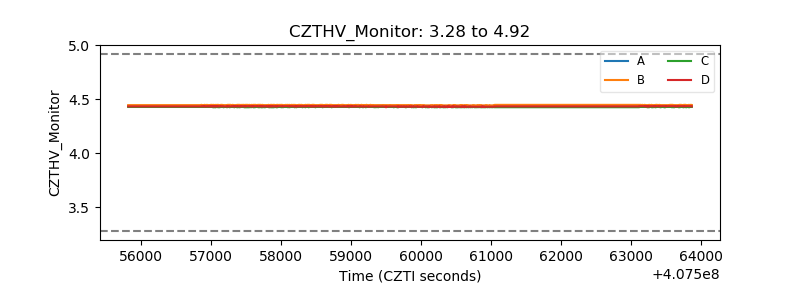 |
| D_VDD | 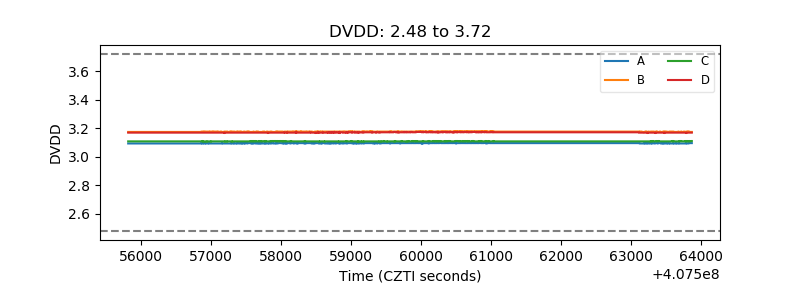 |
| Temperature 1 | 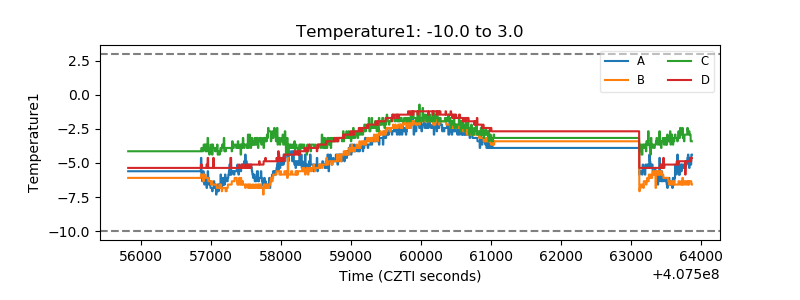 |
| Veto HV Monitor | 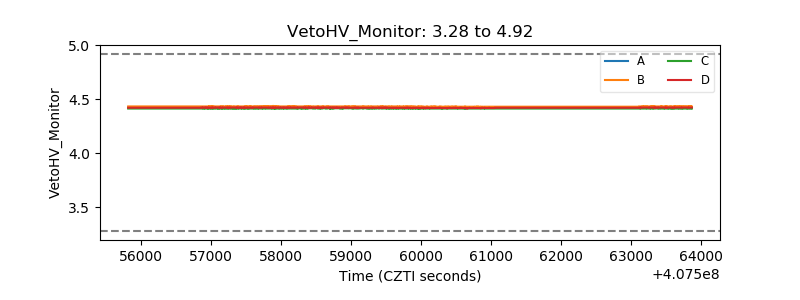 |
| Veto LLD | 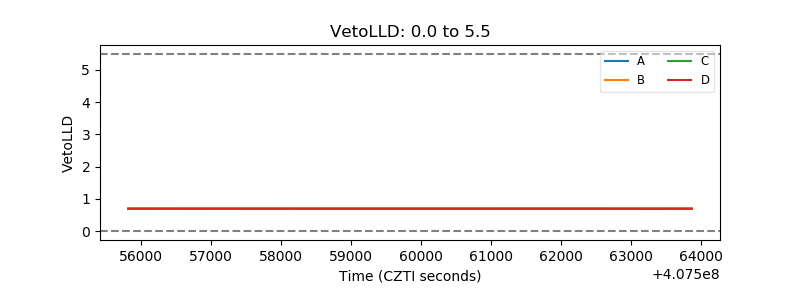 |
| Alpha Counter | 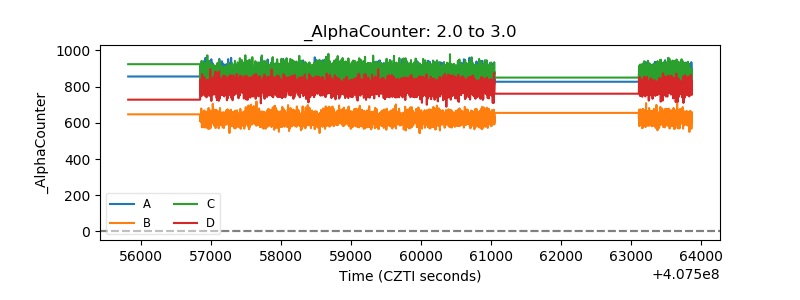 |
| _CPM_Rate |  |
| CZT Counter | 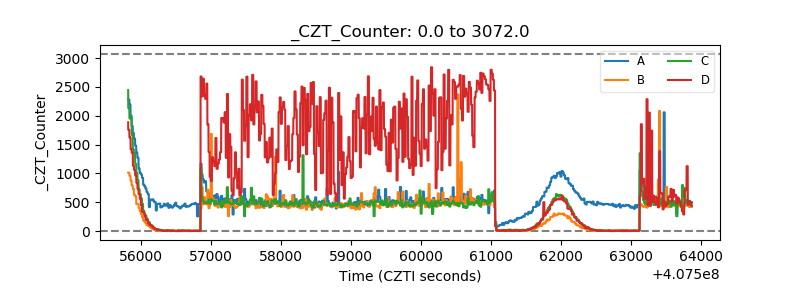 |
| +2.5 Volts monitor | 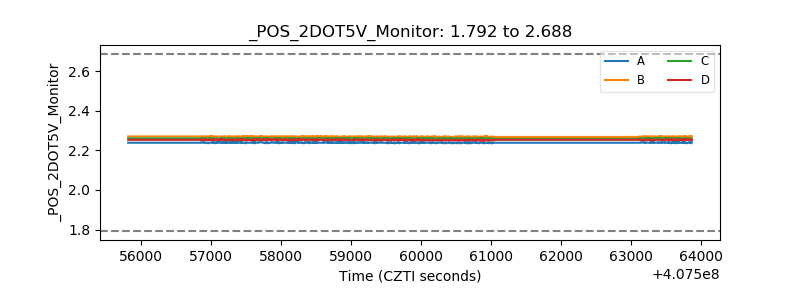 |
| +5 Volts monitor | 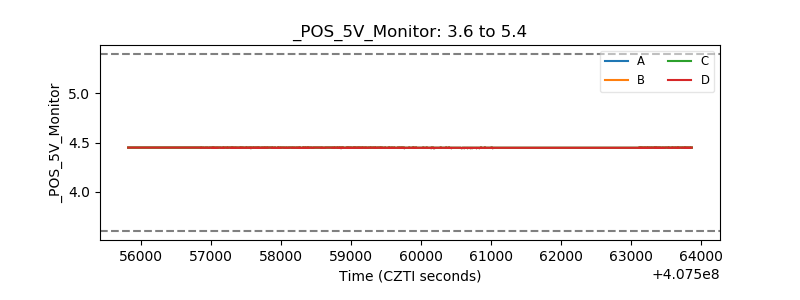 |
| _ROLL_ROT | 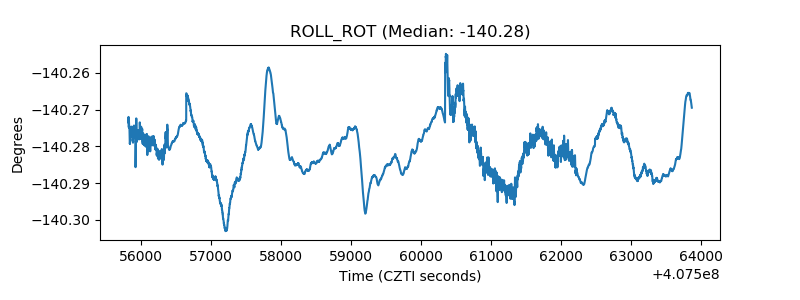 |
| _Roll_DEC | 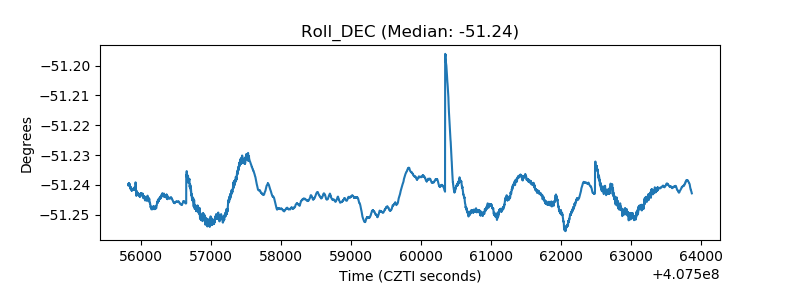 |
| _Roll_RA | 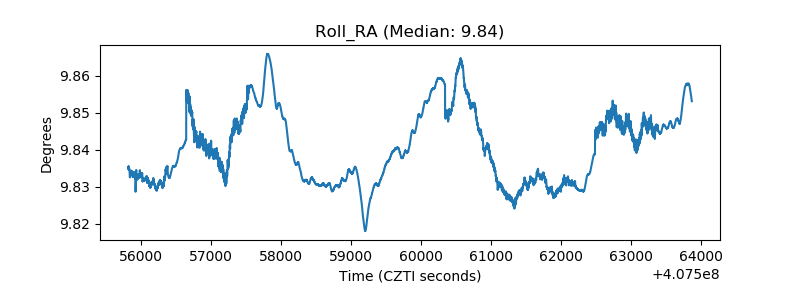 |
| Veto Counter | 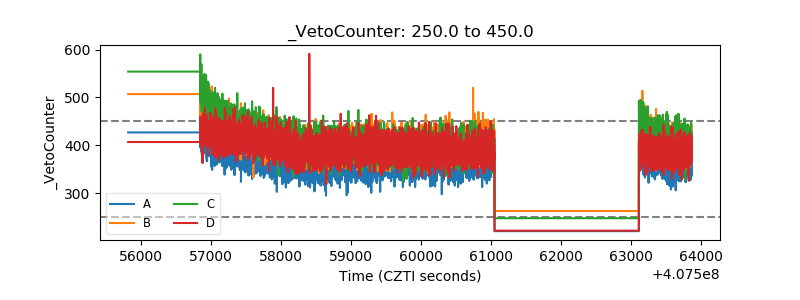 |