| Param | Original file | Final file |
|---|---|---|
| Filename | modeM0/AS1A12_044T04_9000005396_38798cztM0_level2.fits | modeM0/AS1A12_044T04_9000005396_38798cztM0_level2_quad_clean.evt |
| Size (bytes) | 345,150,720 | 86,855,040 |
| Size | 329.2 MB | 82.8 MB |
| Events in quadrant A | 2,692,303 | 584,807 |
| Events in quadrant B | 2,659,766 | 600,792 |
| Events in quadrant C | 2,520,613 | 577,792 |
| Events in quadrant D | 4,495,642 | 499,839 |
| Mode M0 | |||
|---|---|---|---|
| Quadrant | BADHDUFLAG | Total packets | Discarded packets |
| A | 0 | 11127 | 2 |
| B | 0 | 11381 | 1 |
| C | 0 | 10688 | 1 |
| D | 0 | 16810 | 1 |
| Mode SS | |||
|---|---|---|---|
| Quadrant | BADHDUFLAG | Total packets | Discarded packets |
| A | 0 | 108 | 0 |
| B | 0 | 108 | 0 |
| C | 0 | 108 | 0 |
| D | 0 | 108 | 0 |
| Mode M9 | |||
|---|---|---|---|
| Quadrant | BADHDUFLAG | Total packets | Discarded packets |
| A | 0 | 39 | 0 |
| B | 0 | 39 | 0 |
| C | 0 | 39 | 0 |
| D | 0 | 39 | 0 |
| Quadrant | Total seconds | Saturated seconds | Saturation percentage |
|---|---|---|---|
| A | 5240 | 14 | 0.267176% |
| B | 5240 | 76 | 1.450382% |
| C | 5240 | 10 | 0.190840% |
| D | 5240 | 357 | 6.812977% |
Noise dominated data is calculated using 1-second bins in cleaned event files. If a bin has >2000 counts, and if more than 50% of those come from <1% of pixels, then it is considered to be noise-dominated and hence unusable.
| Quadrant | # 1 sec bins | Bins with >0 counts | Bins with >2000 counts | High rate bins dominated by noise | Noise dominated (total time) | Noise dominated (detector-on time) | Marked lightcurve |
|---|---|---|---|---|---|---|---|
| A | 9126 | 5242 | 5 | 5 | 0.05% | 0.10% | 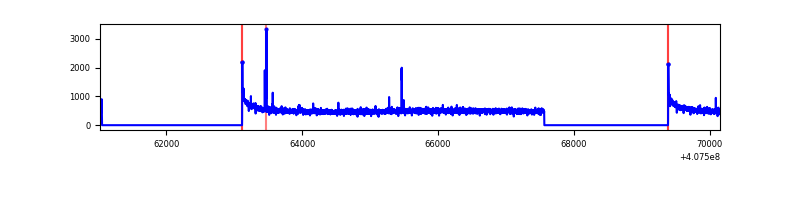 |
| B | 9126 | 5242 | 61 | 61 | 0.67% | 1.16% | 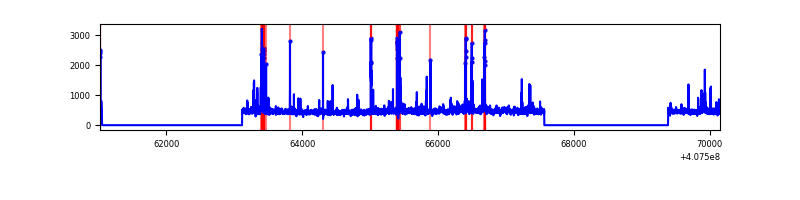 |
| C | 9126 | 5242 | 3 | 3 | 0.03% | 0.06% | 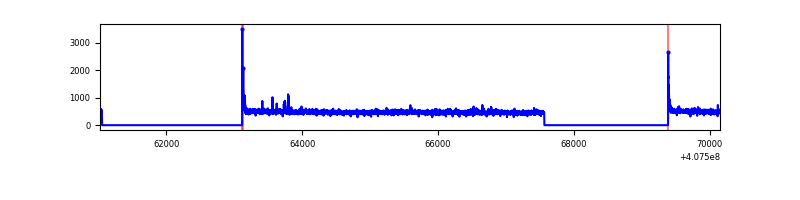 |
| D | 9126 | 5242 | 363 | 363 | 3.98% | 6.92% | 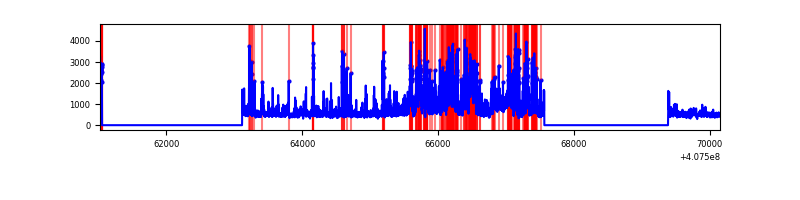 |
Top three noisy pixels from each quadrant. If the there are fewer than three noisy pixels in the level2.evt file, extra rows are filled as -1
| Pixel properties | Quadrant properties | ||||||
|---|---|---|---|---|---|---|---|
| Quadrant | DetID | PixID | Counts | Sigma | Mean | Median | Sigma |
| A | 10 | 83 | 405804 | 3432.05 | 580 | 569 | 118.1 |
| A | 13 | 248 | 12835 | 103.88 | 580 | 569 | 118.1 |
| A | 7 | 16 | 10936 | 87.8 | 580 | 569 | 118.1 |
| B | 4 | 171 | 179461 | 1603.02 | 576 | 561 | 111.6 |
| B | 5 | 200 | 99926 | 890.36 | 576 | 561 | 111.6 |
| B | 0 | 230 | 41794 | 369.47 | 576 | 561 | 111.6 |
| C | 15 | 214 | 234581 | 1773.99 | 568 | 571 | 131.9 |
| C | 0 | 10 | 46237 | 346.19 | 568 | 571 | 131.9 |
| C | 15 | 208 | 9984 | 71.36 | 568 | 571 | 131.9 |
| D | 13 | 249 | 567264 | 4172.79 | 553 | 537 | 135.8 |
| D | 12 | 235 | 438041 | 3221.33 | 553 | 537 | 135.8 |
| D | 12 | 233 | 366011 | 2690.97 | 553 | 537 | 135.8 |
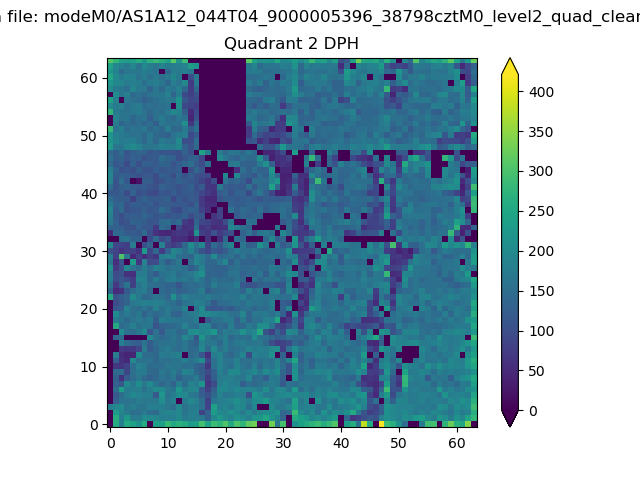
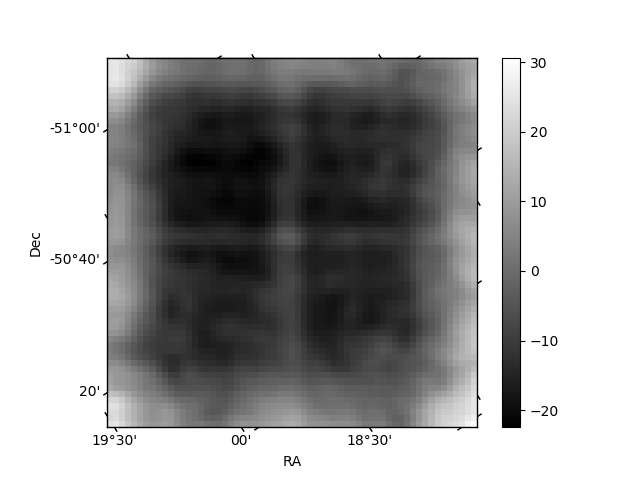
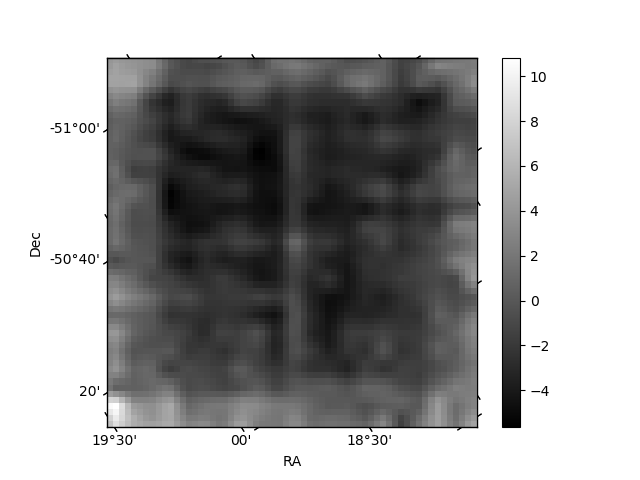
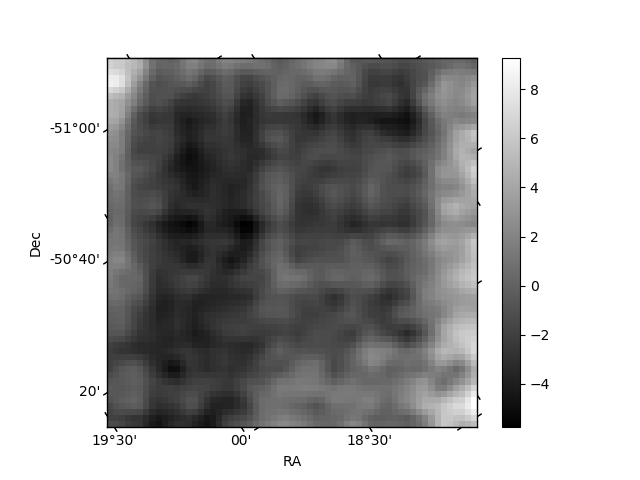
Histogram calculated using DETX and DETY for each event in the final _common_clean file
| Quadrant A | 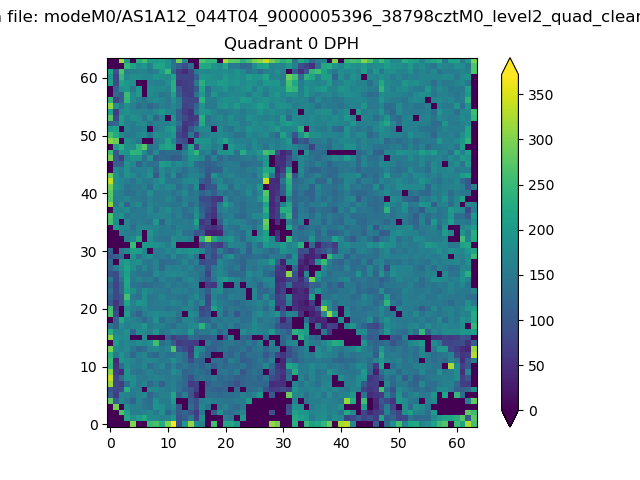 |
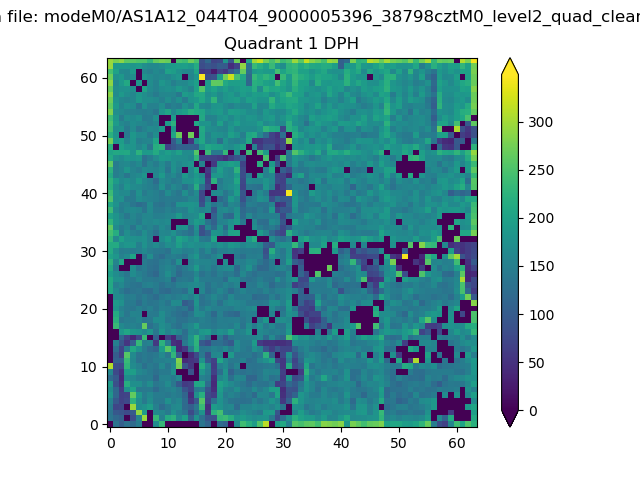 |
Quadrant B |
|---|---|---|---|
| Quadrant D | 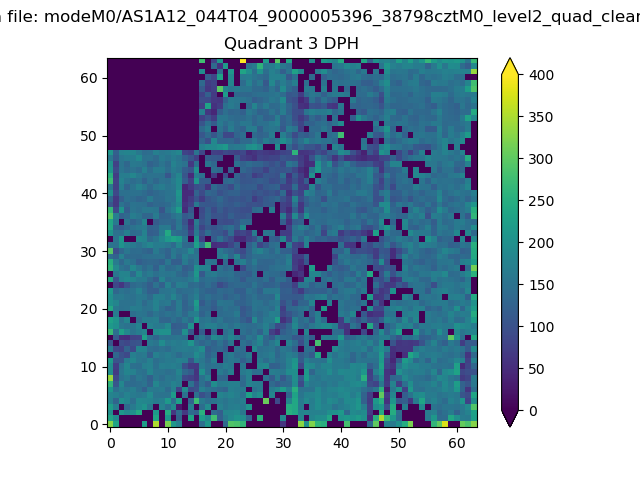 |
 |
Quadrant C |
| Plot type | Count rate plots | Images |
|---|---|---|
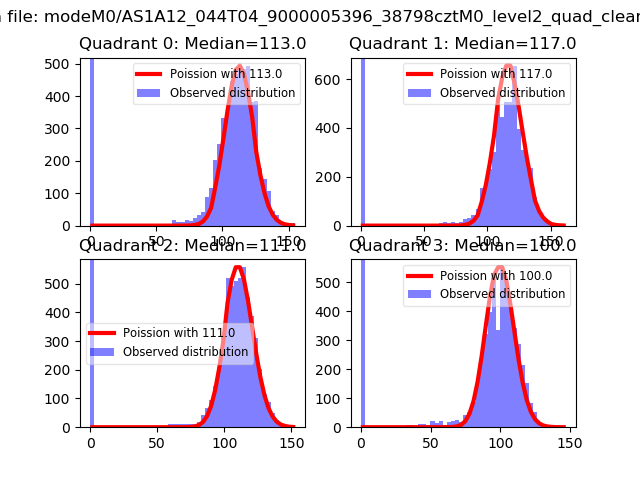
| Comparison with Poisson distribution Blue bars denote a histogram of data divided into 1 sec bins. Red curve is a Poisson curve with rate = median count rate of data. |
 |
 |
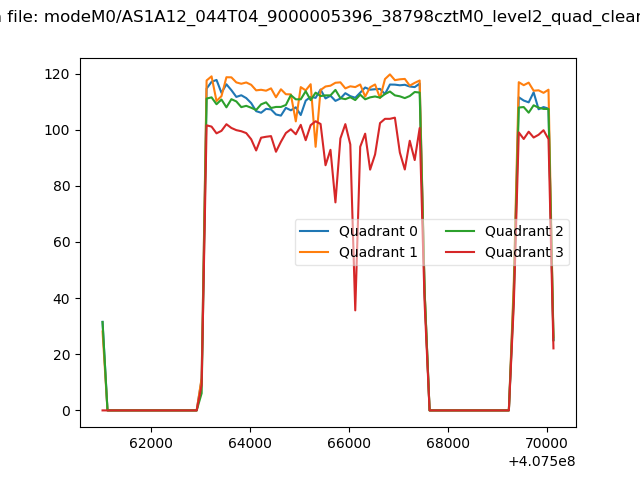
| Quadrant-wise count rates Data is divided into 100 sec bins |
 |
|
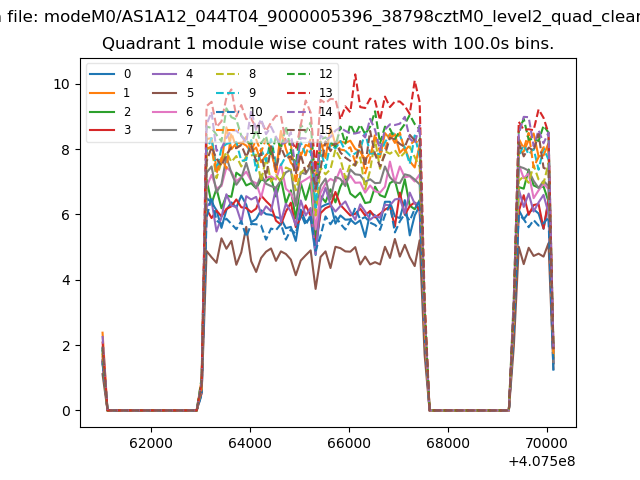
| Module-wise count rates for Quadrant A Data is divided into 100 sec bins |
 |
 |
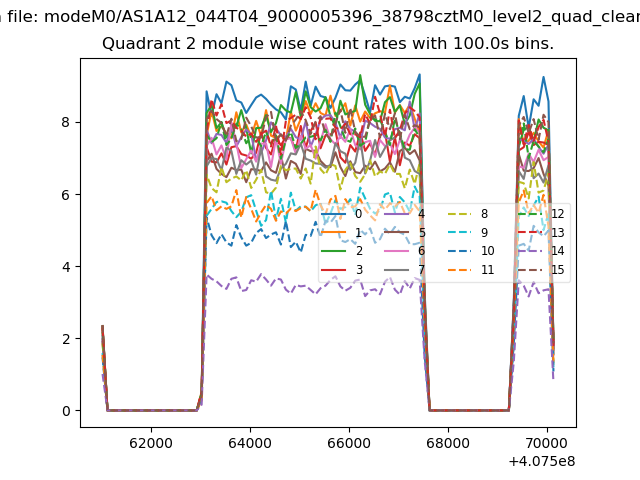
| Module-wise count rates for Quadrant B Data is divided into 100 sec bins |
 |
 |
| Module-wise count rates for Quadrant C Data is divided into 100 sec bins |
 |
 |
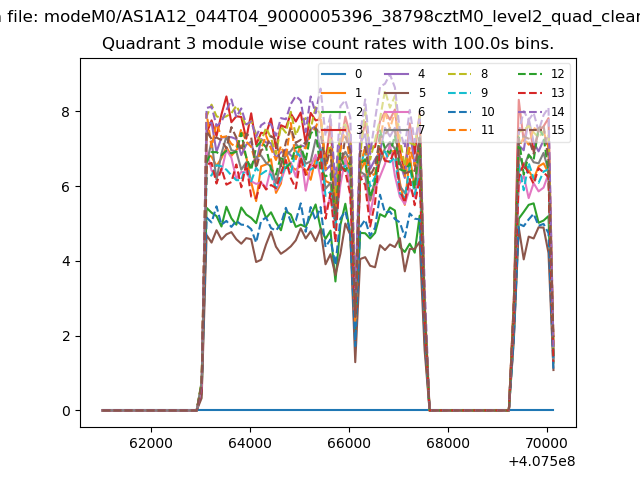
| Module-wise count rates for Quadrant D Data is divided into 100 sec bins |
 |
 |
| Parameter | Plot |
|---|---|
| CZT HV Monitor | 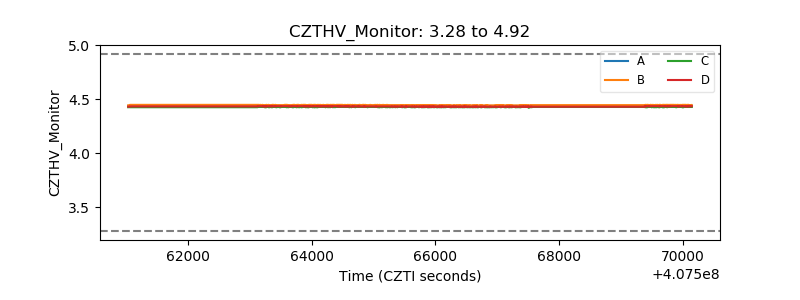 |
| D_VDD | 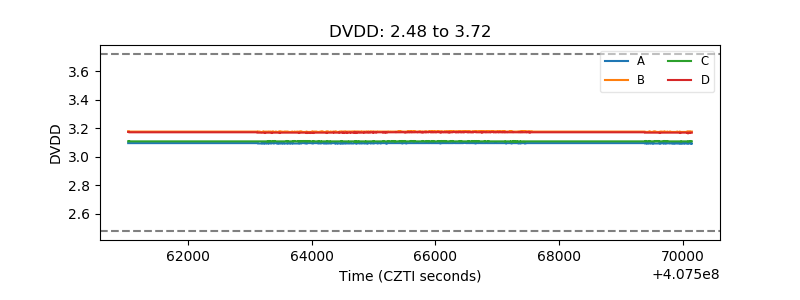 |
| Temperature 1 | 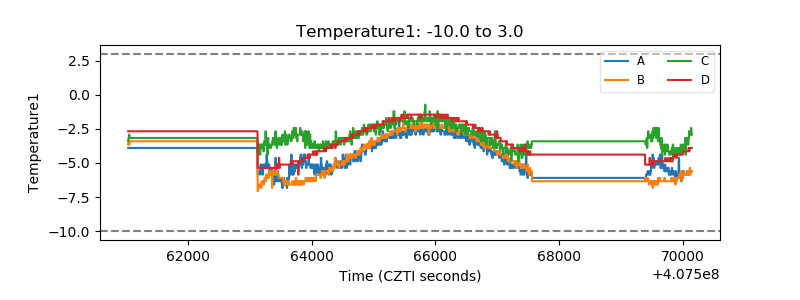 |
| Veto HV Monitor | 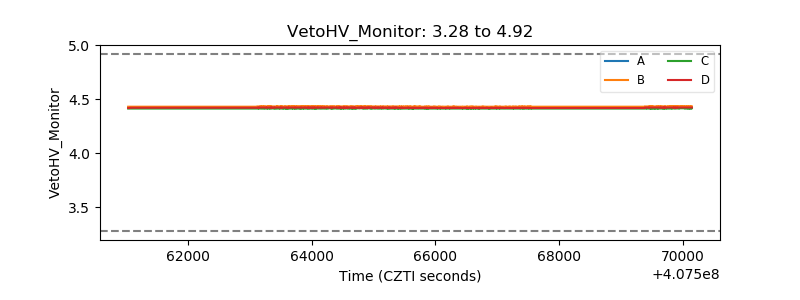 |
| Veto LLD | 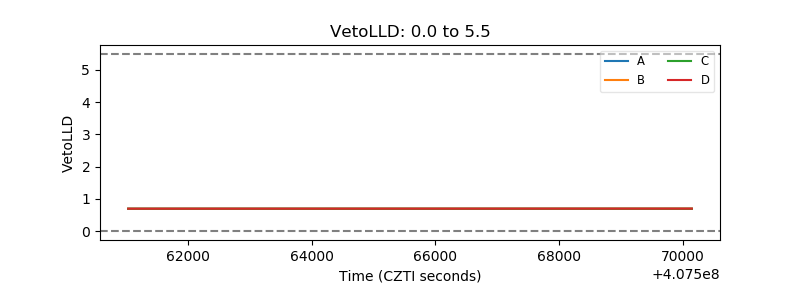 |
| Alpha Counter | 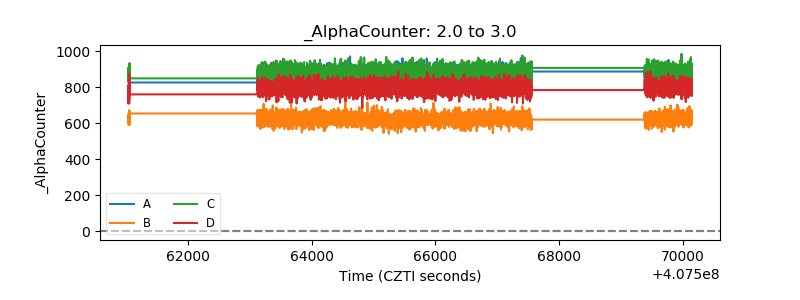 |
| _CPM_Rate | 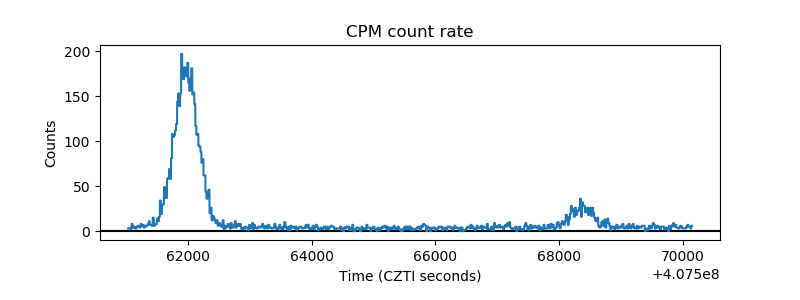 |
| CZT Counter | 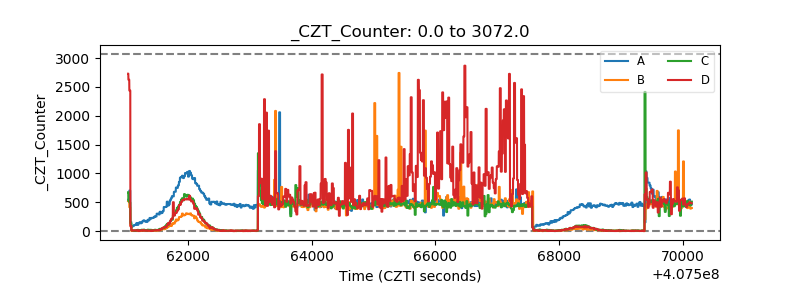 |
| +2.5 Volts monitor | 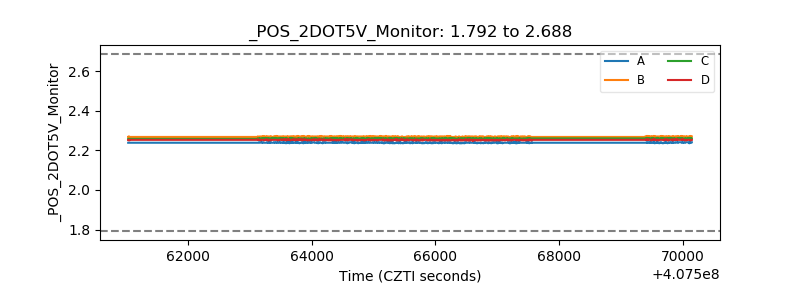 |
| +5 Volts monitor |  |
| _ROLL_ROT | 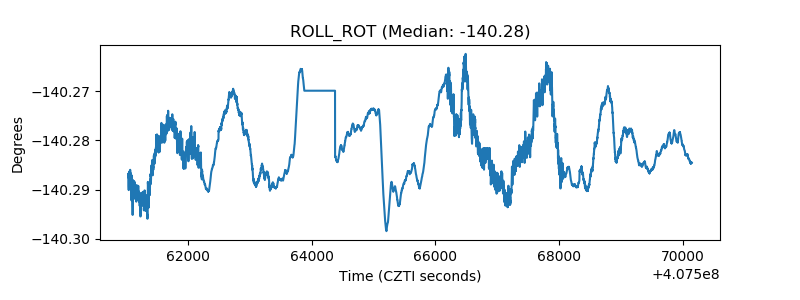 |
| _Roll_DEC | 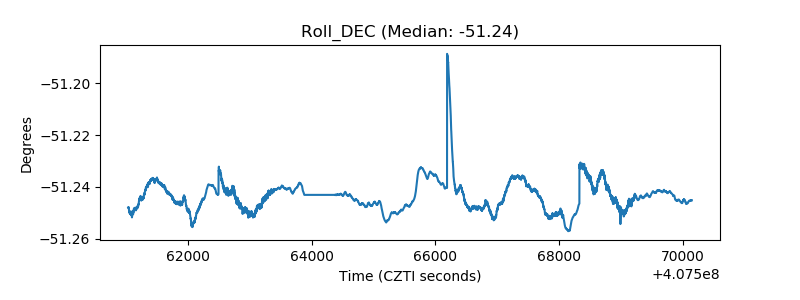 |
| _Roll_RA | 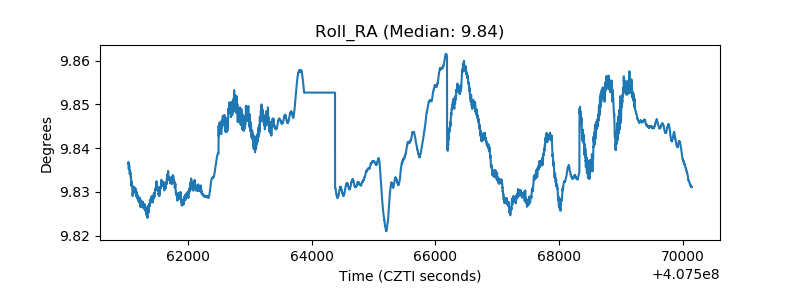 |
| Veto Counter | 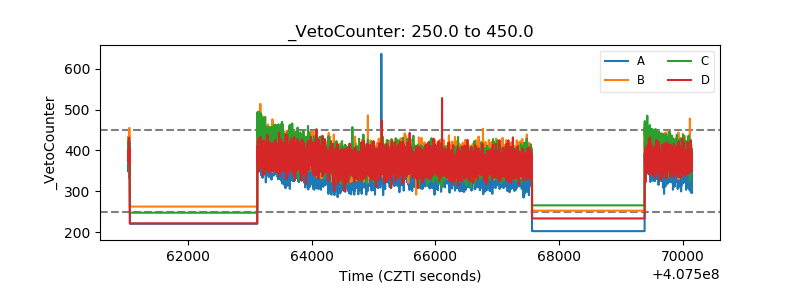 |