| Param | Original file | Final file |
|---|---|---|
| Filename | modeM0/AS1A12_044T04_9000005396_38799cztM0_level2.fits | modeM0/AS1A12_044T04_9000005396_38799cztM0_level2_quad_clean.evt |
| Size (bytes) | 326,226,240 | 81,167,040 |
| Size | 311.1 MB | 77.4 MB |
| Events in quadrant A | 2,522,723 | 547,430 |
| Events in quadrant B | 2,557,756 | 553,564 |
| Events in quadrant C | 2,330,388 | 538,679 |
| Events in quadrant D | 4,279,576 | 470,896 |
| Mode M0 | |||
|---|---|---|---|
| Quadrant | BADHDUFLAG | Total packets | Discarded packets |
| A | 0 | 10519 | 1 |
| B | 0 | 10965 | 1 |
| C | 0 | 10081 | 1 |
| D | 0 | 16054 | 1 |
| Mode SS | |||
|---|---|---|---|
| Quadrant | BADHDUFLAG | Total packets | Discarded packets |
| A | 0 | 102 | 0 |
| B | 0 | 102 | 0 |
| C | 0 | 102 | 0 |
| D | 0 | 102 | 0 |
| Mode M9 | |||
|---|---|---|---|
| Quadrant | BADHDUFLAG | Total packets | Discarded packets |
| A | 0 | 18 | 0 |
| B | 0 | 18 | 0 |
| C | 0 | 18 | 0 |
| D | 0 | 18 | 0 |
| Quadrant | Total seconds | Saturated seconds | Saturation percentage |
|---|---|---|---|
| A | 4945 | 13 | 0.262892% |
| B | 4945 | 93 | 1.880688% |
| C | 4945 | 9 | 0.182002% |
| D | 4945 | 324 | 6.552073% |
Noise dominated data is calculated using 1-second bins in cleaned event files. If a bin has >2000 counts, and if more than 50% of those come from <1% of pixels, then it is considered to be noise-dominated and hence unusable.
| Quadrant | # 1 sec bins | Bins with >0 counts | Bins with >2000 counts | High rate bins dominated by noise | Noise dominated (total time) | Noise dominated (detector-on time) | Marked lightcurve |
|---|---|---|---|---|---|---|---|
| A | 6768 | 4946 | 7 | 7 | 0.10% | 0.14% | 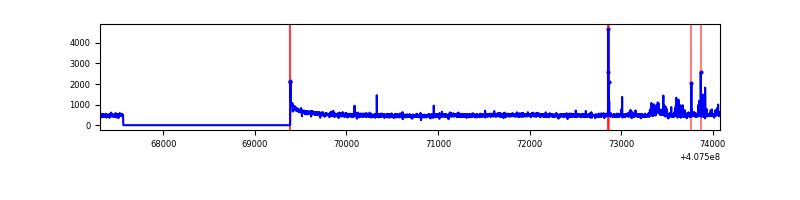 |
| B | 6768 | 4946 | 61 | 61 | 0.90% | 1.23% | 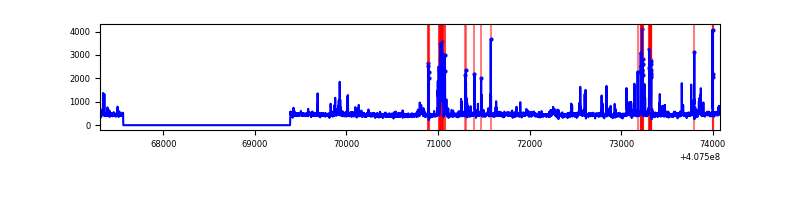 |
| C | 6768 | 4946 | 4 | 4 | 0.06% | 0.08% | 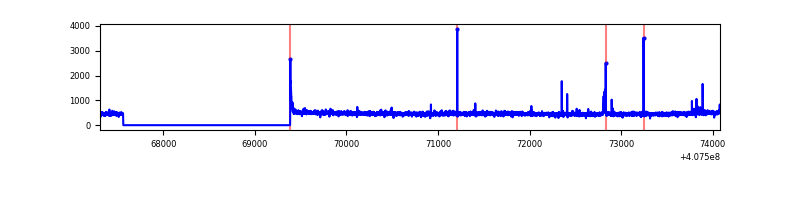 |
| D | 6768 | 4946 | 330 | 330 | 4.88% | 6.67% | 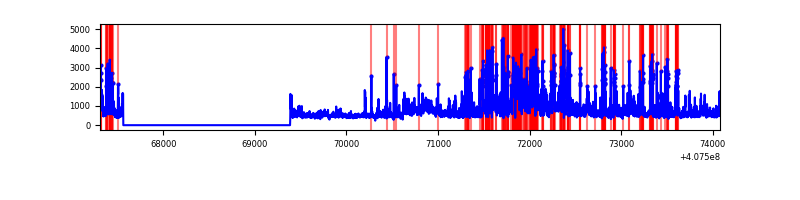 |
Top three noisy pixels from each quadrant. If the there are fewer than three noisy pixels in the level2.evt file, extra rows are filled as -1
| Pixel properties | Quadrant properties | ||||||
|---|---|---|---|---|---|---|---|
| Quadrant | DetID | PixID | Counts | Sigma | Mean | Median | Sigma |
| A | 10 | 83 | 313328 | 2840.57 | 539 | 527 | 110.1 |
| A | 13 | 248 | 63457 | 571.47 | 539 | 527 | 110.1 |
| A | 12 | 189 | 45736 | 410.55 | 539 | 527 | 110.1 |
| B | 4 | 171 | 350594 | 3371.45 | 535 | 520 | 103.8 |
| B | 5 | 200 | 37649 | 357.58 | 535 | 520 | 103.8 |
| B | 0 | 221 | 17772 | 166.15 | 535 | 520 | 103.8 |
| C | 15 | 214 | 214576 | 1754.1 | 525 | 527 | 122.0 |
| C | 0 | 10 | 22053 | 176.4 | 525 | 527 | 122.0 |
| C | 2 | 16 | 18456 | 146.93 | 525 | 527 | 122.0 |
| D | 12 | 235 | 1290204 | 10185.36 | 512 | 498 | 126.6 |
| D | 13 | 249 | 400161 | 3156.31 | 512 | 498 | 126.6 |
| D | 2 | 16 | 222123 | 1750.27 | 512 | 498 | 126.6 |
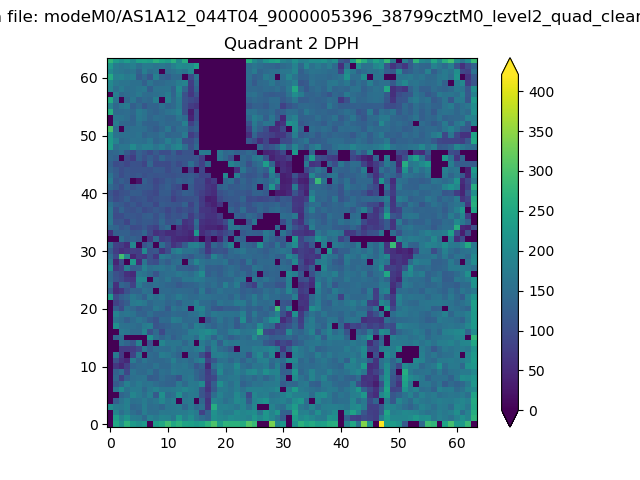
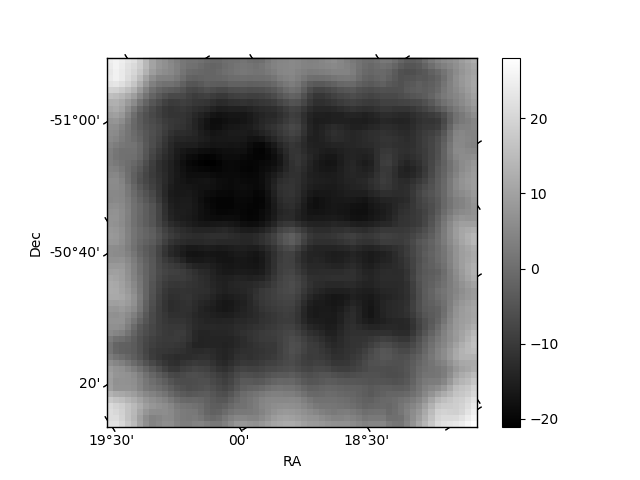
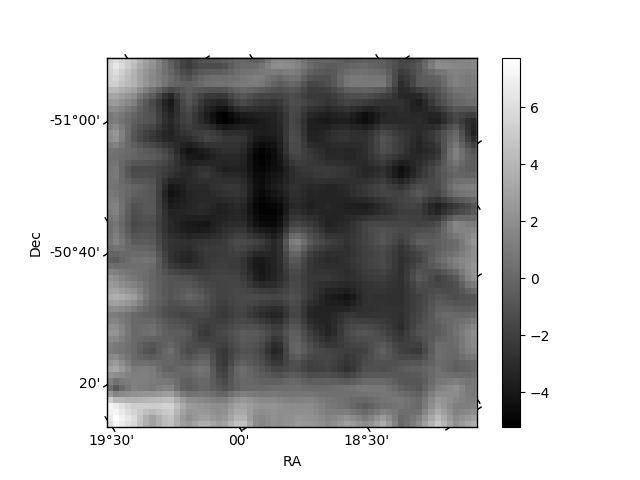
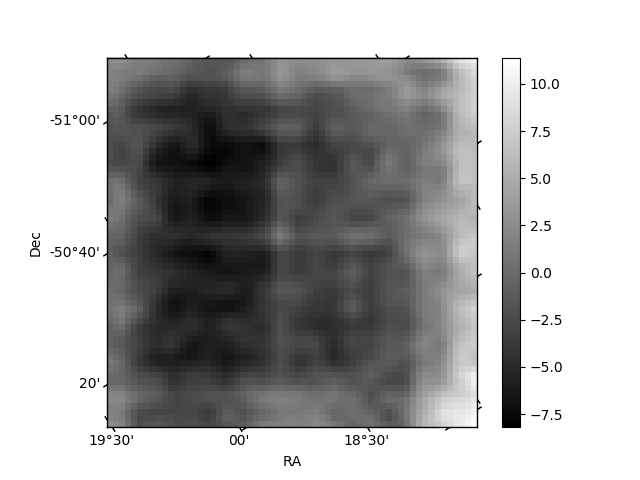
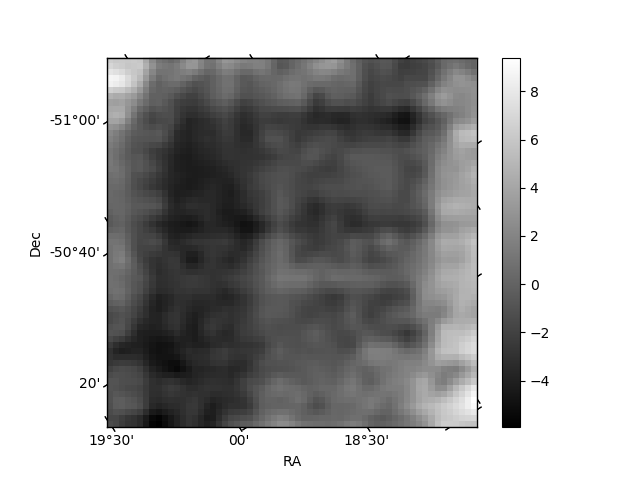
Histogram calculated using DETX and DETY for each event in the final _common_clean file
| Quadrant A | 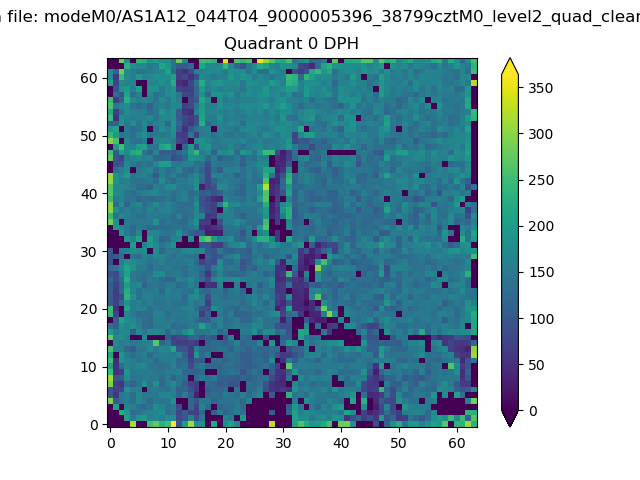 |
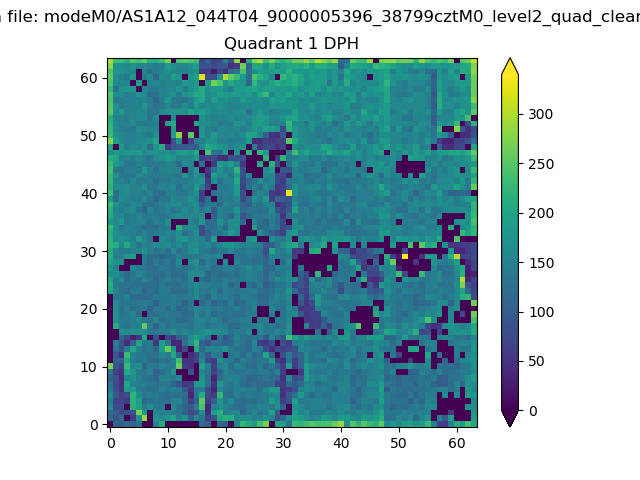 |
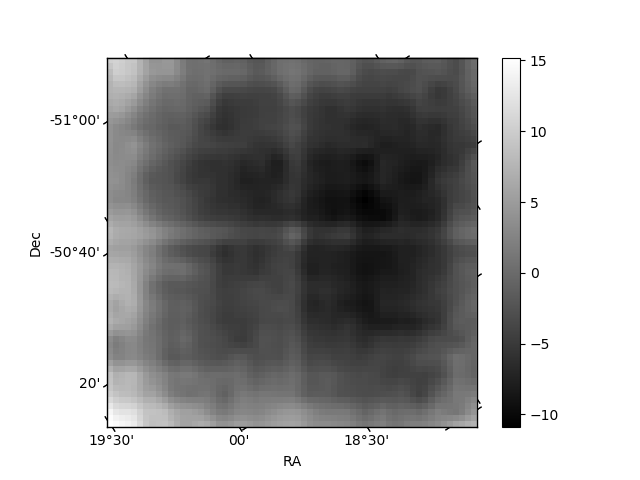
Quadrant B |
|---|---|---|---|
| Quadrant D | 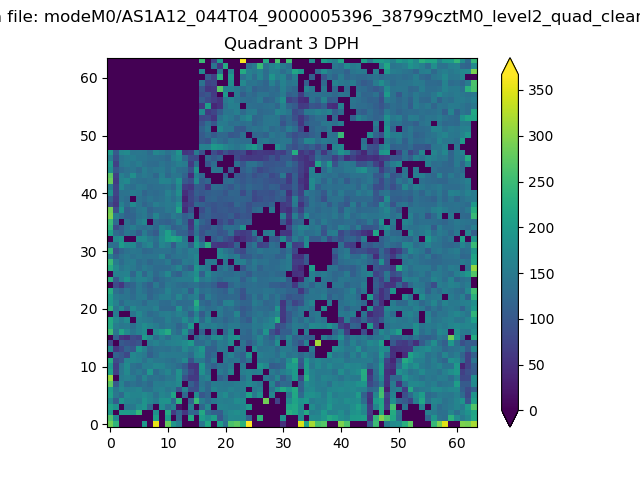 |
 |
Quadrant C |
| Plot type | Count rate plots | Images |
|---|---|---|
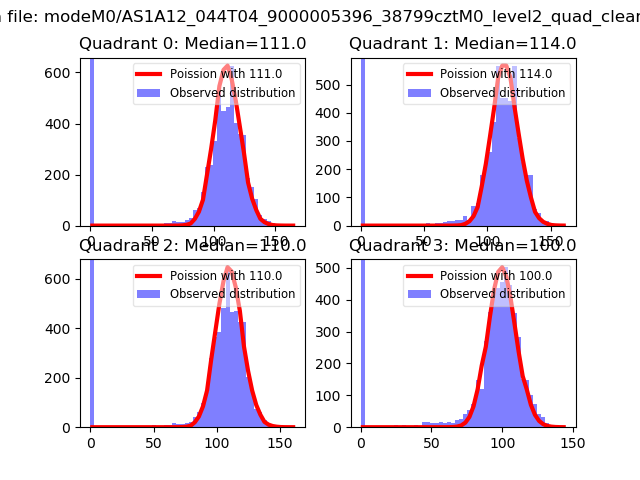
| Comparison with Poisson distribution Blue bars denote a histogram of data divided into 1 sec bins. Red curve is a Poisson curve with rate = median count rate of data. |
 |
 |
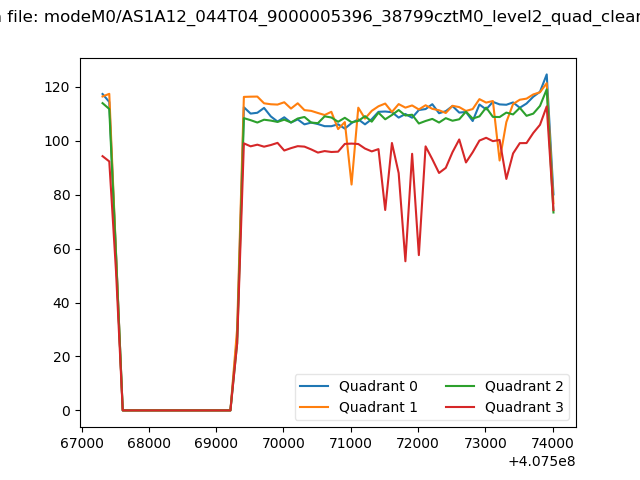
| Quadrant-wise count rates Data is divided into 100 sec bins |
 |
|
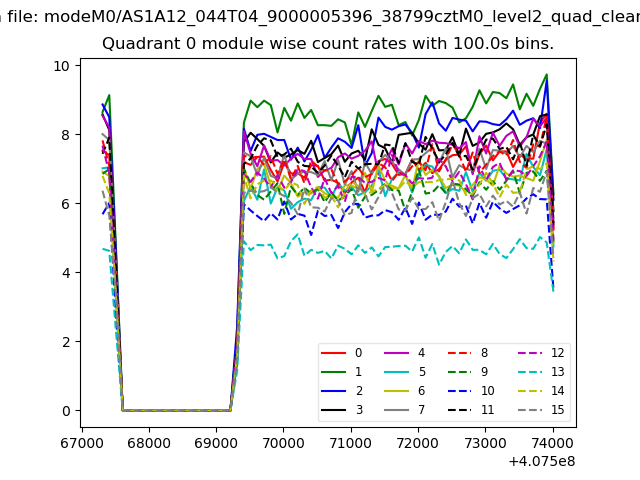
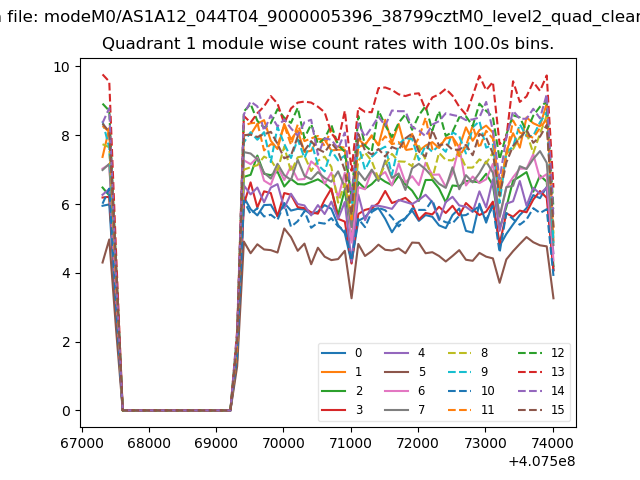
| Module-wise count rates for Quadrant A Data is divided into 100 sec bins |
 |
 |
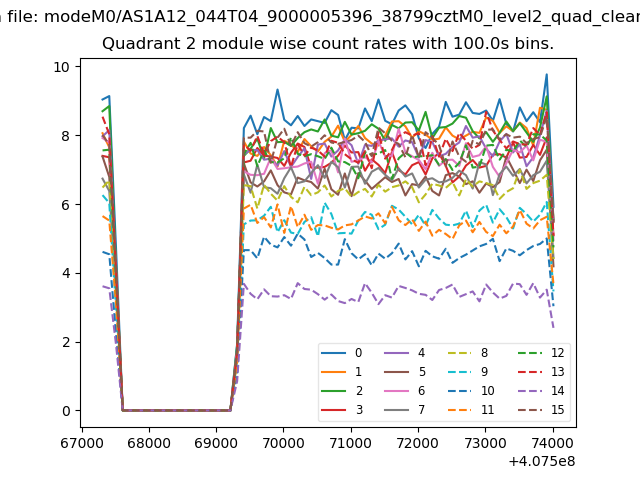
| Module-wise count rates for Quadrant B Data is divided into 100 sec bins |
 |
 |
| Module-wise count rates for Quadrant C Data is divided into 100 sec bins |
 |
 |
| Module-wise count rates for Quadrant D Data is divided into 100 sec bins |
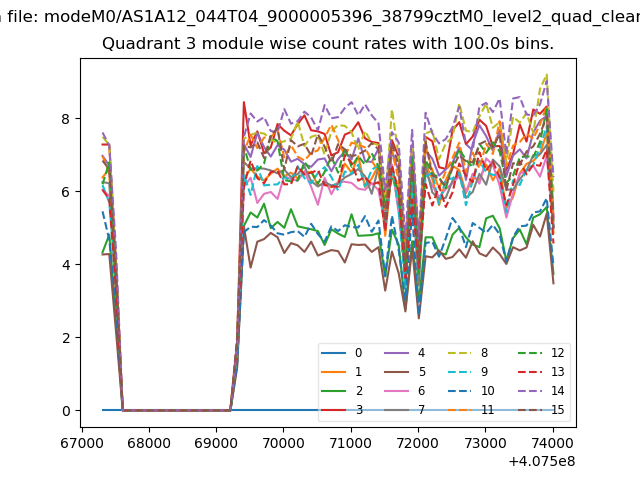 |
 |
| Parameter | Plot |
|---|---|
| CZT HV Monitor | 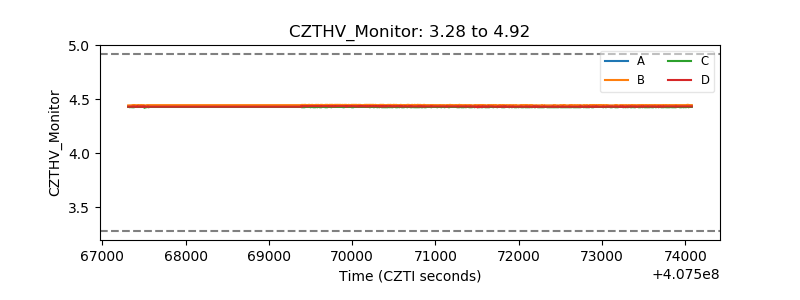 |
| D_VDD | 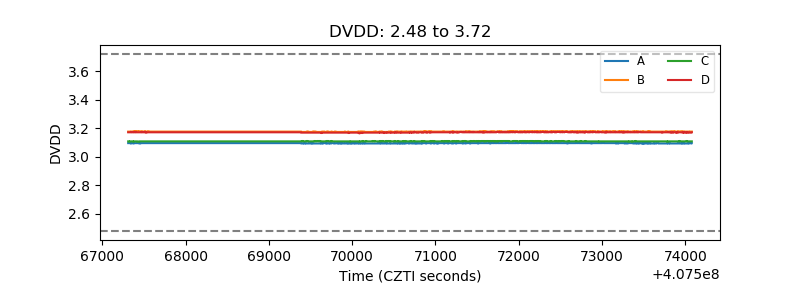 |
| Temperature 1 | 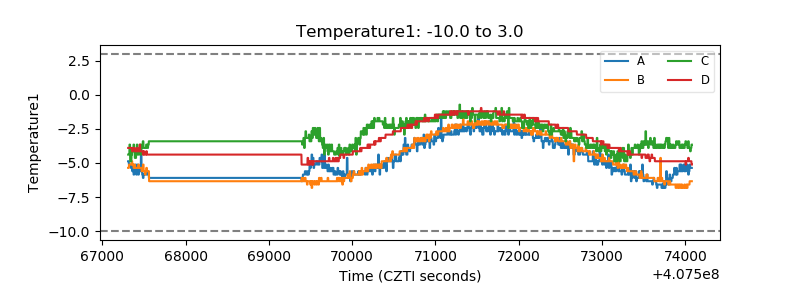 |
| Veto HV Monitor | 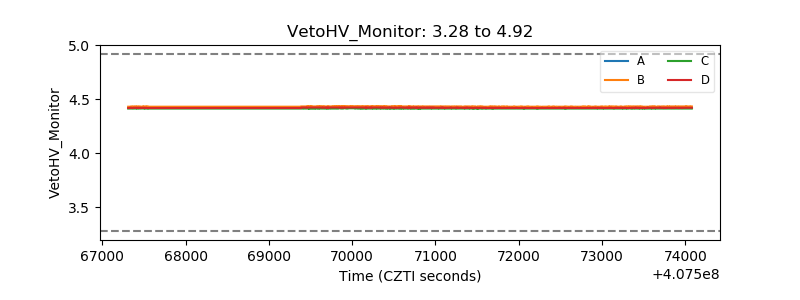 |
| Veto LLD | 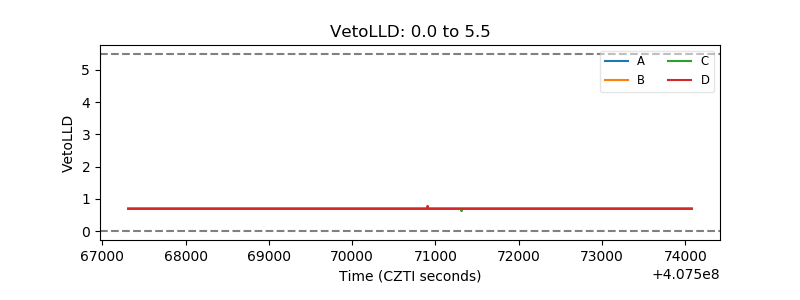 |
| Alpha Counter | 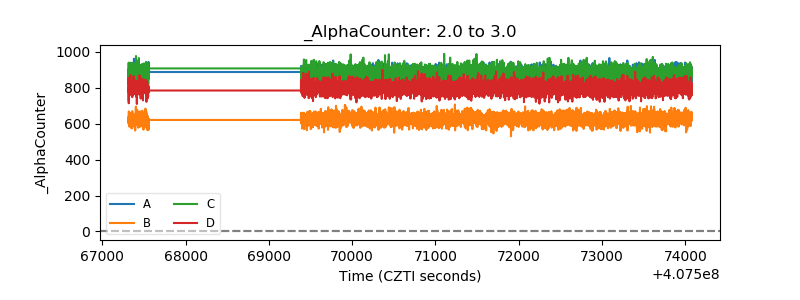 |
| _CPM_Rate | 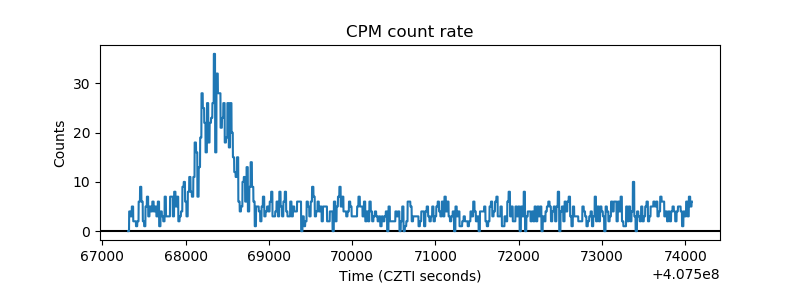 |
| CZT Counter | 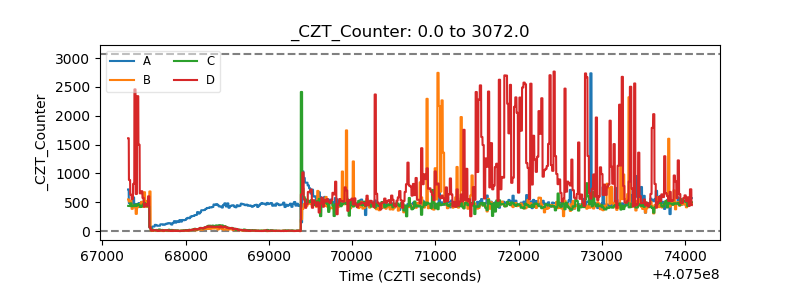 |
| +2.5 Volts monitor | 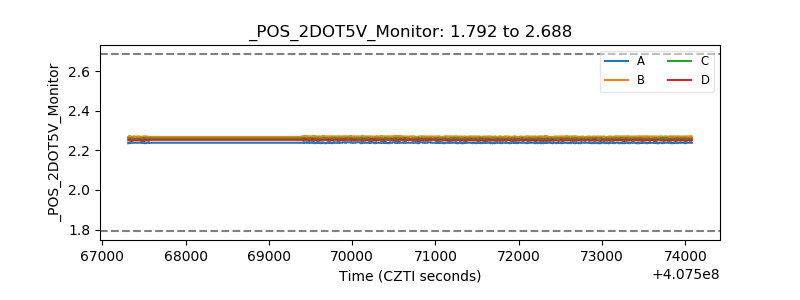 |
| +5 Volts monitor | 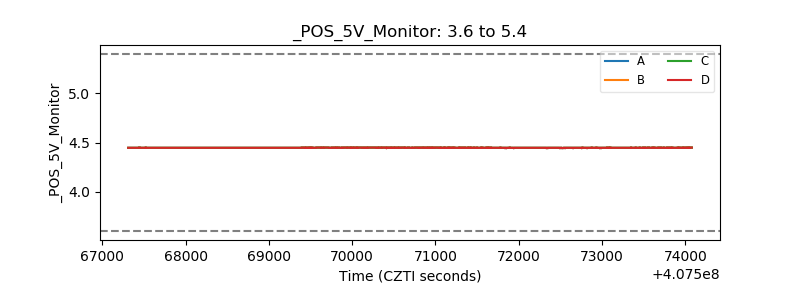 |
| _ROLL_ROT | 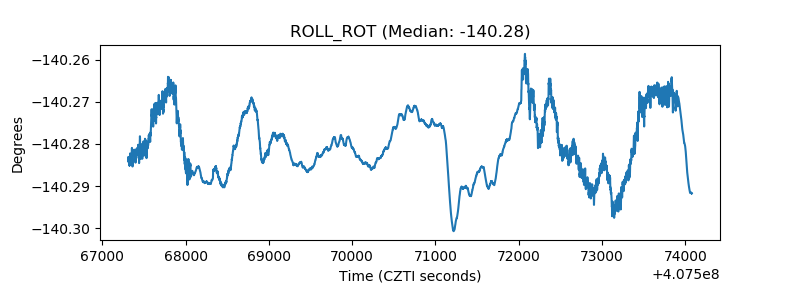 |
| _Roll_DEC | 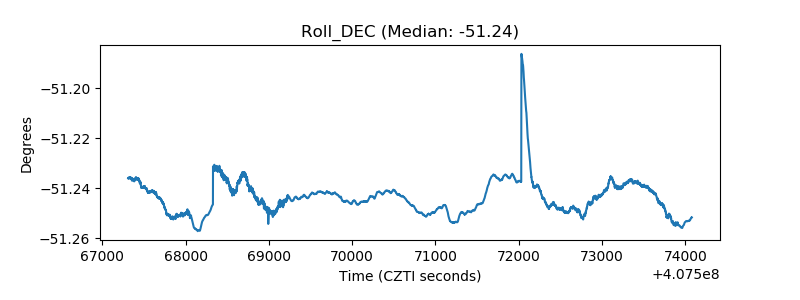 |
| _Roll_RA | 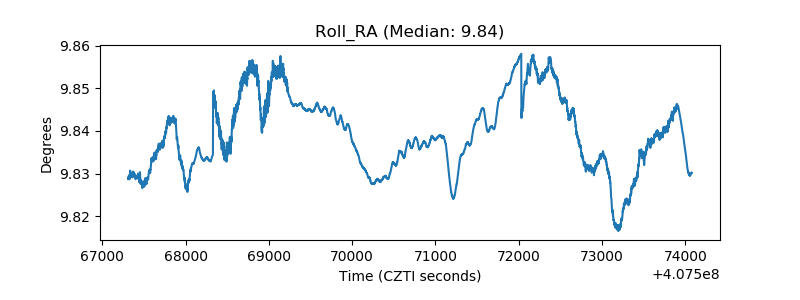 |
| Veto Counter | 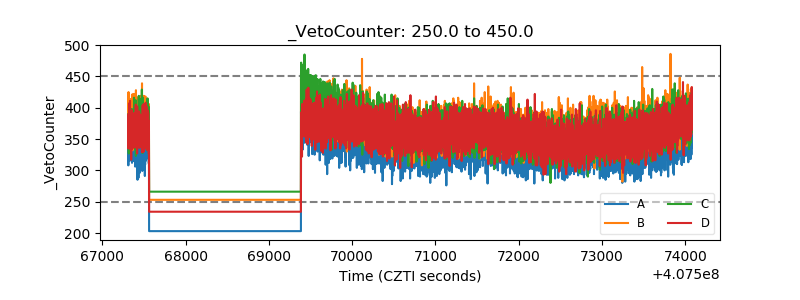 |