| Param | Original file | Final file |
|---|---|---|
| Filename | modeM0/AS1A12_025T11_9000005398_38799cztM0_level2.fits | modeM0/AS1A12_025T11_9000005398_38799cztM0_level2_quad_clean.evt |
| Size (bytes) | 56,453,760 | 15,428,160 |
| Size | 53.8 MB | 14.7 MB |
| Events in quadrant A | 715,781 | 98,771 |
| Events in quadrant B | 399,725 | 104,053 |
| Events in quadrant C | 431,923 | 100,188 |
| Events in quadrant D | 466,231 | 92,215 |
| Mode SS | |||
|---|---|---|---|
| Quadrant | BADHDUFLAG | Total packets | Discarded packets |
| A | 0 | 18 | 0 |
| B | 0 | 18 | 0 |
| C | 0 | 18 | 0 |
| D | 0 | 18 | 0 |
| Mode M0 | |||
|---|---|---|---|
| Quadrant | BADHDUFLAG | Total packets | Discarded packets |
| A | 0 | 2746 | 2 |
| B | 0 | 1873 | 1 |
| C | 0 | 1908 | 1 |
| D | 0 | 2010 | 1 |
| Mode M9 | |||
|---|---|---|---|
| Quadrant | BADHDUFLAG | Total packets | Discarded packets |
| A | 0 | 2 | 0 |
| B | 0 | 2 | 0 |
| C | 0 | 2 | 0 |
| D | 0 | 2 | 0 |
| Quadrant | Total seconds | Saturated seconds | Saturation percentage |
|---|---|---|---|
| A | 935 | 33 | 3.529412% |
| B | 935 | 1 | 0.106952% |
| C | 935 | 3 | 0.320856% |
| D | 935 | 1 | 0.106952% |
Noise dominated data is calculated using 1-second bins in cleaned event files. If a bin has >2000 counts, and if more than 50% of those come from <1% of pixels, then it is considered to be noise-dominated and hence unusable.
| Quadrant | # 1 sec bins | Bins with >0 counts | Bins with >2000 counts | High rate bins dominated by noise | Noise dominated (total time) | Noise dominated (detector-on time) | Marked lightcurve |
|---|---|---|---|---|---|---|---|
| A | 935 | 935 | 34 | 34 | 3.64% | 3.64% | 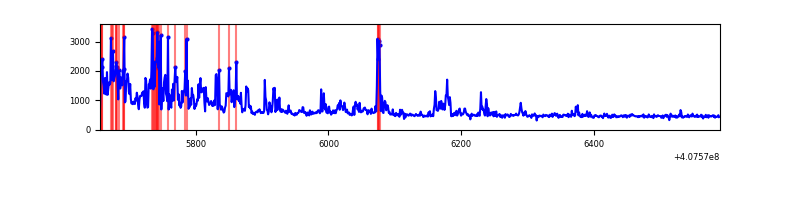 |
| B | 935 | 935 | 0 | 0 | 0.00% | 0.00% | 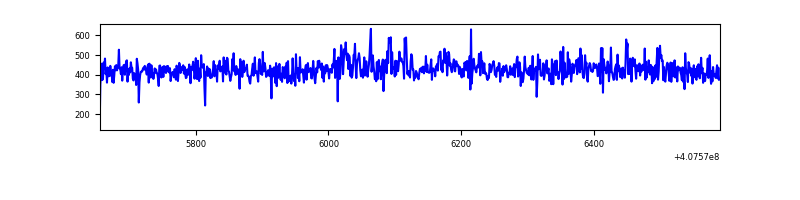 |
| C | 935 | 935 | 0 | 0 | 0.00% | 0.00% | 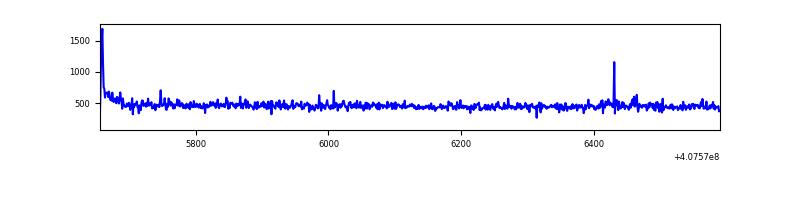 |
| D | 935 | 935 | 1 | 1 | 0.11% | 0.11% | 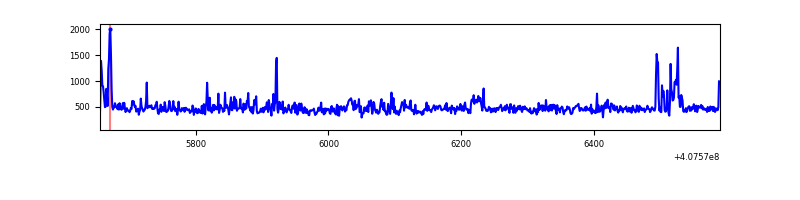 |
Top three noisy pixels from each quadrant. If the there are fewer than three noisy pixels in the level2.evt file, extra rows are filled as -1
| Pixel properties | Quadrant properties | ||||||
|---|---|---|---|---|---|---|---|
| Quadrant | DetID | PixID | Counts | Sigma | Mean | Median | Sigma |
| A | 13 | 248 | 209000 | 9526.27 | 97 | 95 | 21.9 |
| A | 10 | 83 | 119197 | 5431.17 | 97 | 95 | 21.9 |
| A | 7 | 16 | 5569 | 249.62 | 97 | 95 | 21.9 |
| B | 0 | 230 | 4802 | 218.15 | 98 | 95 | 21.6 |
| B | 5 | 184 | 3980 | 180.05 | 98 | 95 | 21.6 |
| B | 12 | 111 | 2492 | 111.09 | 98 | 95 | 21.6 |
| C | 15 | 214 | 46549 | 1901.28 | 95 | 95 | 24.4 |
| C | 0 | 10 | 8155 | 329.88 | 95 | 95 | 24.4 |
| C | 15 | 208 | 2141 | 83.74 | 95 | 95 | 24.4 |
| D | 2 | 16 | 45484 | 1790.24 | 96 | 93 | 25.4 |
| D | 5 | 222 | 17276 | 677.7 | 96 | 93 | 25.4 |
| D | 12 | 235 | 15720 | 616.33 | 96 | 93 | 25.4 |
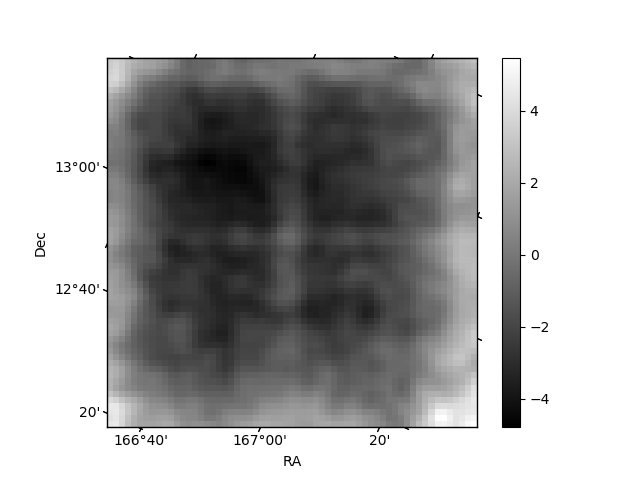
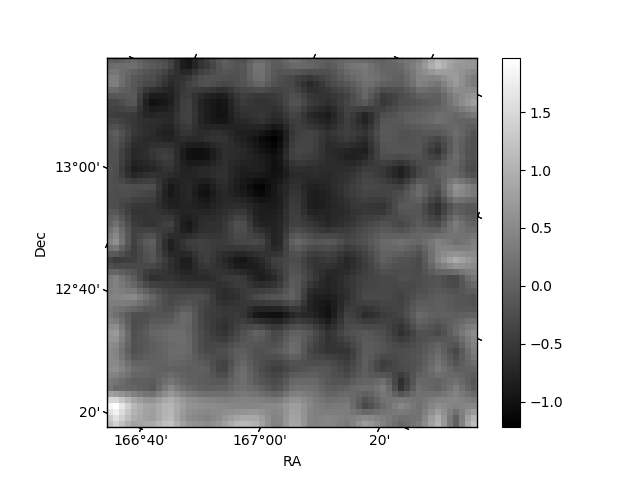
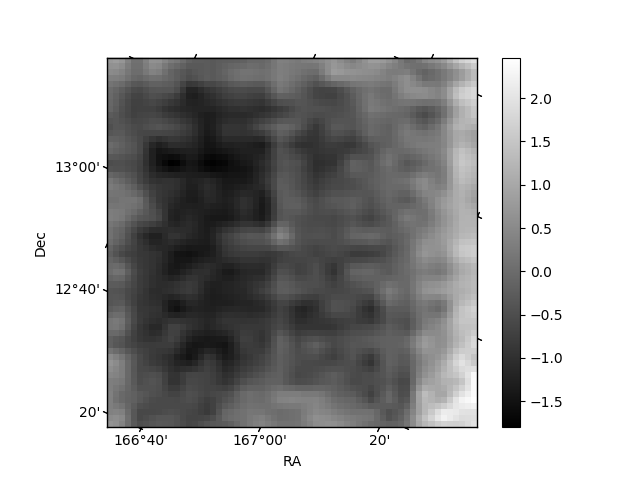
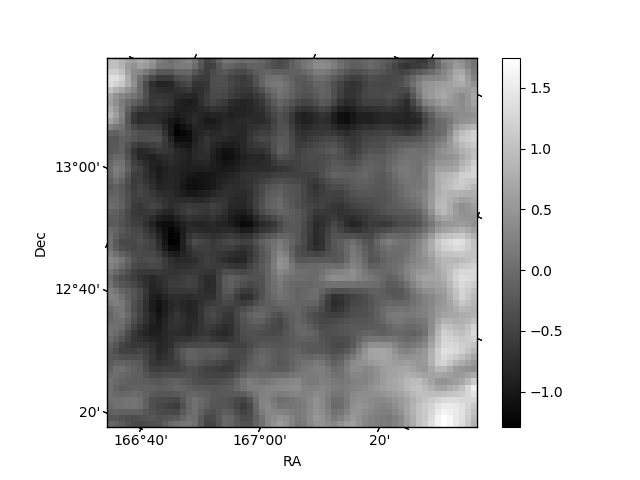
Histogram calculated using DETX and DETY for each event in the final _common_clean file
| Quadrant A | 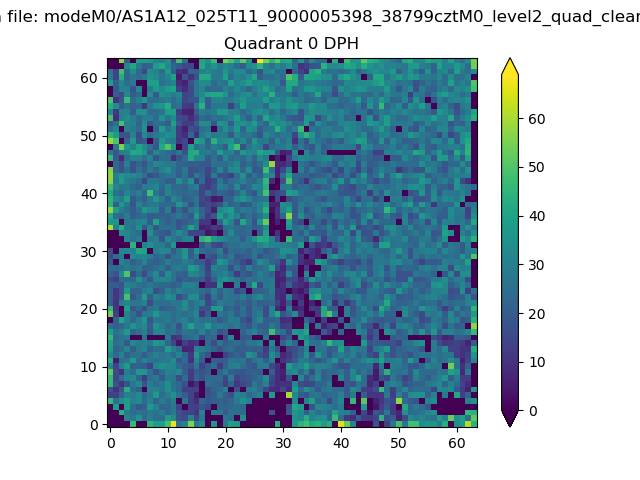 |
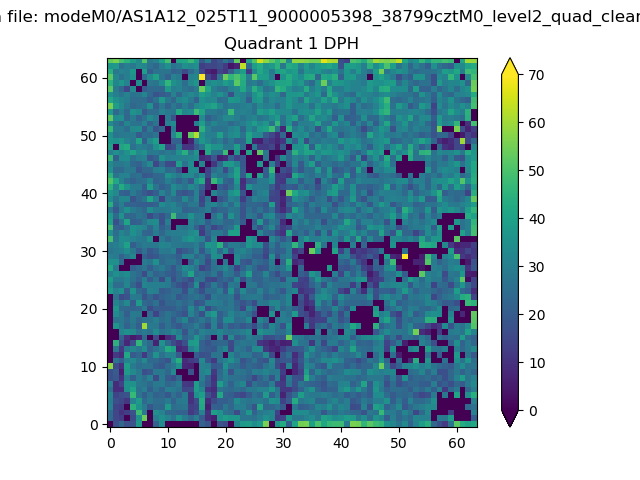 |
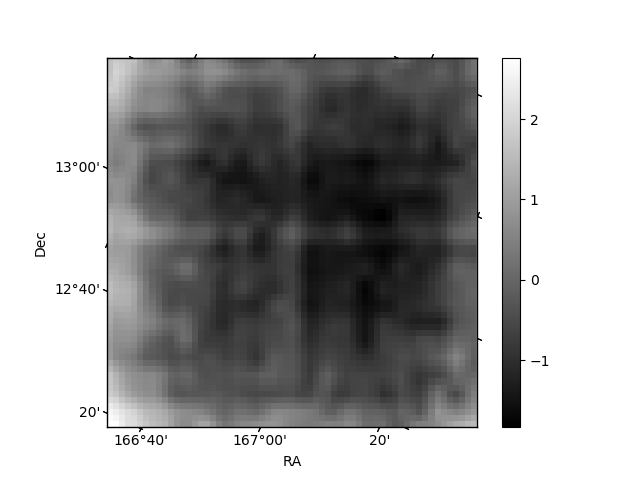
Quadrant B |
|---|---|---|---|
| Quadrant D | 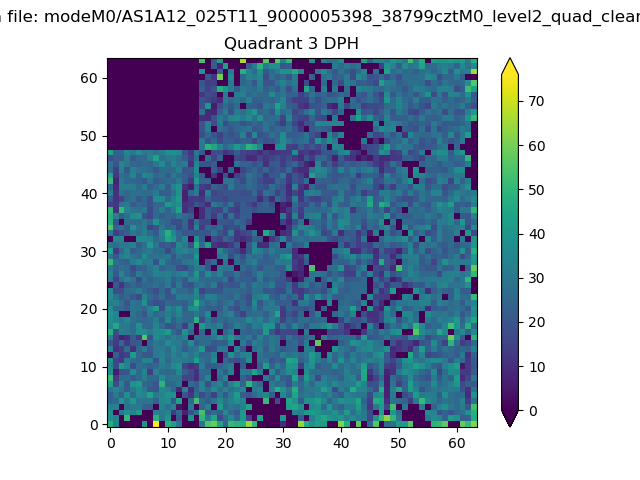 |
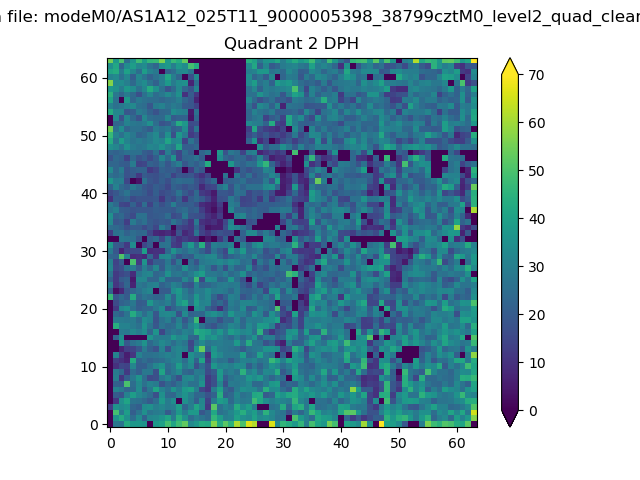 |
Quadrant C |
| Plot type | Count rate plots | Images |
|---|---|---|
| Comparison with Poisson distribution Blue bars denote a histogram of data divided into 1 sec bins. Red curve is a Poisson curve with rate = median count rate of data. |
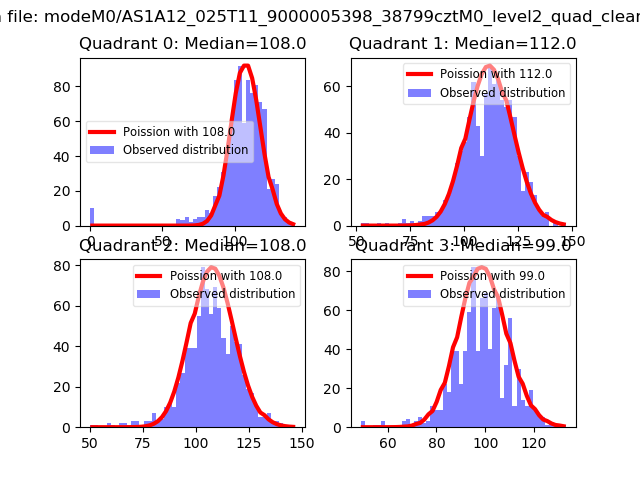 |
 |
| Quadrant-wise count rates Data is divided into 100 sec bins |
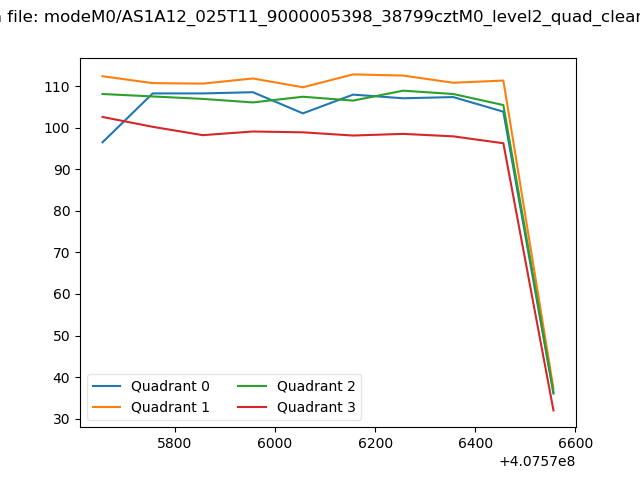 |
|
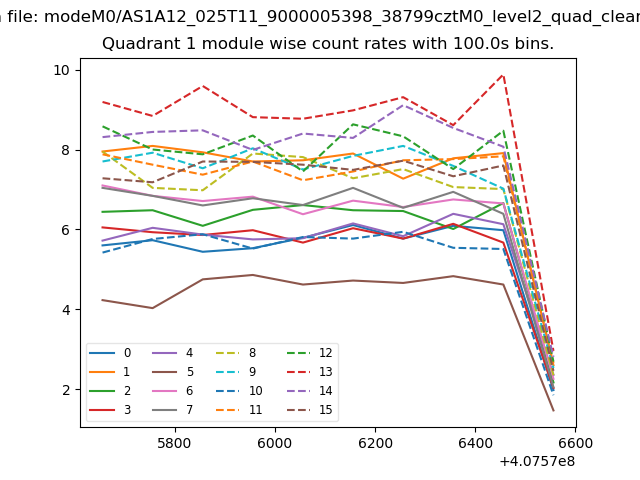
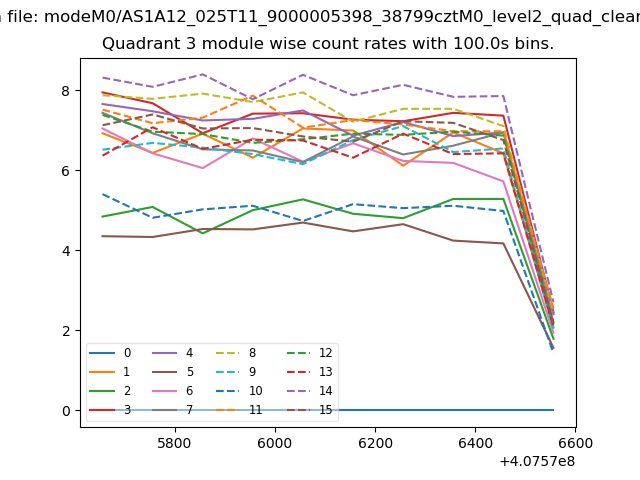
| Module-wise count rates for Quadrant A Data is divided into 100 sec bins |
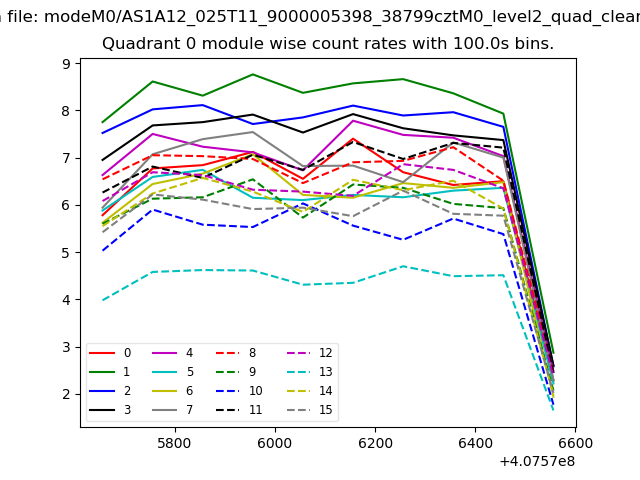 |
 |
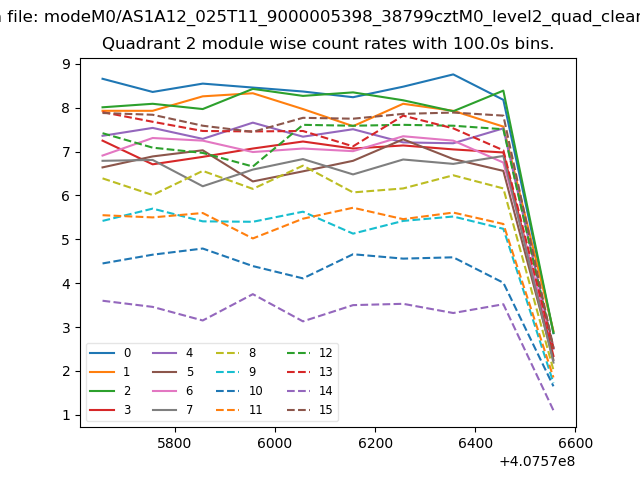
| Module-wise count rates for Quadrant B Data is divided into 100 sec bins |
 |
 |
| Module-wise count rates for Quadrant C Data is divided into 100 sec bins |
 |
 |
| Module-wise count rates for Quadrant D Data is divided into 100 sec bins |
 |
 |
| Parameter | Plot |
|---|---|
| CZT HV Monitor | 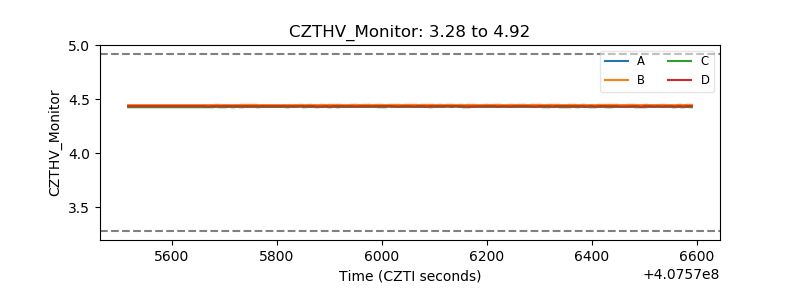 |
| D_VDD | 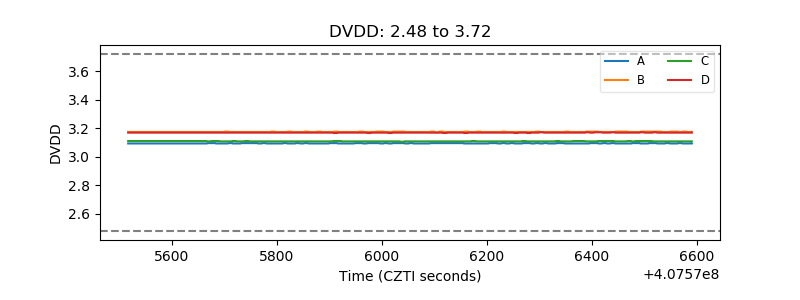 |
| Temperature 1 | 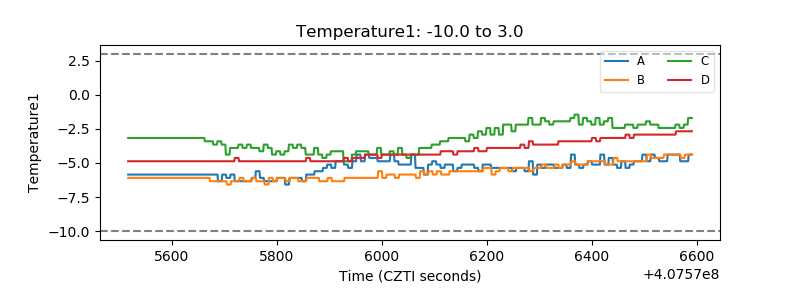 |
| Veto HV Monitor | 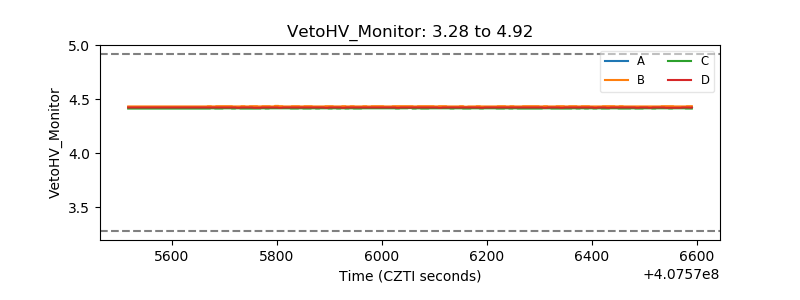 |
| Veto LLD | 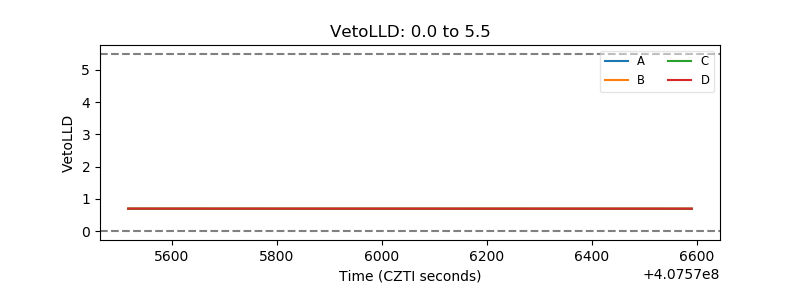 |
| Alpha Counter | 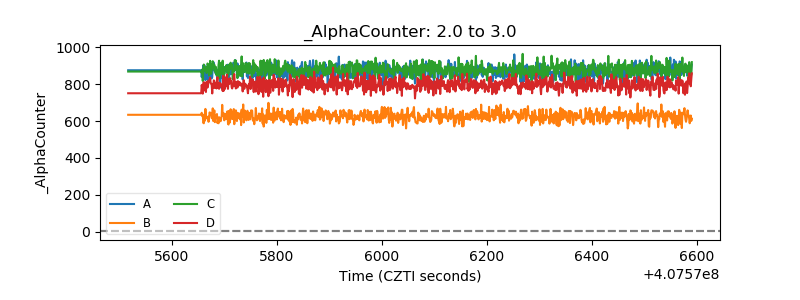 |
| _CPM_Rate | 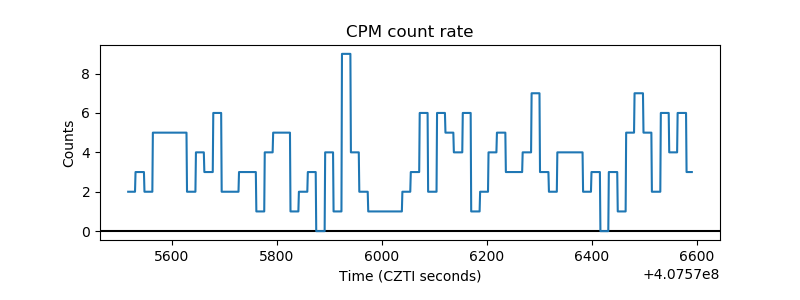 |
| CZT Counter | 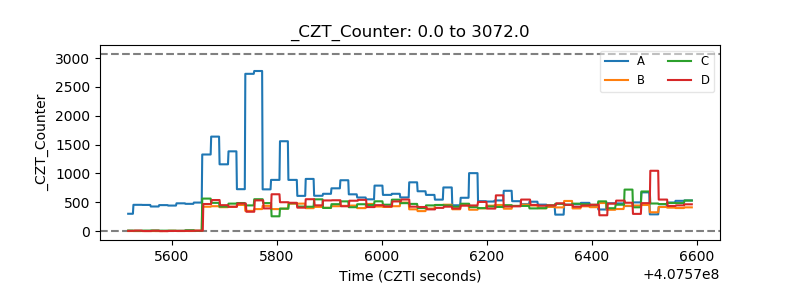 |
| +2.5 Volts monitor | 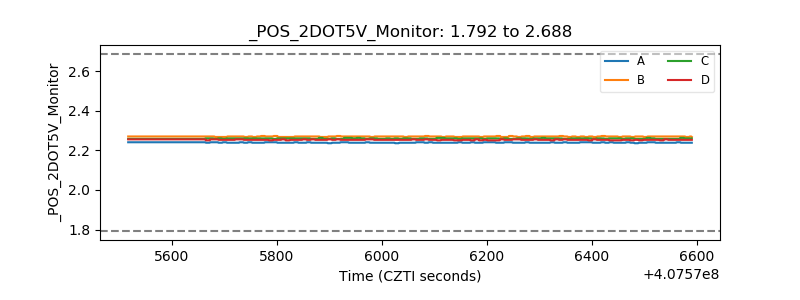 |
| +5 Volts monitor | 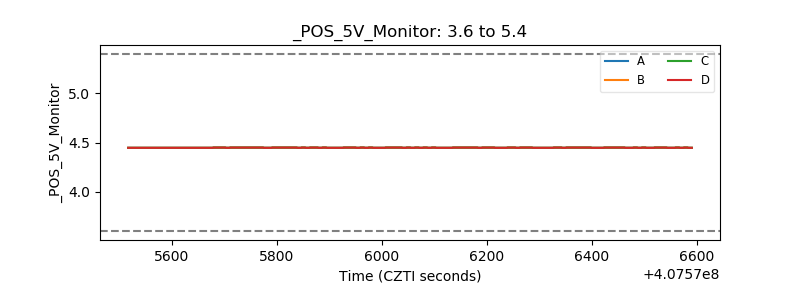 |
| _ROLL_ROT | 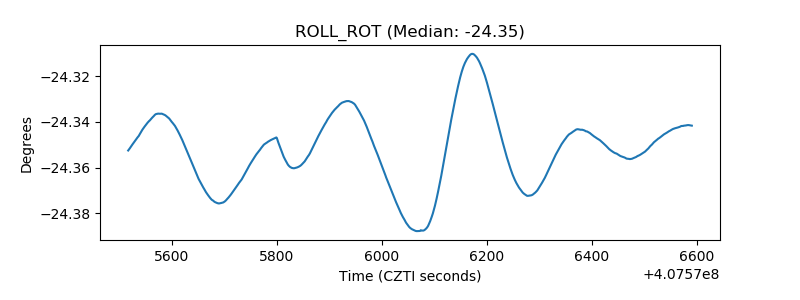 |
| _Roll_DEC | 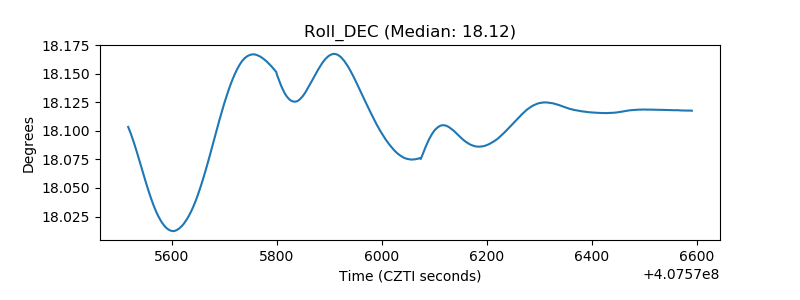 |
| _Roll_RA | 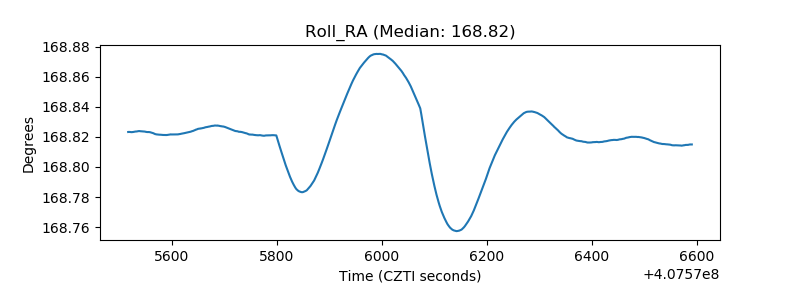 |
| Veto Counter | 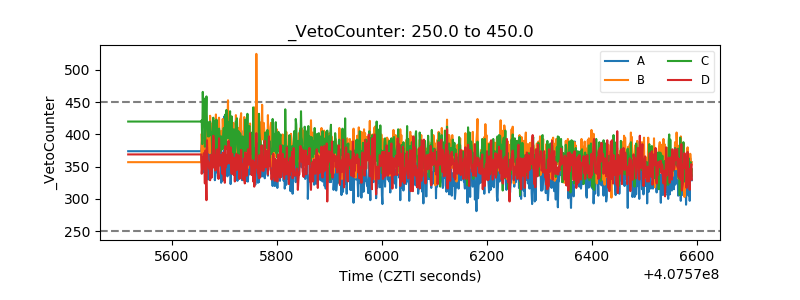 |