| Param | Original file | Final file |
|---|---|---|
| Filename | modeM0/AS1A12_025T11_9000005398_38800cztM0_level2.fits | modeM0/AS1A12_025T11_9000005398_38800cztM0_level2_quad_clean.evt |
| Size (bytes) | 392,414,400 | 95,702,400 |
| Size | 374.2 MB | 91.3 MB |
| Events in quadrant A | 3,316,492 | 642,971 |
| Events in quadrant B | 3,025,881 | 649,458 |
| Events in quadrant C | 2,862,293 | 632,581 |
| Events in quadrant D | 4,865,414 | 563,537 |
| Mode SS | |||
|---|---|---|---|
| Quadrant | BADHDUFLAG | Total packets | Discarded packets |
| A | 0 | 118 | 0 |
| B | 0 | 118 | 0 |
| C | 0 | 118 | 0 |
| D | 0 | 118 | 0 |
| Mode M0 | |||
|---|---|---|---|
| Quadrant | BADHDUFLAG | Total packets | Discarded packets |
| A | 0 | 13274 | 3 |
| B | 0 | 12848 | 2 |
| C | 0 | 12008 | 2 |
| D | 0 | 18453 | 2 |
| Mode M9 | |||
|---|---|---|---|
| Quadrant | BADHDUFLAG | Total packets | Discarded packets |
| A | 0 | 16 | 0 |
| B | 0 | 16 | 0 |
| C | 0 | 16 | 0 |
| D | 0 | 16 | 0 |
| Quadrant | Total seconds | Saturated seconds | Saturation percentage |
|---|---|---|---|
| A | 5860 | 38 | 0.648464% |
| B | 5860 | 138 | 2.354949% |
| C | 5860 | 8 | 0.136519% |
| D | 5860 | 315 | 5.375427% |
Noise dominated data is calculated using 1-second bins in cleaned event files. If a bin has >2000 counts, and if more than 50% of those come from <1% of pixels, then it is considered to be noise-dominated and hence unusable.
| Quadrant | # 1 sec bins | Bins with >0 counts | Bins with >2000 counts | High rate bins dominated by noise | Noise dominated (total time) | Noise dominated (detector-on time) | Marked lightcurve |
|---|---|---|---|---|---|---|---|
| A | 7174 | 5861 | 38 | 38 | 0.53% | 0.65% | 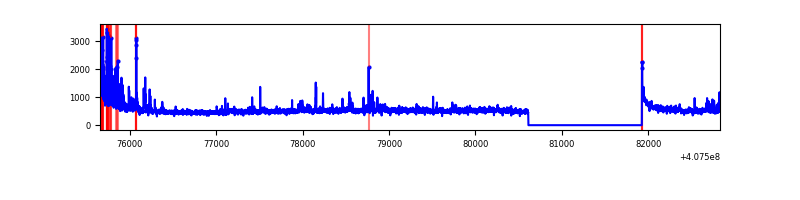 |
| B | 7174 | 5861 | 122 | 122 | 1.70% | 2.08% | 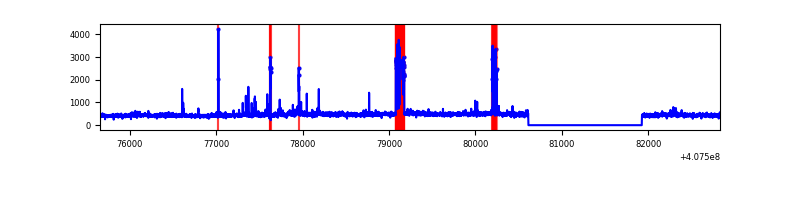 |
| C | 7174 | 5861 | 4 | 4 | 0.06% | 0.07% | 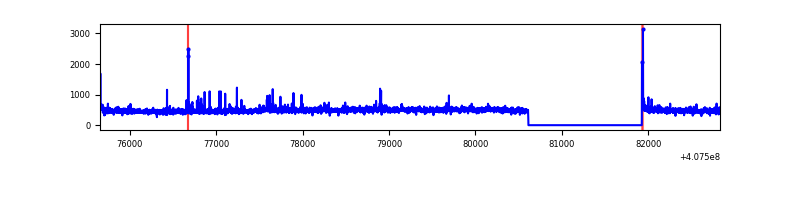 |
| D | 7173 | 5860 | 271 | 271 | 3.78% | 4.62% | 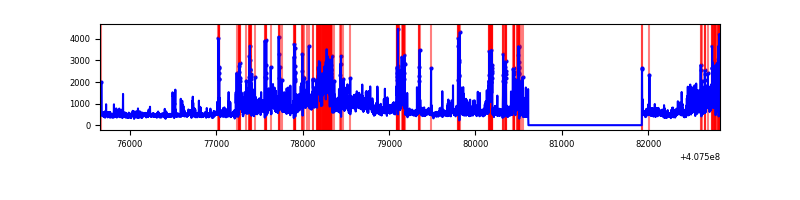 |
Top three noisy pixels from each quadrant. If the there are fewer than three noisy pixels in the level2.evt file, extra rows are filled as -1
| Pixel properties | Quadrant properties | ||||||
|---|---|---|---|---|---|---|---|
| Quadrant | DetID | PixID | Counts | Sigma | Mean | Median | Sigma |
| A | 10 | 83 | 432025 | 3204.02 | 655 | 642 | 134.6 |
| A | 13 | 248 | 235619 | 1745.25 | 655 | 642 | 134.6 |
| A | 12 | 16 | 39000 | 284.9 | 655 | 642 | 134.6 |
| B | 5 | 200 | 252852 | 1985.18 | 644 | 627 | 127.1 |
| B | 4 | 171 | 155746 | 1220.89 | 644 | 627 | 127.1 |
| B | 0 | 230 | 44057 | 341.82 | 644 | 627 | 127.1 |
| C | 15 | 214 | 261813 | 1736.89 | 641 | 644 | 150.4 |
| C | 15 | 208 | 26441 | 171.56 | 641 | 644 | 150.4 |
| C | 1 | 23 | 25690 | 166.57 | 641 | 644 | 150.4 |
| D | 12 | 235 | 776473 | 4929.78 | 631 | 611 | 157.4 |
| D | 2 | 249 | 567079 | 3599.3 | 631 | 611 | 157.4 |
| D | 5 | 222 | 435772 | 2764.99 | 631 | 611 | 157.4 |
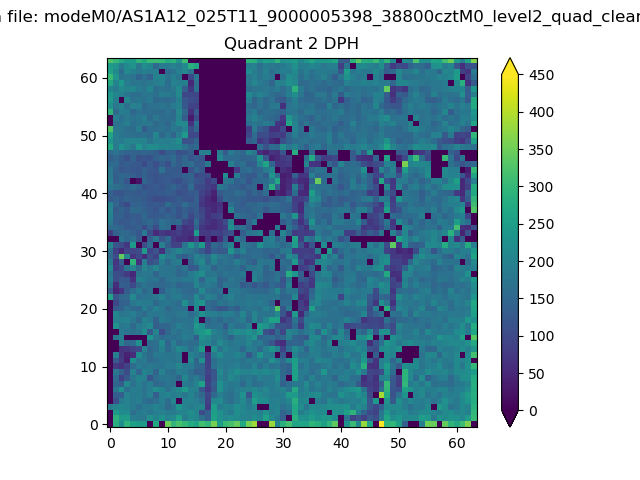
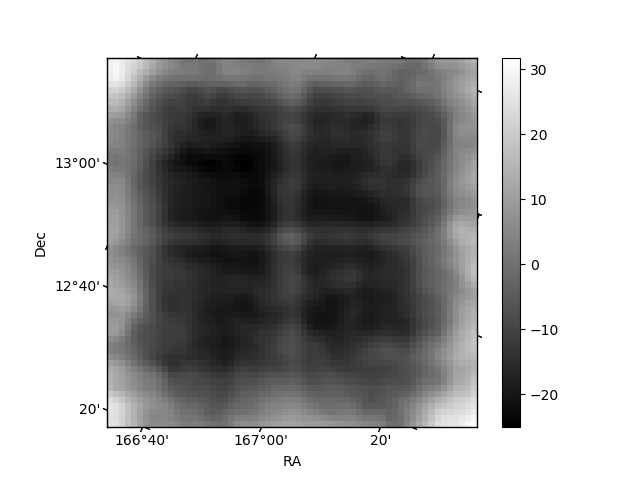
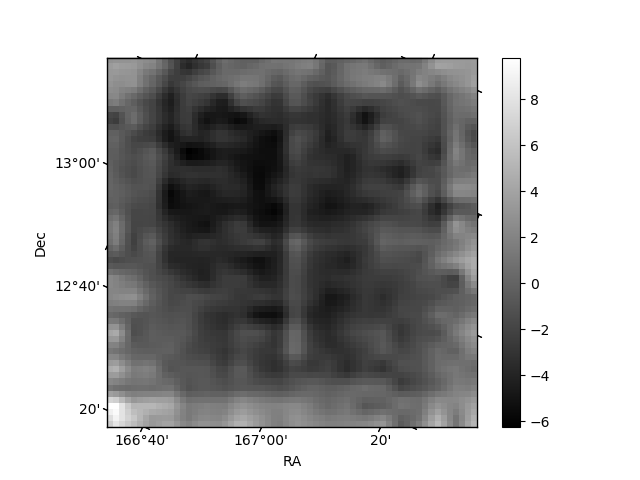
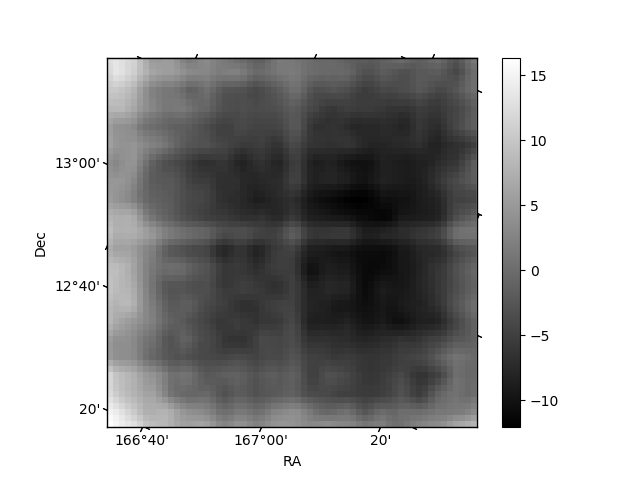
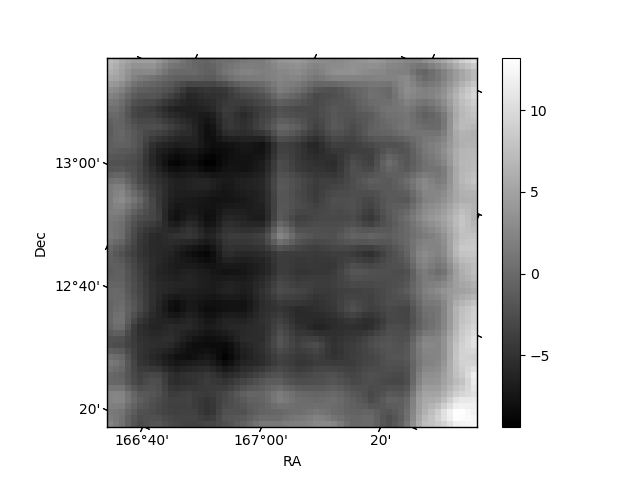
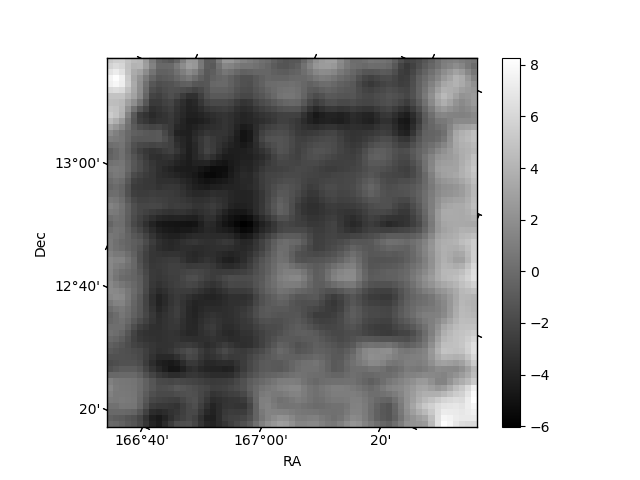
Histogram calculated using DETX and DETY for each event in the final _common_clean file
| Quadrant A | 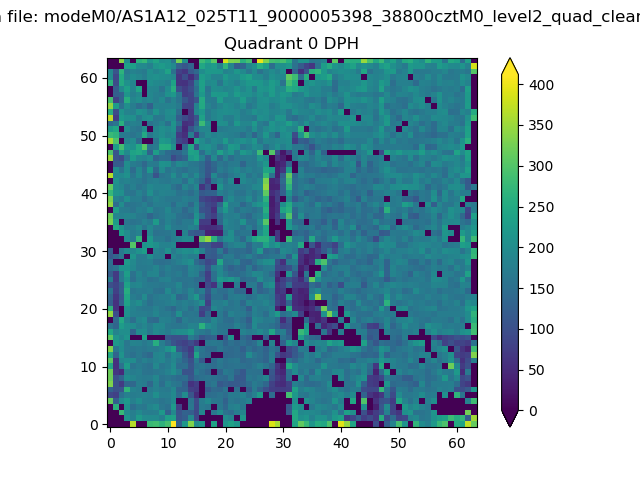 |
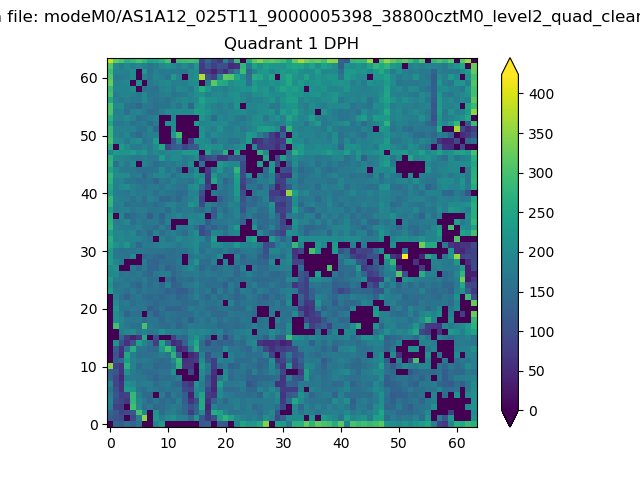 |
Quadrant B |
|---|---|---|---|
| Quadrant D | 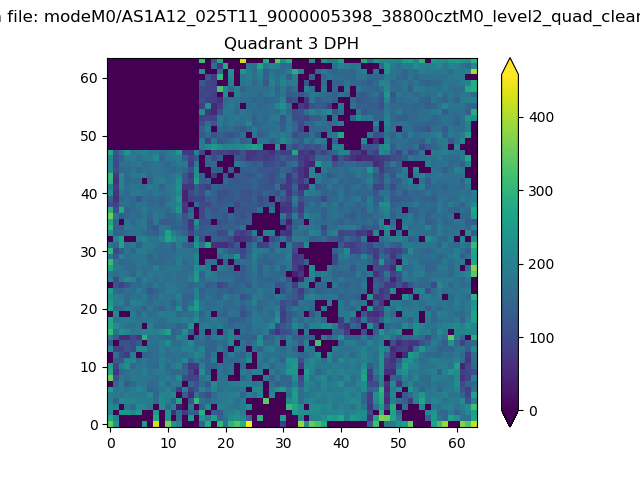 |
 |
Quadrant C |
| Plot type | Count rate plots | Images |
|---|---|---|
| Comparison with Poisson distribution Blue bars denote a histogram of data divided into 1 sec bins. Red curve is a Poisson curve with rate = median count rate of data. |
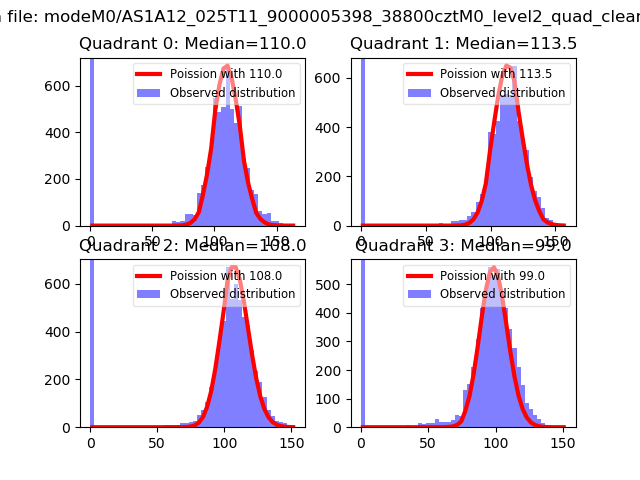 |
 |
| Quadrant-wise count rates Data is divided into 100 sec bins |
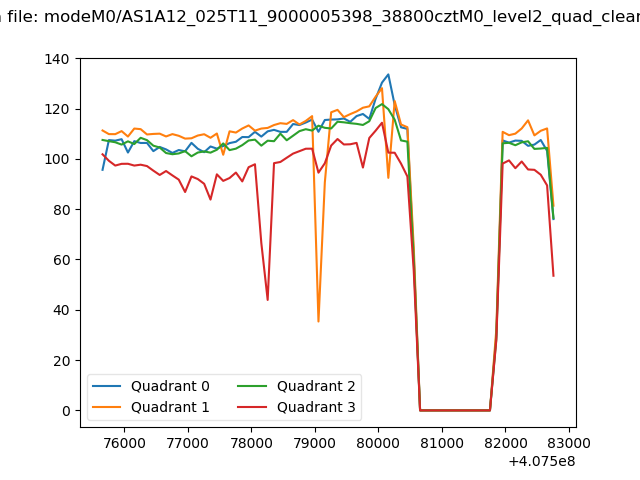 |
|
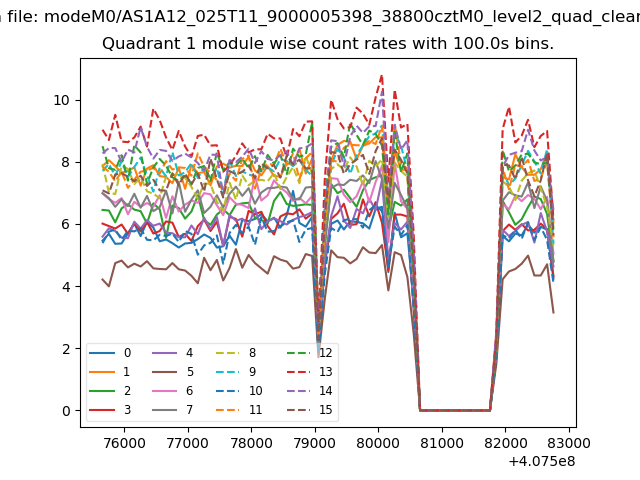
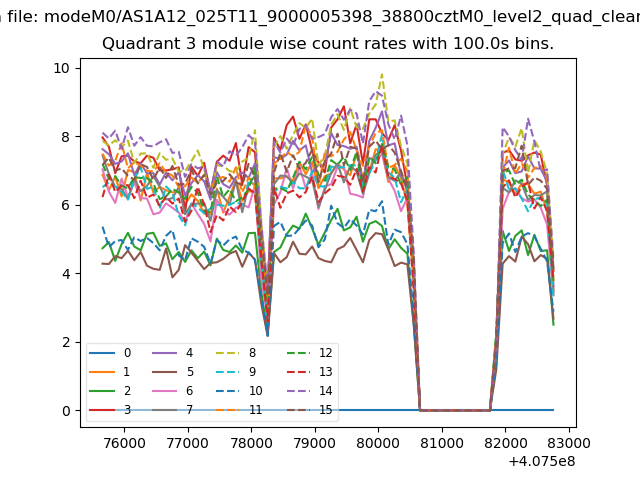
| Module-wise count rates for Quadrant A Data is divided into 100 sec bins |
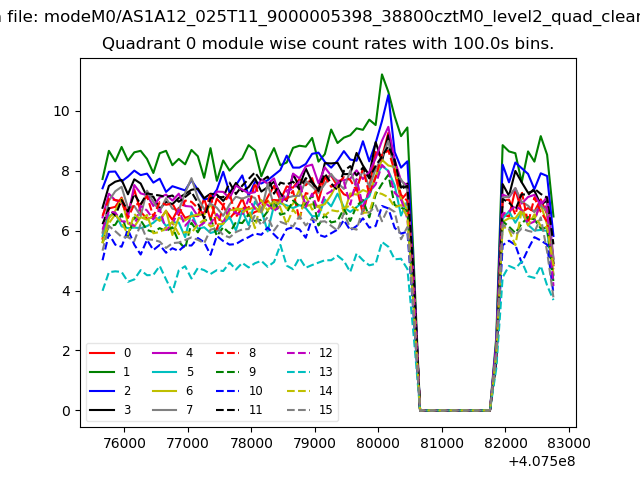 |
 |
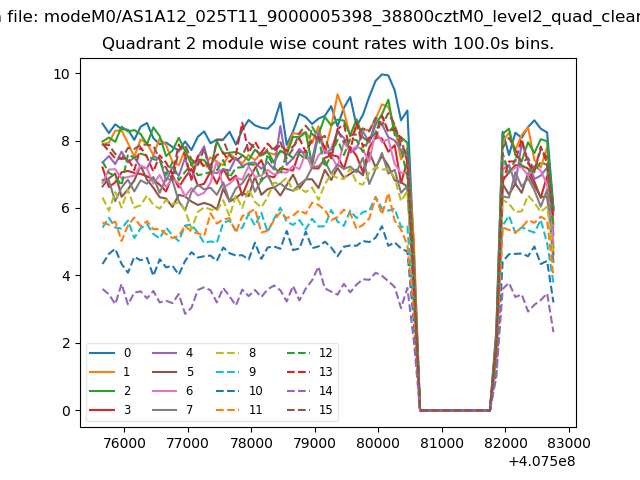
| Module-wise count rates for Quadrant B Data is divided into 100 sec bins |
 |
 |
| Module-wise count rates for Quadrant C Data is divided into 100 sec bins |
 |
 |
| Module-wise count rates for Quadrant D Data is divided into 100 sec bins |
 |
 |
| Parameter | Plot |
|---|---|
| CZT HV Monitor | 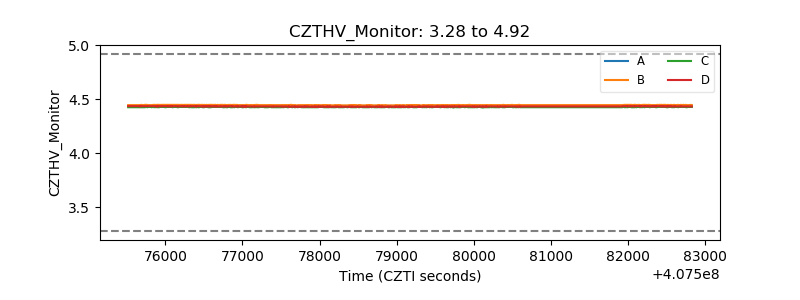 |
| D_VDD | 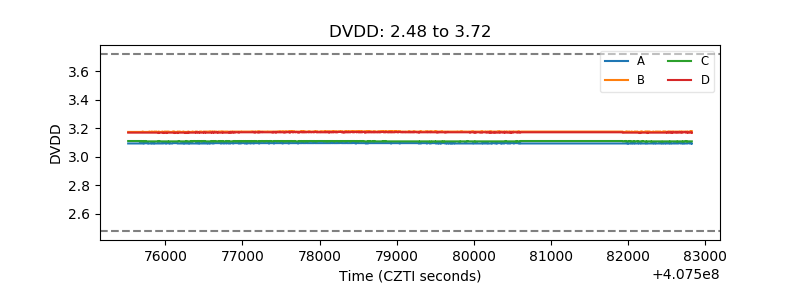 |
| Temperature 1 | 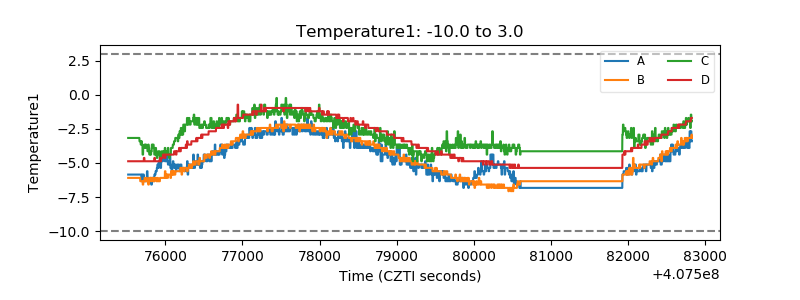 |
| Veto HV Monitor | 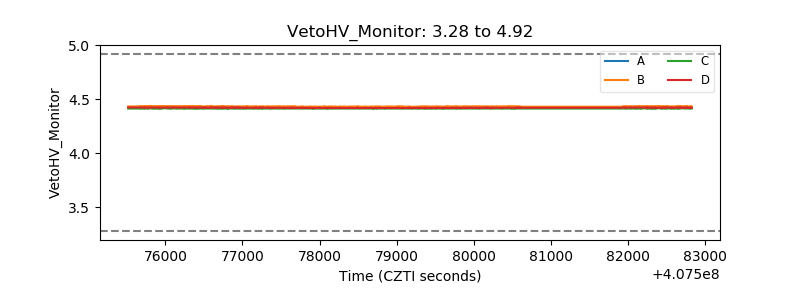 |
| Veto LLD | 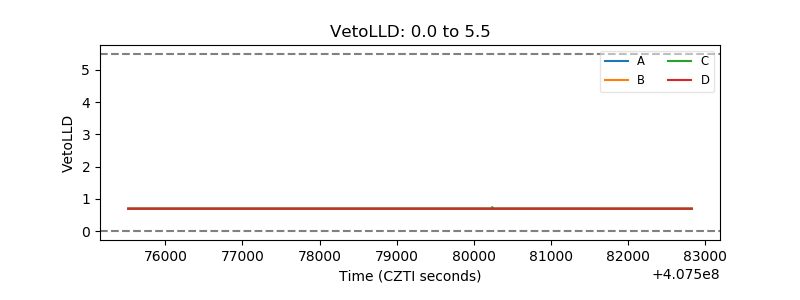 |
| Alpha Counter | 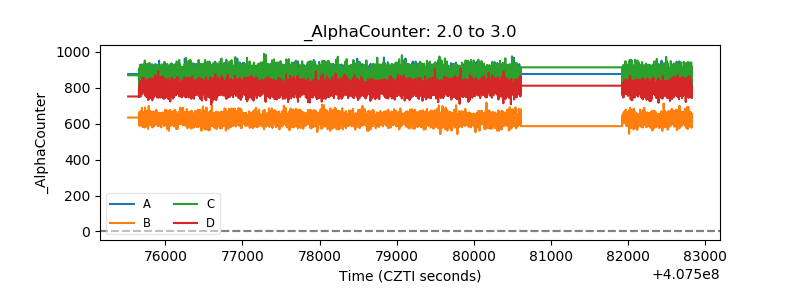 |
| _CPM_Rate | 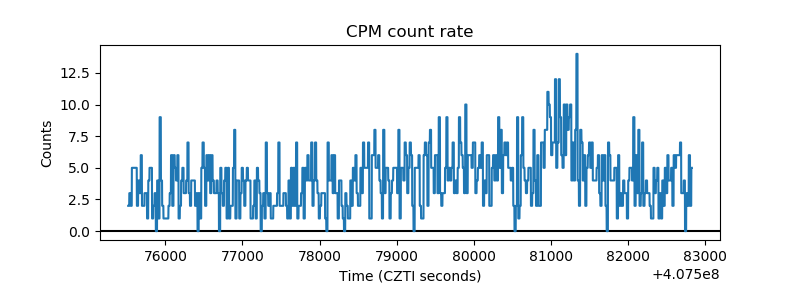 |
| CZT Counter | 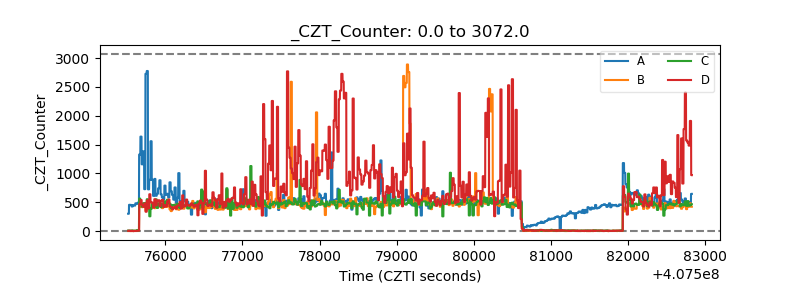 |
| +2.5 Volts monitor | 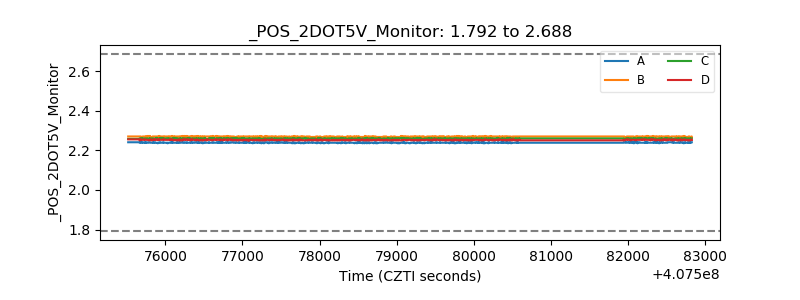 |
| +5 Volts monitor | 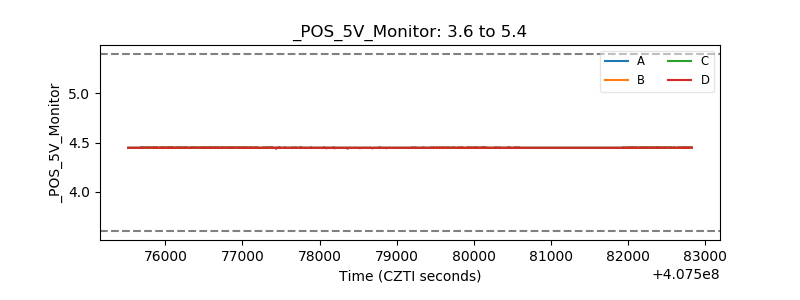 |
| _ROLL_ROT | 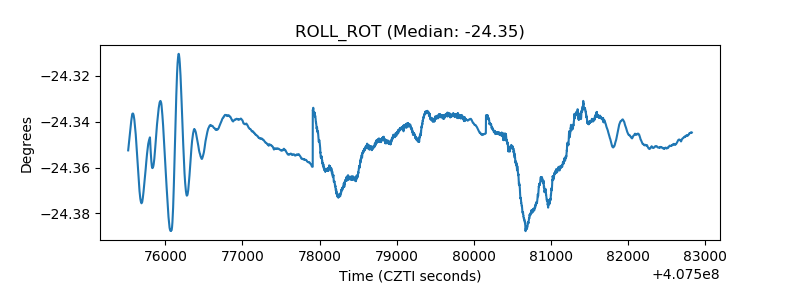 |
| _Roll_DEC | 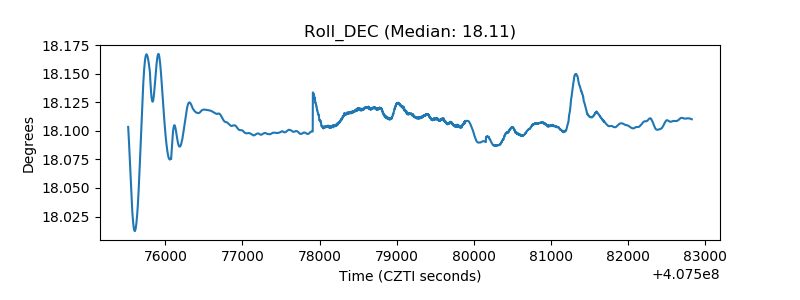 |
| _Roll_RA | 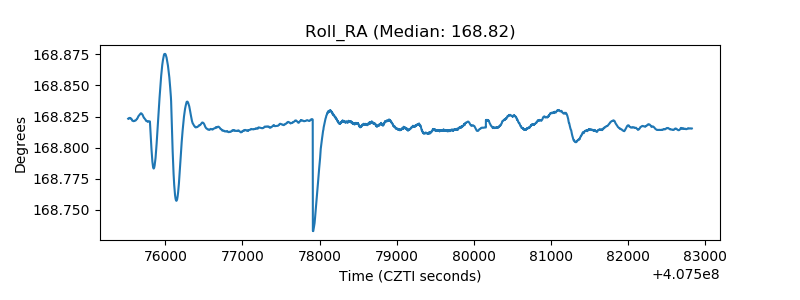 |
| Veto Counter | 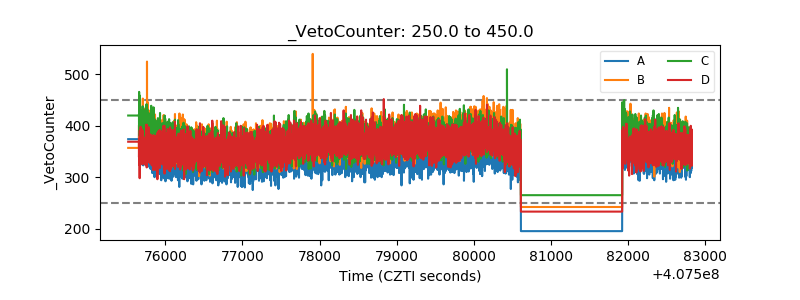 |