| Param | Original file | Final file |
|---|---|---|
| Filename | modeM0/AS1A12_025T11_9000005398_38801cztM0_level2.fits | modeM0/AS1A12_025T11_9000005398_38801cztM0_level2_quad_clean.evt |
| Size (bytes) | 385,001,280 | 97,335,360 |
| Size | 367.2 MB | 92.8 MB |
| Events in quadrant A | 3,316,612 | 653,478 |
| Events in quadrant B | 2,918,533 | 666,366 |
| Events in quadrant C | 3,111,464 | 633,042 |
| Events in quadrant D | 4,445,303 | 581,369 |
| Mode SS | |||
|---|---|---|---|
| Quadrant | BADHDUFLAG | Total packets | Discarded packets |
| A | 0 | 120 | 0 |
| B | 0 | 120 | 0 |
| C | 0 | 120 | 0 |
| D | 0 | 120 | 0 |
| Mode M0 | |||
|---|---|---|---|
| Quadrant | BADHDUFLAG | Total packets | Discarded packets |
| A | 0 | 13328 | 3 |
| B | 0 | 12544 | 2 |
| C | 0 | 12728 | 2 |
| D | 0 | 17323 | 2 |
| Mode M9 | |||
|---|---|---|---|
| Quadrant | BADHDUFLAG | Total packets | Discarded packets |
| A | 0 | 20 | 0 |
| B | 0 | 20 | 0 |
| C | 0 | 20 | 0 |
| D | 0 | 21 | 0 |
| Quadrant | Total seconds | Saturated seconds | Saturation percentage |
|---|---|---|---|
| A | 5911 | 20 | 0.338352% |
| B | 5911 | 68 | 1.150398% |
| C | 5911 | 43 | 0.727457% |
| D | 5911 | 147 | 2.486889% |
Noise dominated data is calculated using 1-second bins in cleaned event files. If a bin has >2000 counts, and if more than 50% of those come from <1% of pixels, then it is considered to be noise-dominated and hence unusable.
| Quadrant | # 1 sec bins | Bins with >0 counts | Bins with >2000 counts | High rate bins dominated by noise | Noise dominated (total time) | Noise dominated (detector-on time) | Marked lightcurve |
|---|---|---|---|---|---|---|---|
| A | 7224 | 5912 | 14 | 14 | 0.19% | 0.24% | 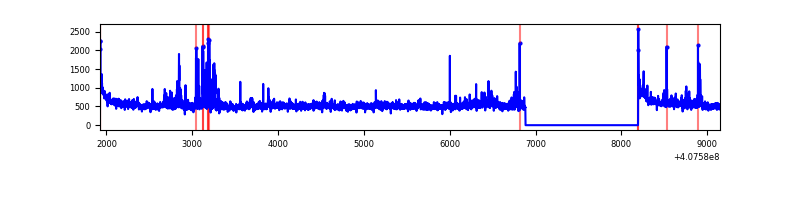 |
| B | 7224 | 5912 | 36 | 36 | 0.50% | 0.61% | 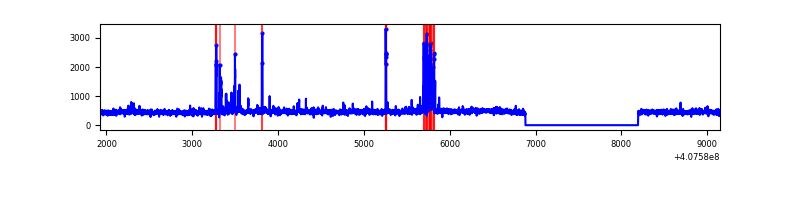 |
| C | 7224 | 5912 | 30 | 30 | 0.42% | 0.51% | 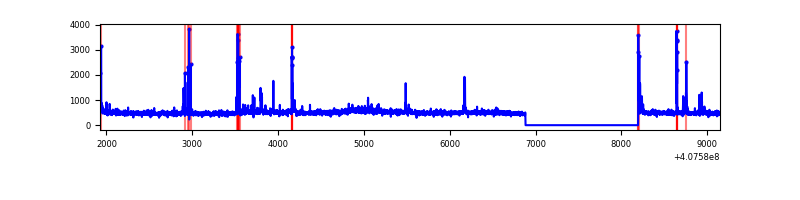 |
| D | 7224 | 5912 | 119 | 119 | 1.65% | 2.01% | 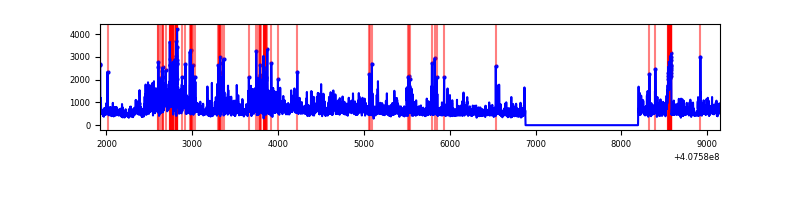 |
Top three noisy pixels from each quadrant. If the there are fewer than three noisy pixels in the level2.evt file, extra rows are filled as -1
| Pixel properties | Quadrant properties | ||||||
|---|---|---|---|---|---|---|---|
| Quadrant | DetID | PixID | Counts | Sigma | Mean | Median | Sigma |
| A | 10 | 83 | 438134 | 3181.91 | 667 | 652 | 137.5 |
| A | 13 | 248 | 137968 | 998.73 | 667 | 652 | 137.5 |
| A | 12 | 16 | 92564 | 668.5 | 667 | 652 | 137.5 |
| B | 5 | 184 | 149576 | 1146.86 | 662 | 644 | 129.9 |
| B | 5 | 200 | 68009 | 518.75 | 662 | 644 | 129.9 |
| B | 5 | 172 | 40318 | 305.51 | 662 | 644 | 129.9 |
| C | 15 | 214 | 261287 | 1712.48 | 649 | 652 | 152.2 |
| C | 15 | 208 | 123689 | 808.41 | 649 | 652 | 152.2 |
| C | 14 | 254 | 94651 | 617.61 | 649 | 652 | 152.2 |
| D | 12 | 235 | 545223 | 3385.52 | 647 | 629 | 160.9 |
| D | 2 | 16 | 537299 | 3336.26 | 647 | 629 | 160.9 |
| D | 5 | 222 | 407132 | 2527.06 | 647 | 629 | 160.9 |
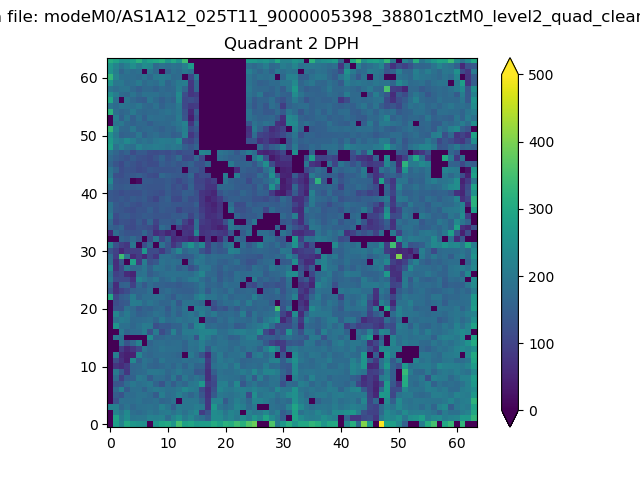
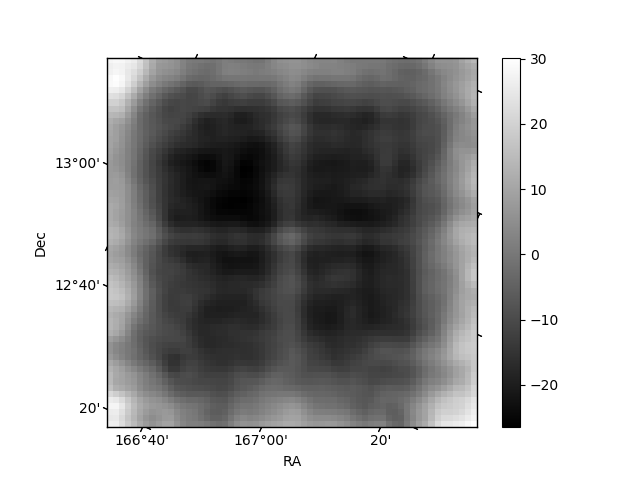
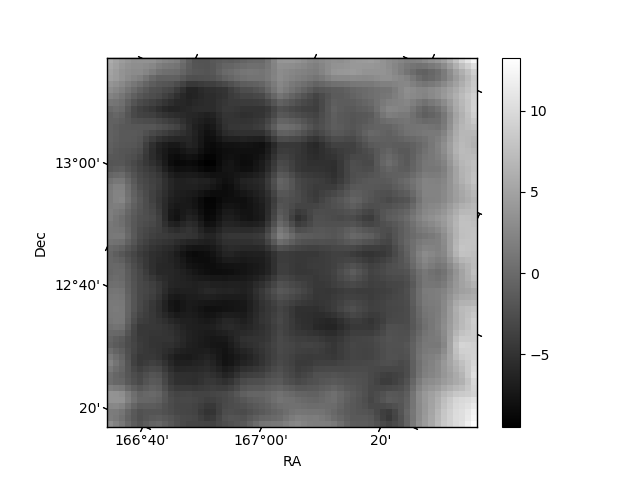
Histogram calculated using DETX and DETY for each event in the final _common_clean file
| Quadrant A | 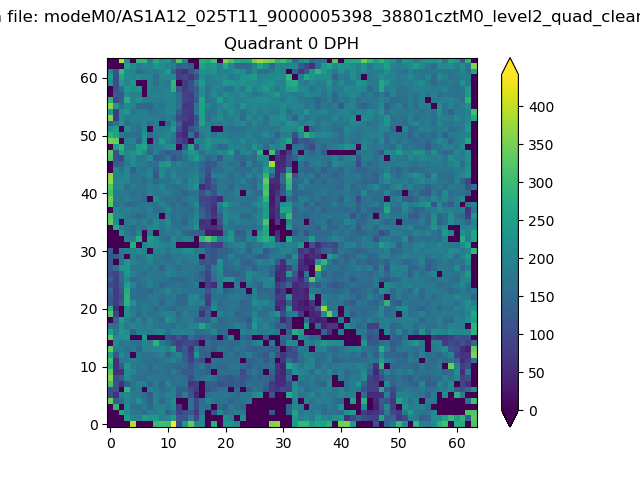 |
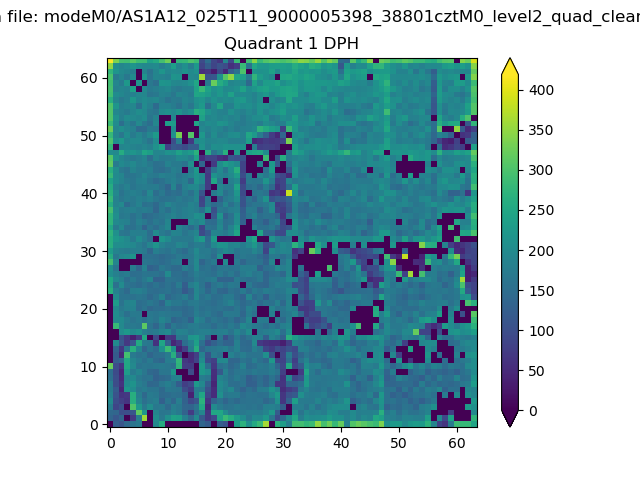 |
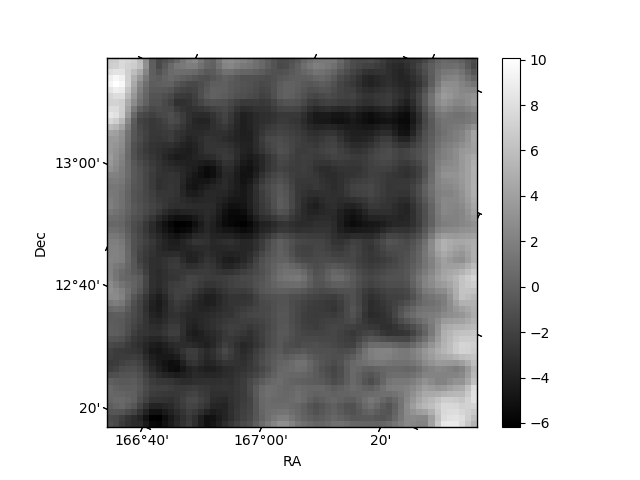
Quadrant B |
|---|---|---|---|
| Quadrant D | 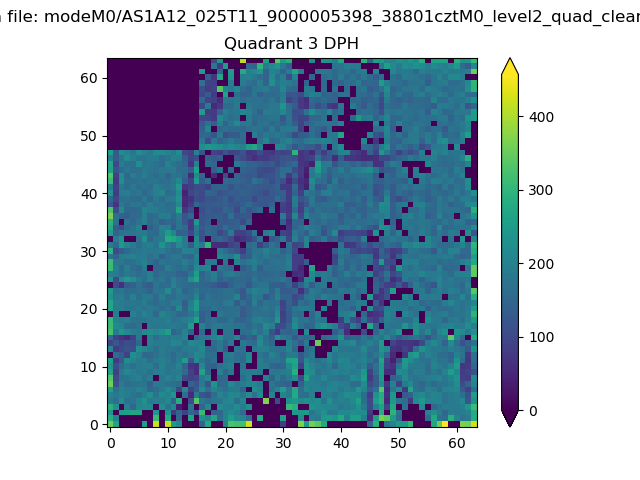 |
 |
Quadrant C |
| Plot type | Count rate plots | Images |
|---|---|---|
| Comparison with Poisson distribution Blue bars denote a histogram of data divided into 1 sec bins. Red curve is a Poisson curve with rate = median count rate of data. |
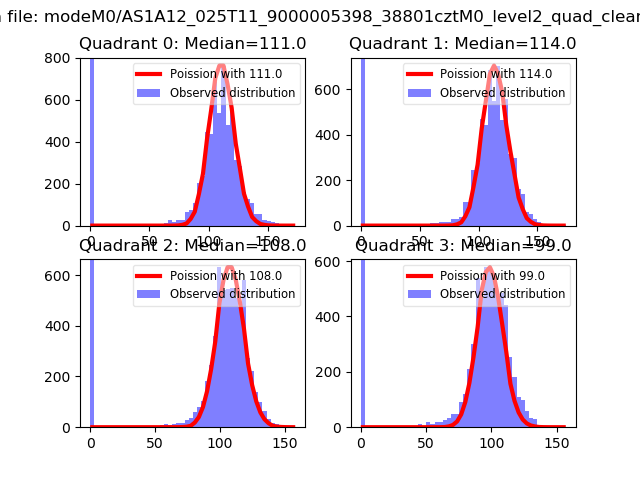 |
 |
| Quadrant-wise count rates Data is divided into 100 sec bins |
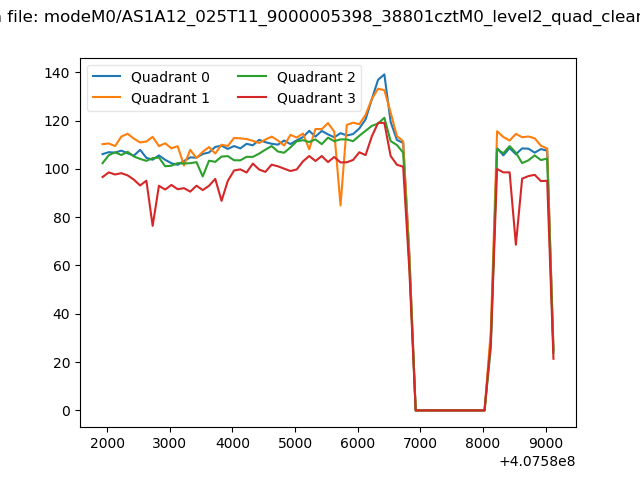 |
|
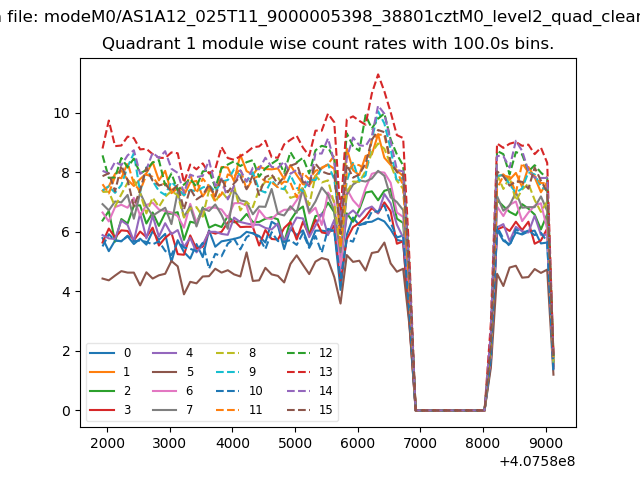
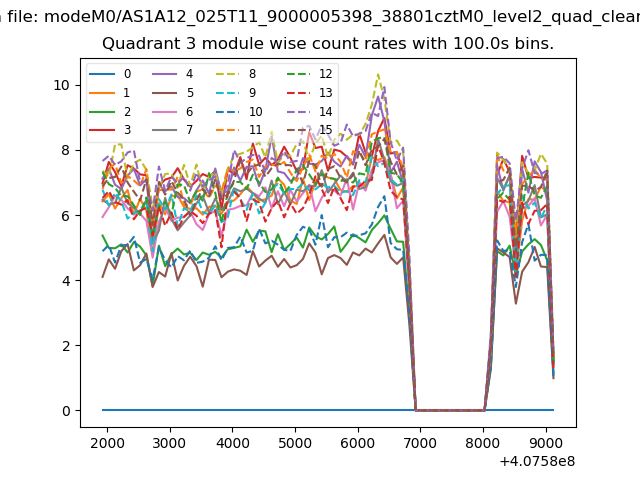
| Module-wise count rates for Quadrant A Data is divided into 100 sec bins |
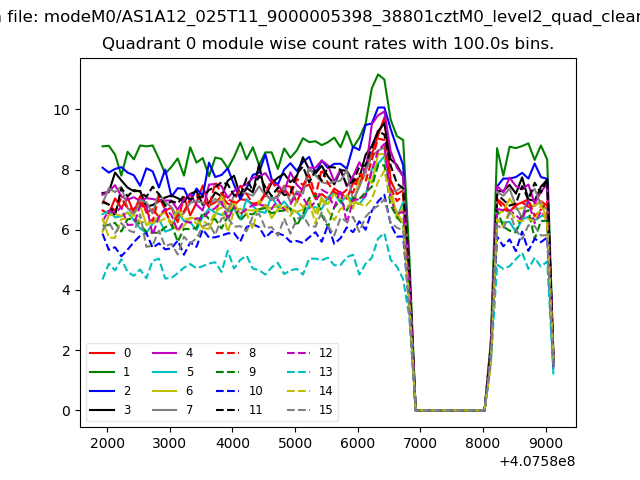 |
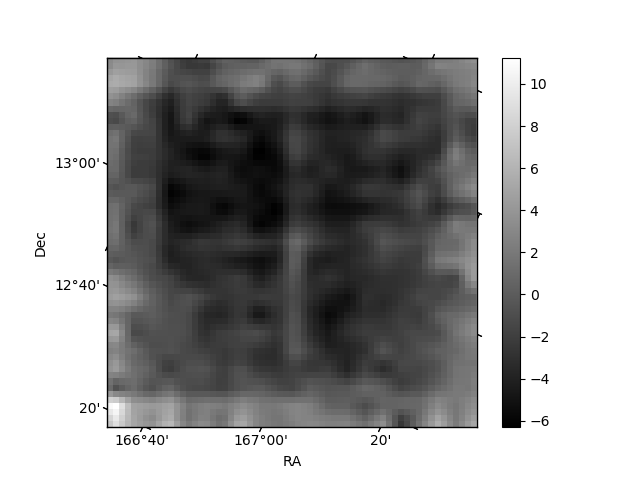 |
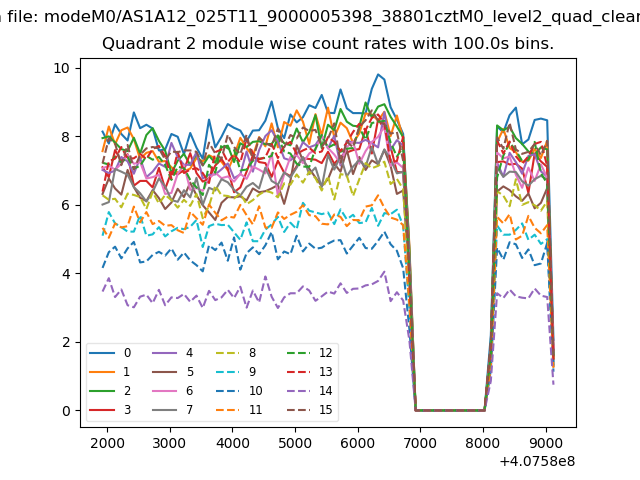
| Module-wise count rates for Quadrant B Data is divided into 100 sec bins |
 |
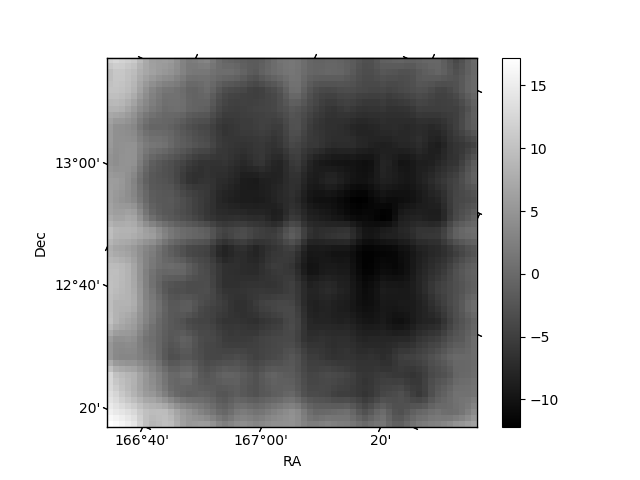 |
| Module-wise count rates for Quadrant C Data is divided into 100 sec bins |
 |
 |
| Module-wise count rates for Quadrant D Data is divided into 100 sec bins |
 |
 |
| Parameter | Plot |
|---|---|
| CZT HV Monitor | 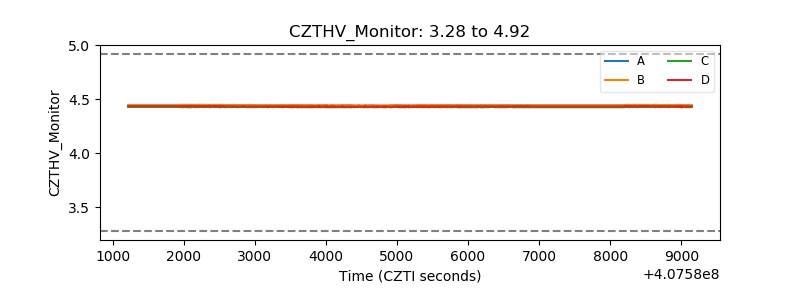 |
| D_VDD | 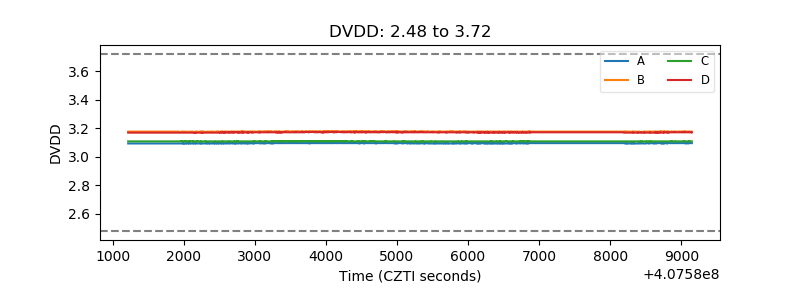 |
| Temperature 1 | 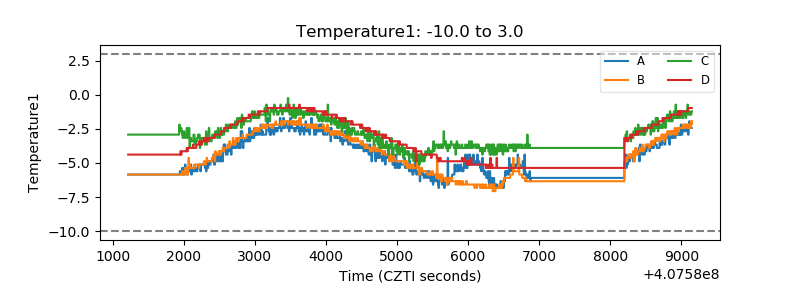 |
| Veto HV Monitor | 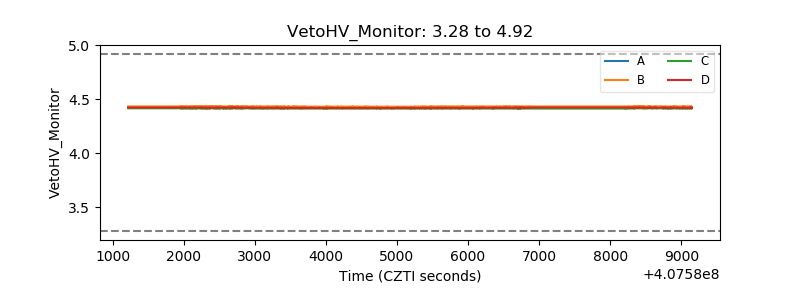 |
| Veto LLD | 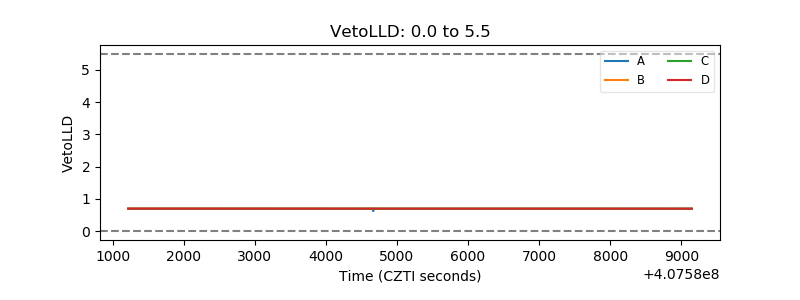 |
| Alpha Counter | 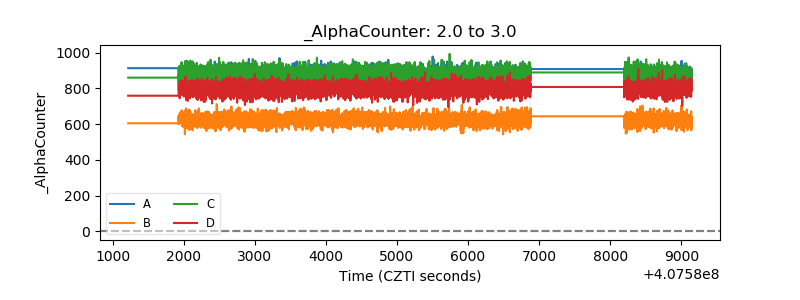 |
| _CPM_Rate | 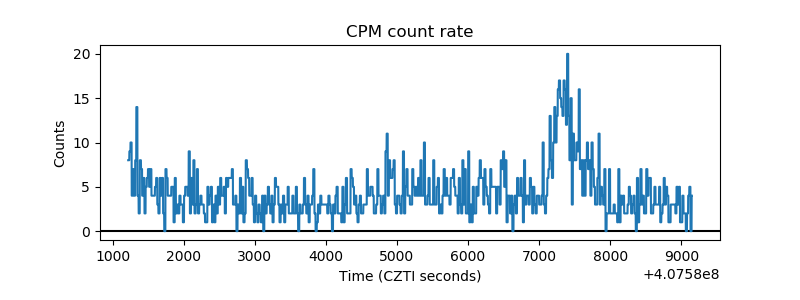 |
| CZT Counter | 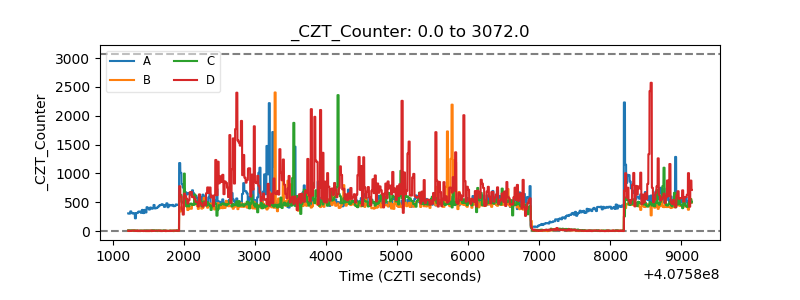 |
| +2.5 Volts monitor | 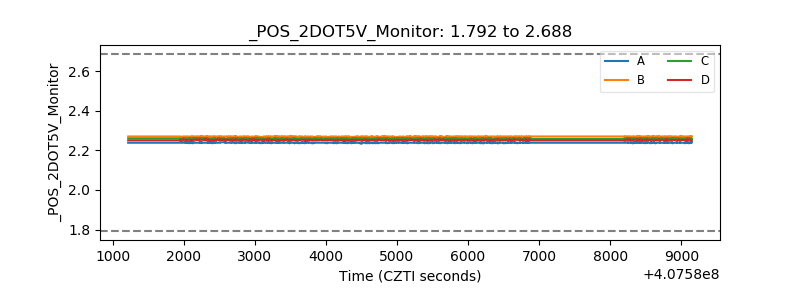 |
| +5 Volts monitor | 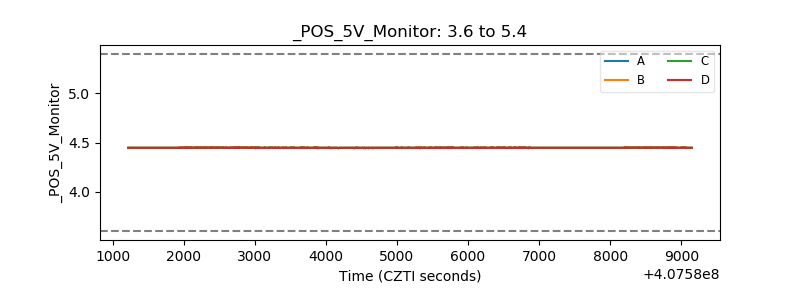 |
| _ROLL_ROT | 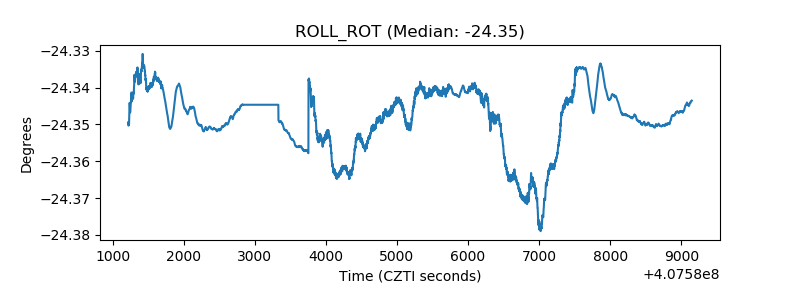 |
| _Roll_DEC | 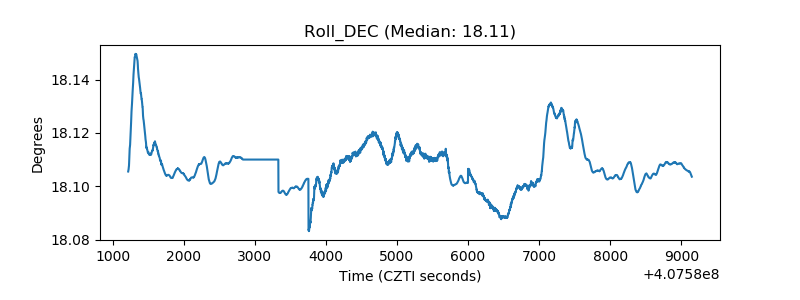 |
| _Roll_RA | 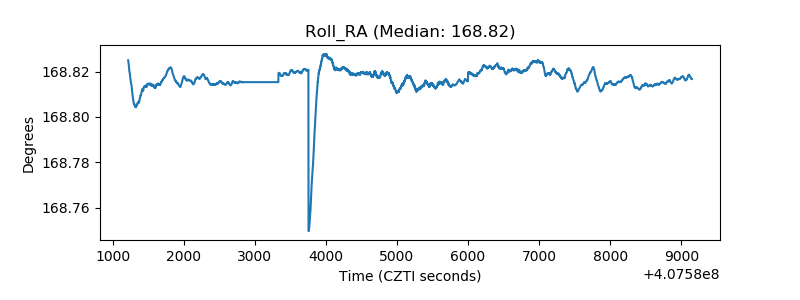 |
| Veto Counter | 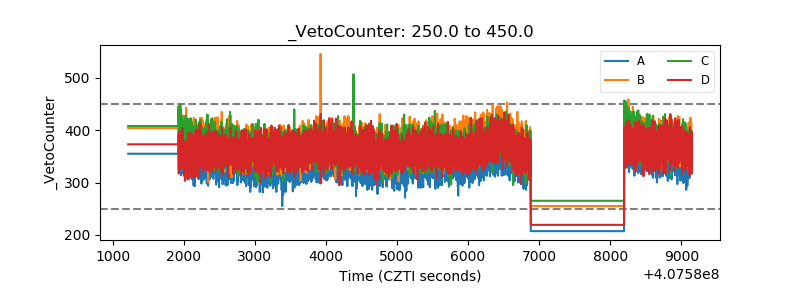 |