| Param | Original file | Final file |
|---|---|---|
| Filename | modeM0/AS1A12_025T11_9000005398_38803cztM0_level2.fits | modeM0/AS1A12_025T11_9000005398_38803cztM0_level2_quad_clean.evt |
| Size (bytes) | 756,794,880 | 174,657,600 |
| Size | 721.7 MB | 166.6 MB |
| Events in quadrant A | 6,495,044 | 1,178,700 |
| Events in quadrant B | 5,833,413 | 1,195,822 |
| Events in quadrant C | 5,347,939 | 1,155,778 |
| Events in quadrant D | 9,506,613 | 1,014,578 |
| Mode SS | |||
|---|---|---|---|
| Quadrant | BADHDUFLAG | Total packets | Discarded packets |
| A | 0 | 218 | 0 |
| B | 0 | 218 | 0 |
| C | 0 | 218 | 0 |
| D | 0 | 218 | 0 |
| Mode M0 | |||
|---|---|---|---|
| Quadrant | BADHDUFLAG | Total packets | Discarded packets |
| A | 0 | 25955 | 4 |
| B | 0 | 24370 | 3 |
| C | 0 | 22286 | 3 |
| D | 0 | 35788 | 3 |
| Mode M9 | |||
|---|---|---|---|
| Quadrant | BADHDUFLAG | Total packets | Discarded packets |
| A | 0 | 38 | 0 |
| B | 0 | 38 | 0 |
| C | 0 | 38 | 0 |
| D | 0 | 39 | 0 |
| Quadrant | Total seconds | Saturated seconds | Saturation percentage |
|---|---|---|---|
| A | 10735 | 69 | 0.642757% |
| B | 10735 | 232 | 2.161155% |
| C | 10735 | 27 | 0.251514% |
| D | 10735 | 696 | 6.483465% |
Noise dominated data is calculated using 1-second bins in cleaned event files. If a bin has >2000 counts, and if more than 50% of those come from <1% of pixels, then it is considered to be noise-dominated and hence unusable.
| Quadrant | # 1 sec bins | Bins with >0 counts | Bins with >2000 counts | High rate bins dominated by noise | Noise dominated (total time) | Noise dominated (detector-on time) | Marked lightcurve |
|---|---|---|---|---|---|---|---|
| A | 13572 | 10737 | 38 | 38 | 0.28% | 0.35% | 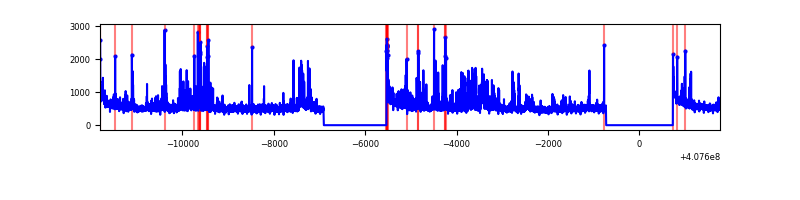 |
| B | 13572 | 10737 | 126 | 126 | 0.93% | 1.17% | 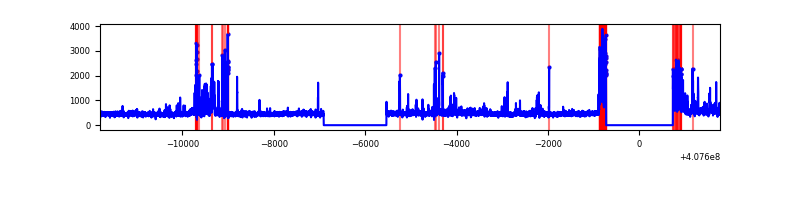 |
| C | 13572 | 10737 | 17 | 17 | 0.13% | 0.16% | 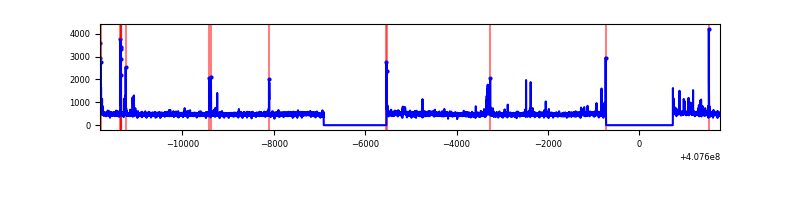 |
| D | 13572 | 10737 | 543 | 543 | 4.00% | 5.06% | 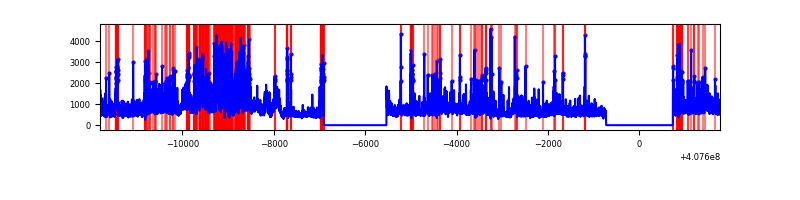 |
Top three noisy pixels from each quadrant. If the there are fewer than three noisy pixels in the level2.evt file, extra rows are filled as -1
| Pixel properties | Quadrant properties | ||||||
|---|---|---|---|---|---|---|---|
| Quadrant | DetID | PixID | Counts | Sigma | Mean | Median | Sigma |
| A | 10 | 83 | 762790 | 3081.58 | 1216 | 1189 | 247.1 |
| A | 12 | 16 | 453304 | 1829.34 | 1216 | 1189 | 247.1 |
| A | 13 | 248 | 408664 | 1648.72 | 1216 | 1189 | 247.1 |
| B | 5 | 184 | 575977 | 2474.09 | 1203 | 1171 | 232.3 |
| B | 5 | 200 | 308684 | 1323.6 | 1203 | 1171 | 232.3 |
| B | 0 | 230 | 90825 | 385.89 | 1203 | 1171 | 232.3 |
| C | 15 | 214 | 466933 | 1675.92 | 1187 | 1197 | 277.9 |
| C | 1 | 23 | 88806 | 315.26 | 1187 | 1197 | 277.9 |
| C | 0 | 10 | 51901 | 182.45 | 1187 | 1197 | 277.9 |
| D | 12 | 235 | 1696268 | 5975.59 | 1163 | 1130 | 283.7 |
| D | 2 | 16 | 909338 | 3201.55 | 1163 | 1130 | 283.7 |
| D | 2 | 153 | 757128 | 2664.99 | 1163 | 1130 | 283.7 |
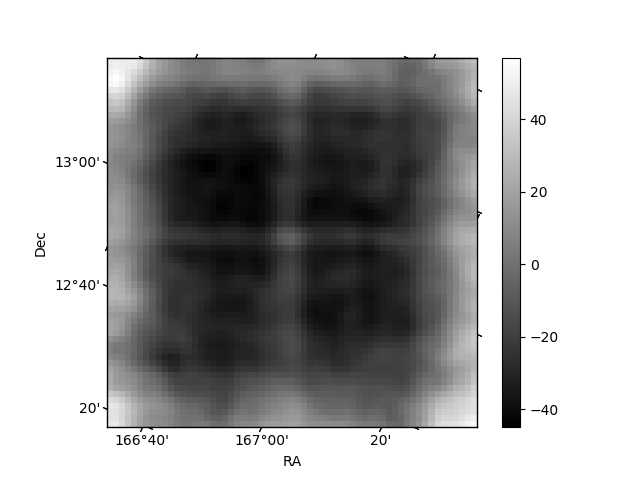
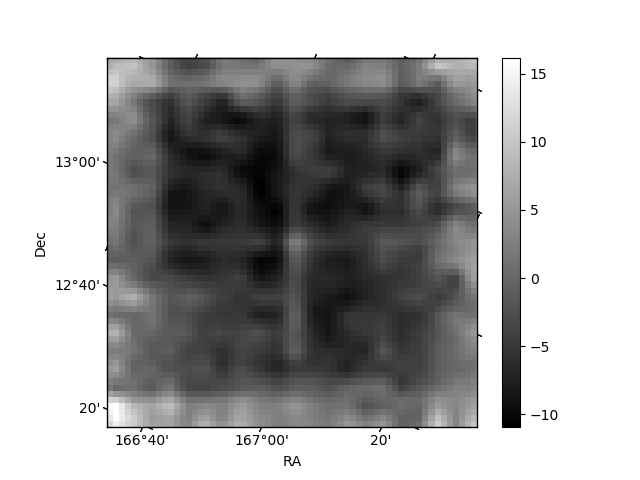
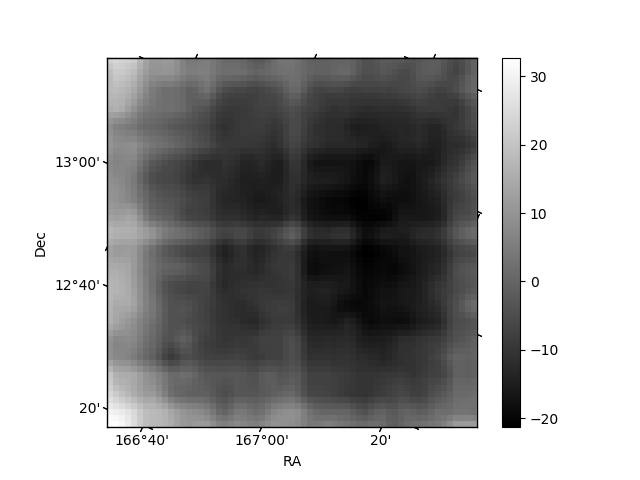
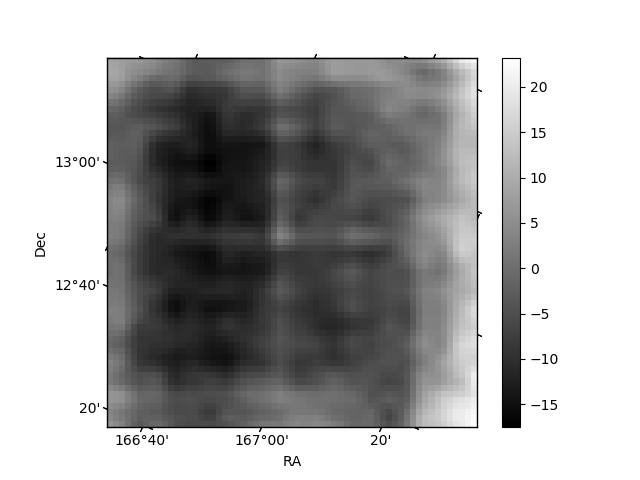
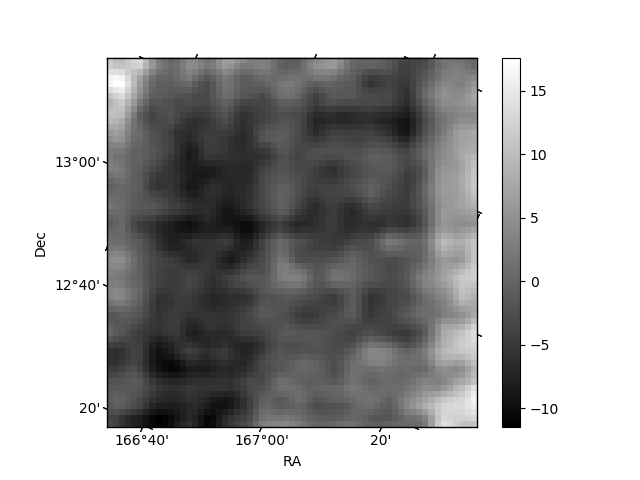
Histogram calculated using DETX and DETY for each event in the final _common_clean file
| Quadrant A | 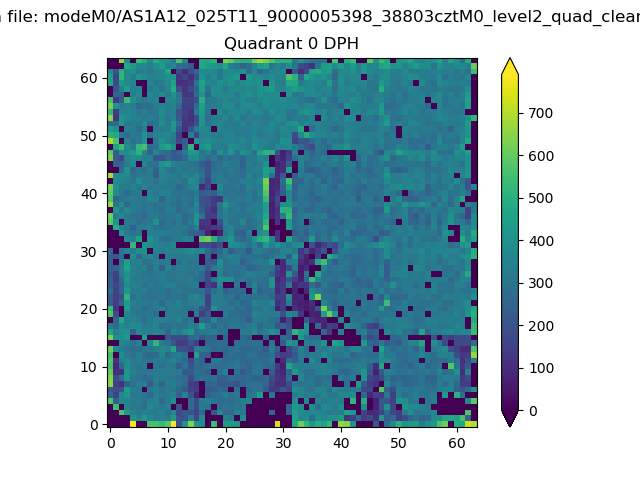 |
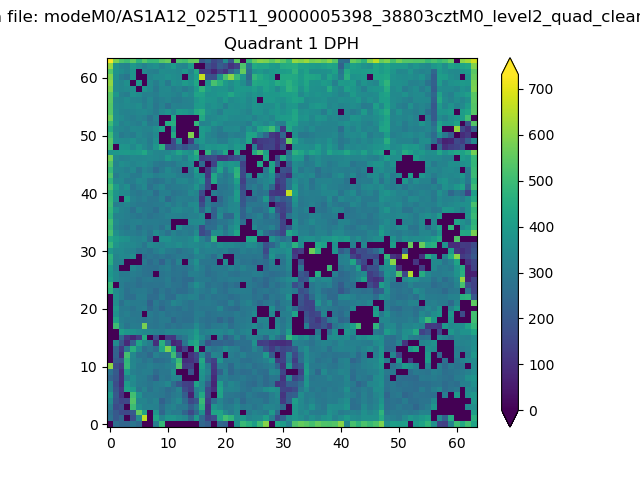 |
Quadrant B |
|---|---|---|---|
| Quadrant D | 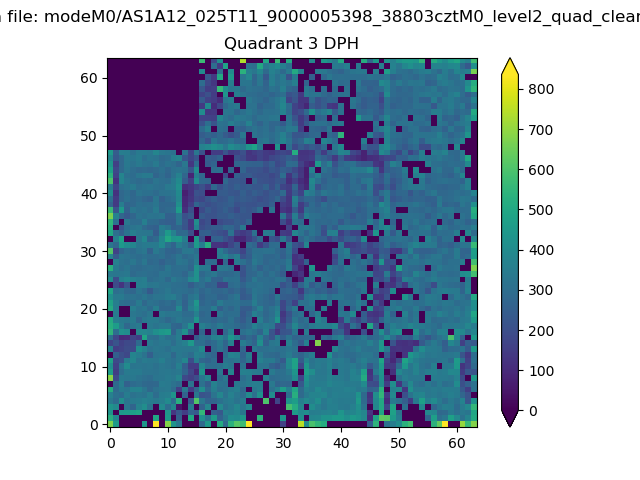 |
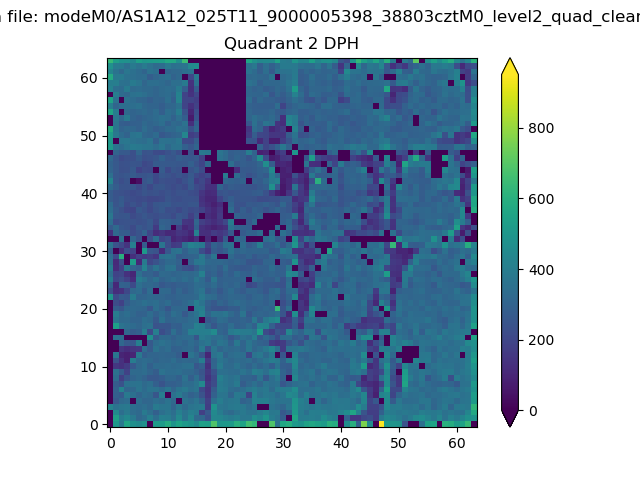 |
Quadrant C |
| Plot type | Count rate plots | Images |
|---|---|---|
| Comparison with Poisson distribution Blue bars denote a histogram of data divided into 1 sec bins. Red curve is a Poisson curve with rate = median count rate of data. |
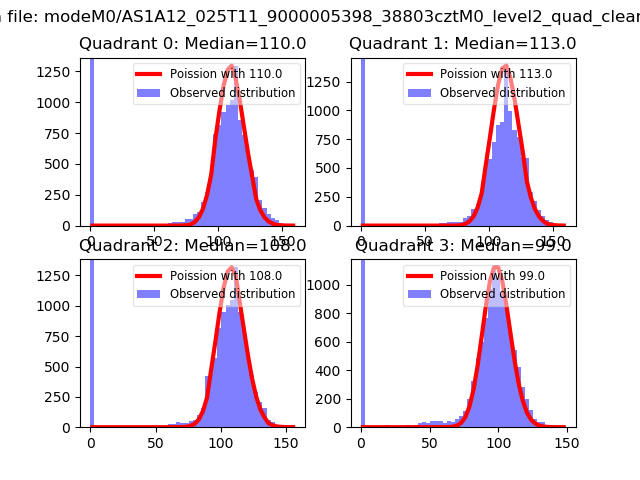 |
 |
| Quadrant-wise count rates Data is divided into 100 sec bins |
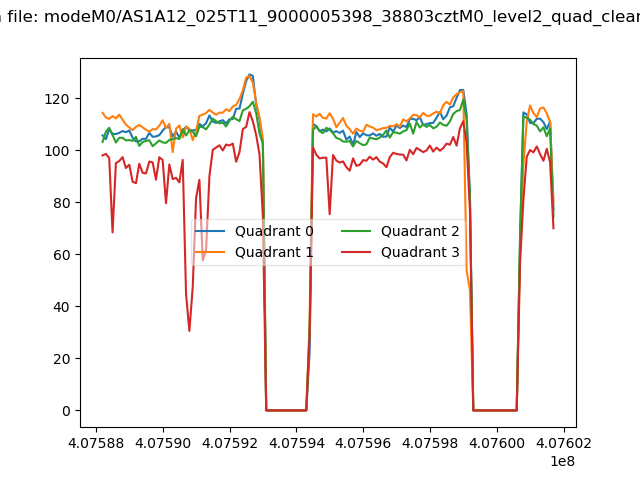 |
|
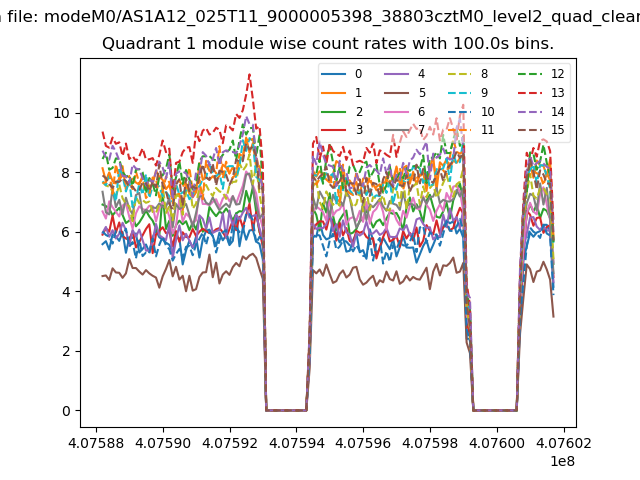
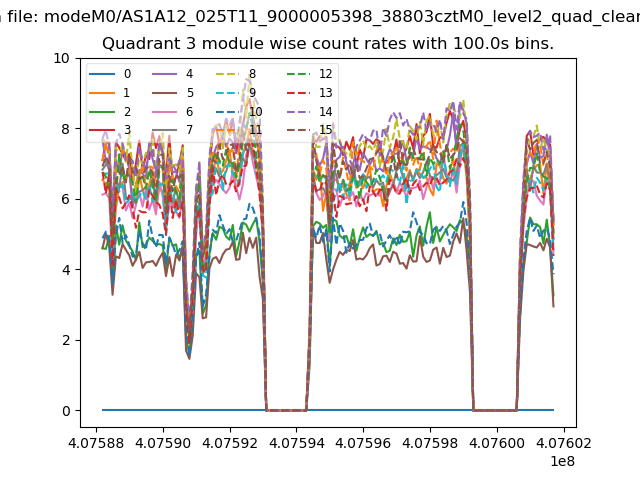
| Module-wise count rates for Quadrant A Data is divided into 100 sec bins |
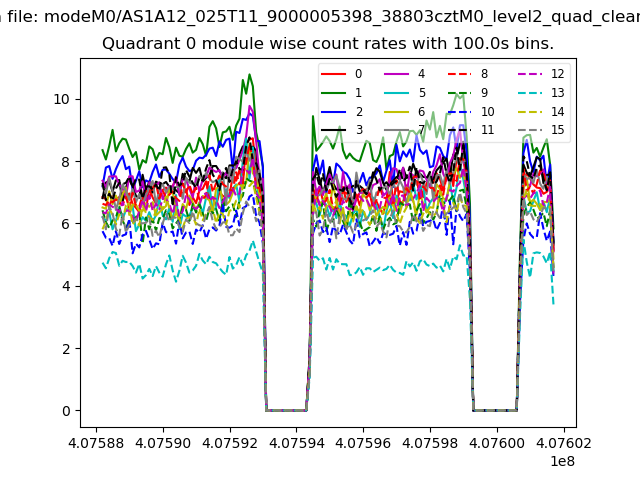 |
 |
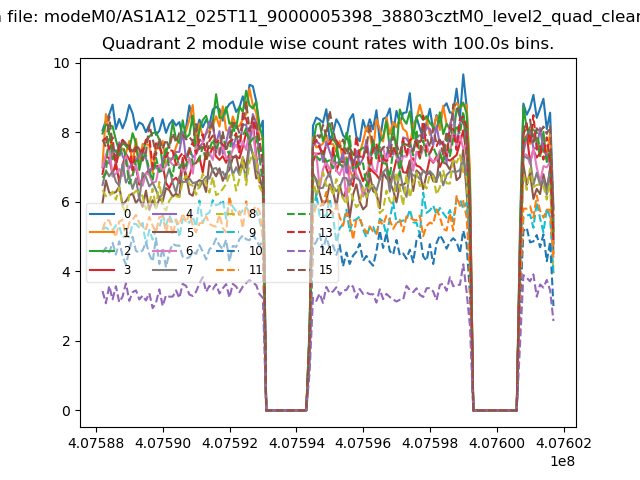
| Module-wise count rates for Quadrant B Data is divided into 100 sec bins |
 |
 |
| Module-wise count rates for Quadrant C Data is divided into 100 sec bins |
 |
 |
| Module-wise count rates for Quadrant D Data is divided into 100 sec bins |
 |
 |
| Parameter | Plot |
|---|---|
| CZT HV Monitor | 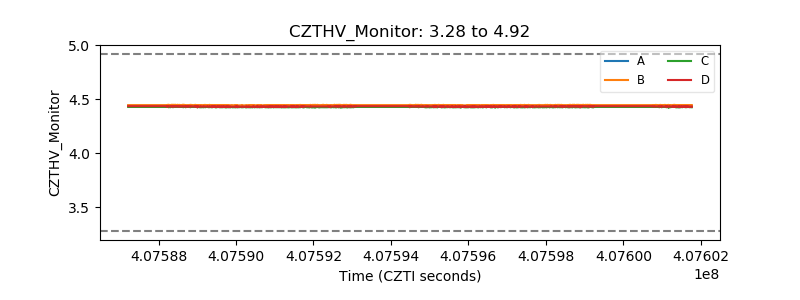 |
| D_VDD | 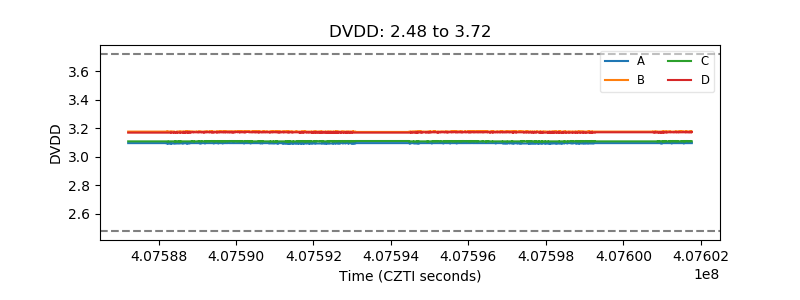 |
| Temperature 1 | 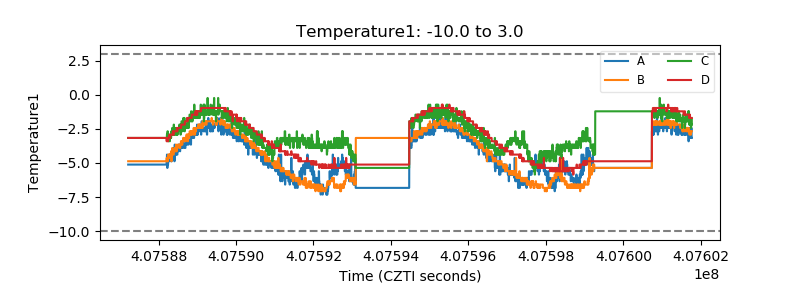 |
| Veto HV Monitor | 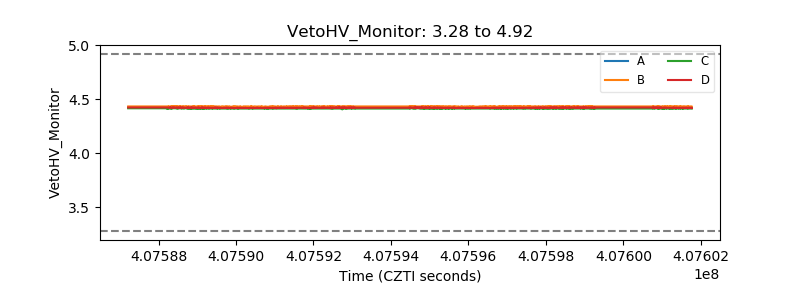 |
| Veto LLD | 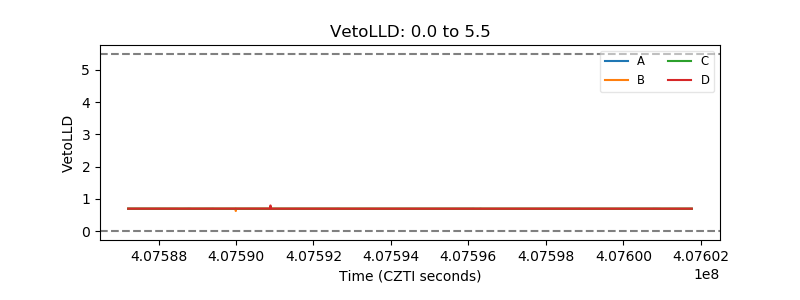 |
| Alpha Counter | 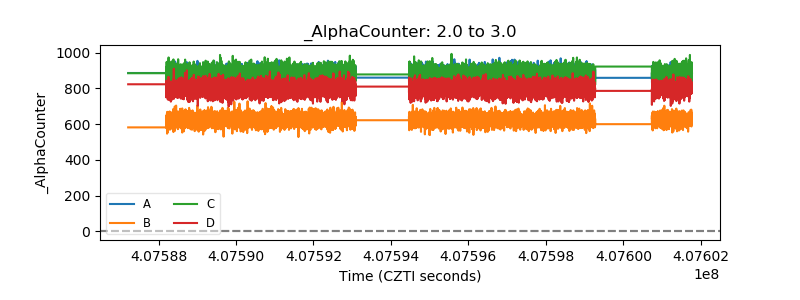 |
| _CPM_Rate | 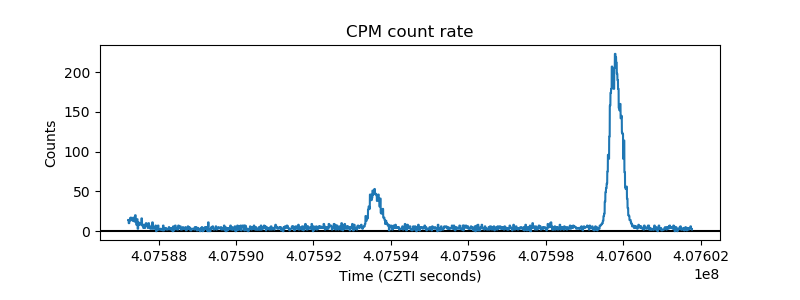 |
| CZT Counter | 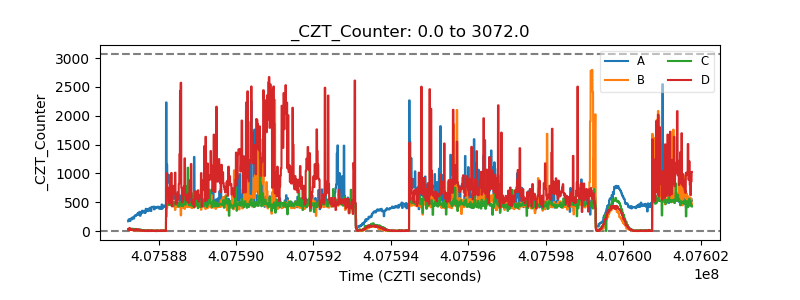 |
| +2.5 Volts monitor | 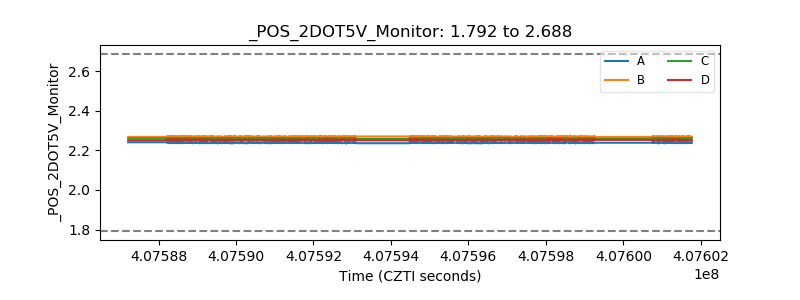 |
| +5 Volts monitor | 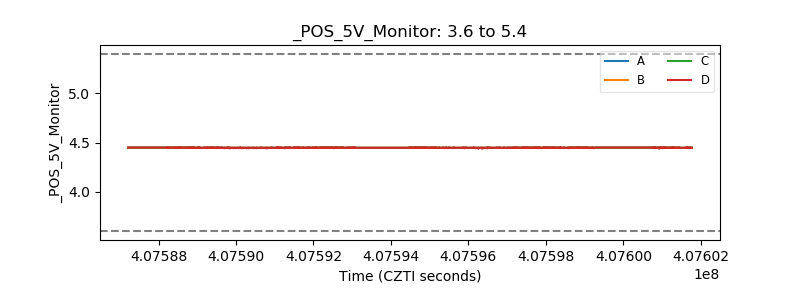 |
| _ROLL_ROT | 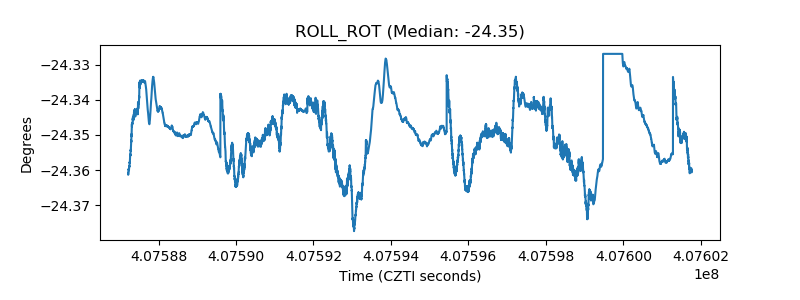 |
| _Roll_DEC | 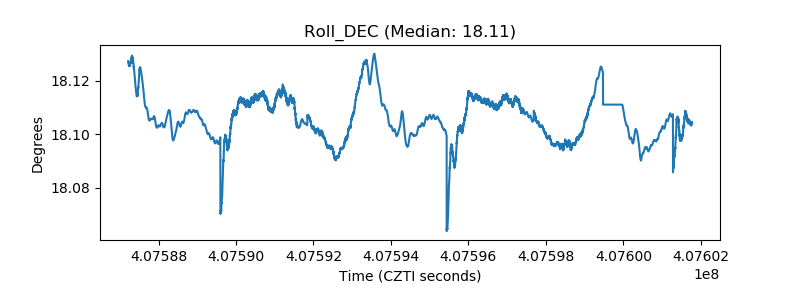 |
| _Roll_RA | 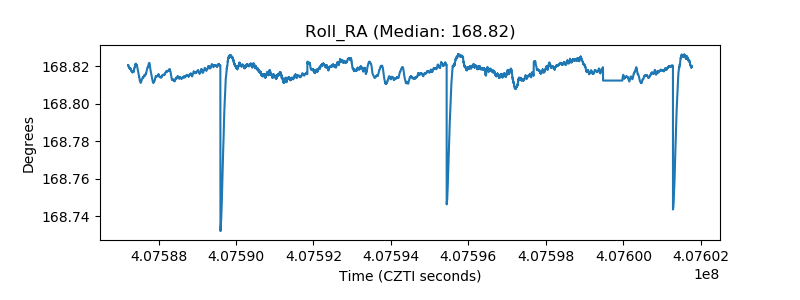 |
| Veto Counter | 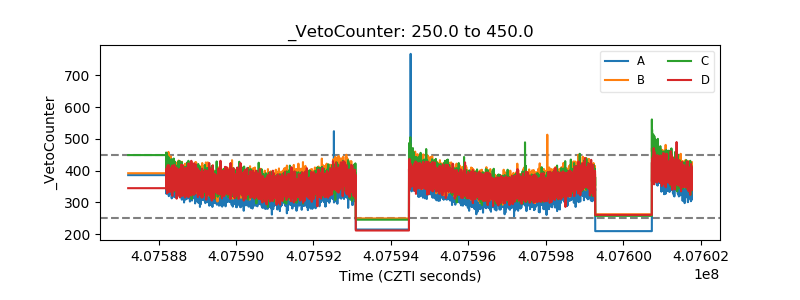 |