| Param | Original file | Final file |
|---|---|---|
| Filename | modeM0/AS1A12_025T11_9000005398_38804cztM0_level2.fits | modeM0/AS1A12_025T11_9000005398_38804cztM0_level2_quad_clean.evt |
| Size (bytes) | 174,925,440 | 40,890,240 |
| Size | 166.8 MB | 39.0 MB |
| Events in quadrant A | 1,423,978 | 274,142 |
| Events in quadrant B | 1,461,702 | 276,020 |
| Events in quadrant C | 1,272,541 | 266,812 |
| Events in quadrant D | 2,121,858 | 242,794 |
| Mode SS | |||
|---|---|---|---|
| Quadrant | BADHDUFLAG | Total packets | Discarded packets |
| A | 0 | 50 | 0 |
| B | 0 | 50 | 0 |
| C | 0 | 50 | 0 |
| D | 0 | 50 | 0 |
| Mode M0 | |||
|---|---|---|---|
| Quadrant | BADHDUFLAG | Total packets | Discarded packets |
| A | 0 | 5741 | 1 |
| B | 0 | 6017 | 1 |
| C | 0 | 5276 | 1 |
| D | 0 | 8048 | 1 |
| Mode M9 | |||
|---|---|---|---|
| Quadrant | BADHDUFLAG | Total packets | Discarded packets |
| A | 0 | 7 | 0 |
| B | 0 | 7 | 0 |
| C | 0 | 7 | 0 |
| D | 0 | 8 | 0 |
| Quadrant | Total seconds | Saturated seconds | Saturation percentage |
|---|---|---|---|
| A | 2483 | 10 | 0.402739% |
| B | 2483 | 69 | 2.778896% |
| C | 2483 | 9 | 0.362465% |
| D | 2483 | 88 | 3.544100% |
Noise dominated data is calculated using 1-second bins in cleaned event files. If a bin has >2000 counts, and if more than 50% of those come from <1% of pixels, then it is considered to be noise-dominated and hence unusable.
| Quadrant | # 1 sec bins | Bins with >0 counts | Bins with >2000 counts | High rate bins dominated by noise | Noise dominated (total time) | Noise dominated (detector-on time) | Marked lightcurve |
|---|---|---|---|---|---|---|---|
| A | 2483 | 2483 | 5 | 5 | 0.20% | 0.20% | 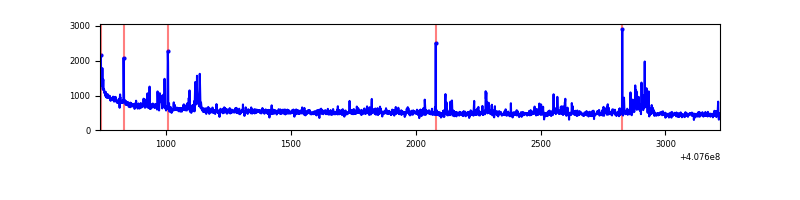 |
| B | 2483 | 2483 | 19 | 19 | 0.77% | 0.77% | 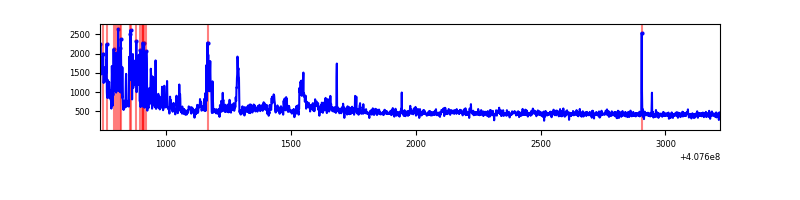 |
| C | 2483 | 2483 | 3 | 3 | 0.12% | 0.12% | 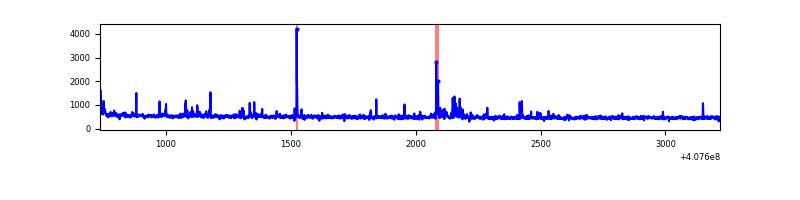 |
| D | 2483 | 2483 | 59 | 59 | 2.38% | 2.38% | 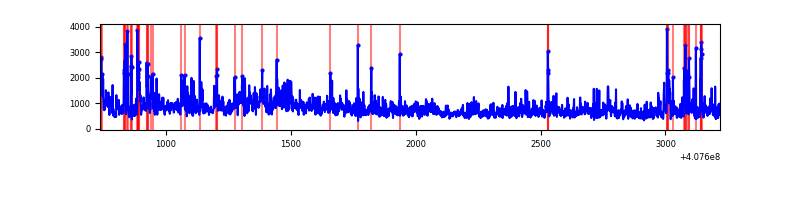 |
Top three noisy pixels from each quadrant. If the there are fewer than three noisy pixels in the level2.evt file, extra rows are filled as -1
| Pixel properties | Quadrant properties | ||||||
|---|---|---|---|---|---|---|---|
| Quadrant | DetID | PixID | Counts | Sigma | Mean | Median | Sigma |
| A | 10 | 83 | 211018 | 3548.65 | 283 | 276 | 59.4 |
| A | 13 | 248 | 90103 | 1512.58 | 283 | 276 | 59.4 |
| A | 9 | 143 | 14740 | 243.56 | 283 | 276 | 59.4 |
| B | 5 | 184 | 218914 | 3907.17 | 279 | 271 | 56.0 |
| B | 0 | 230 | 66112 | 1176.59 | 279 | 271 | 56.0 |
| B | 15 | 85 | 37070 | 657.6 | 279 | 271 | 56.0 |
| C | 15 | 214 | 108953 | 1634.4 | 277 | 278 | 66.5 |
| C | 1 | 23 | 70162 | 1051.01 | 277 | 278 | 66.5 |
| C | 0 | 10 | 7527 | 109.02 | 277 | 278 | 66.5 |
| D | 2 | 16 | 315747 | 4586.61 | 274 | 266 | 68.8 |
| D | 12 | 235 | 312775 | 4543.4 | 274 | 266 | 68.8 |
| D | 10 | 118 | 160433 | 2328.58 | 274 | 266 | 68.8 |
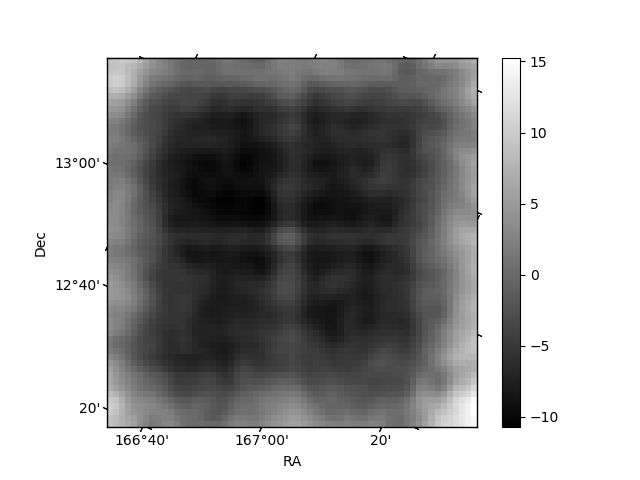
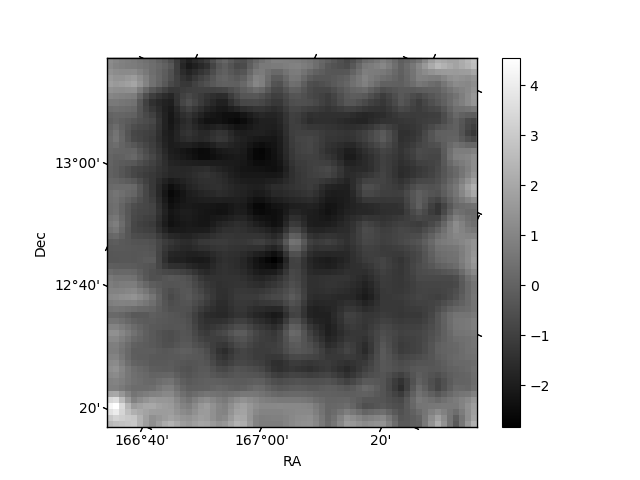
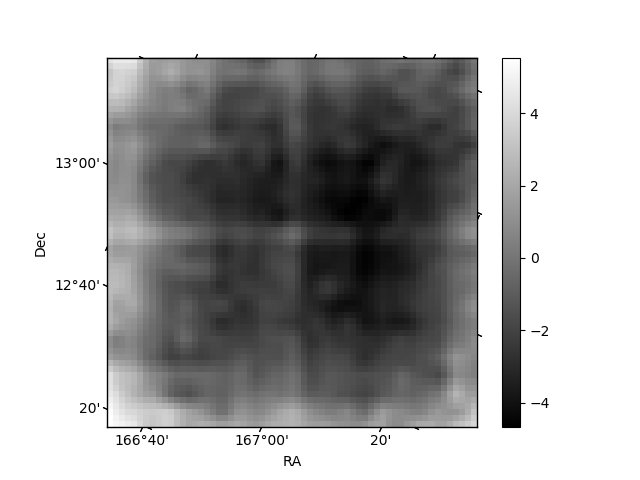
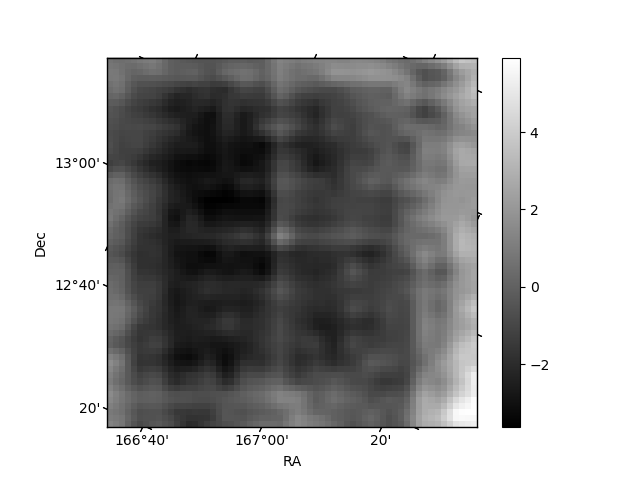
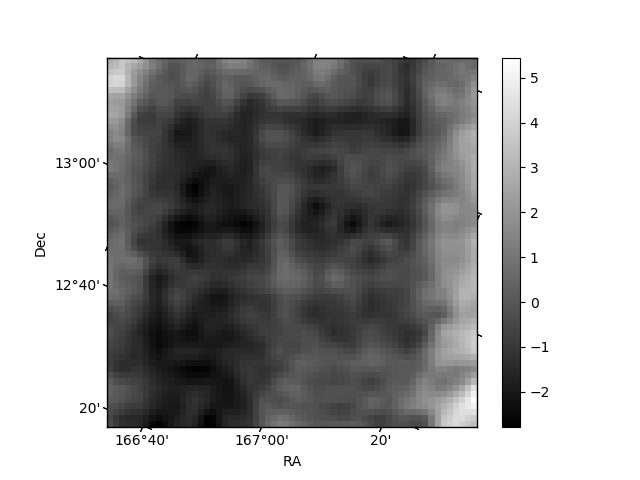
Histogram calculated using DETX and DETY for each event in the final _common_clean file
| Quadrant A | 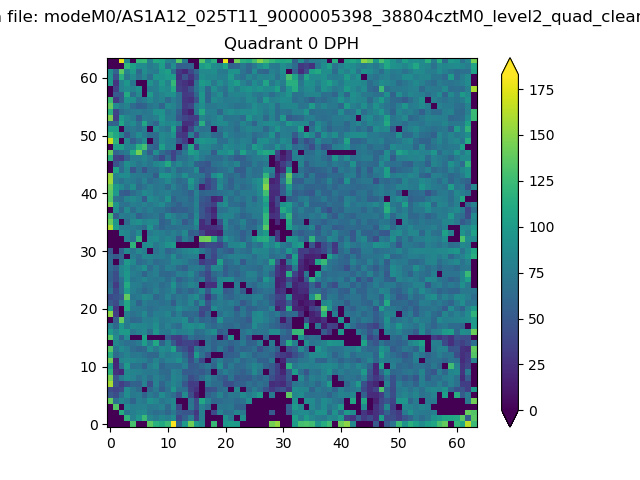 |
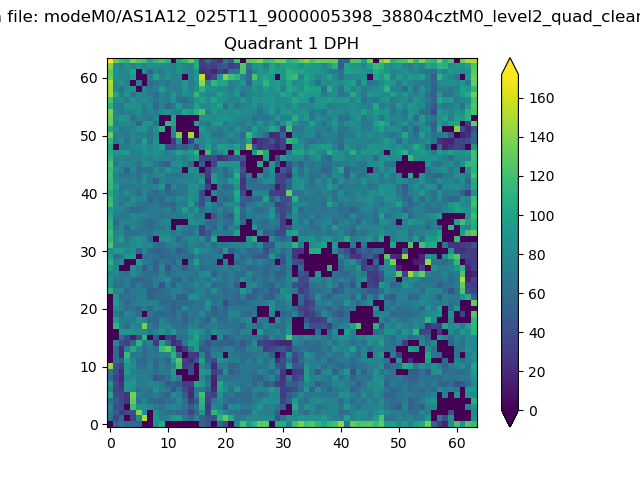 |
Quadrant B |
|---|---|---|---|
| Quadrant D | 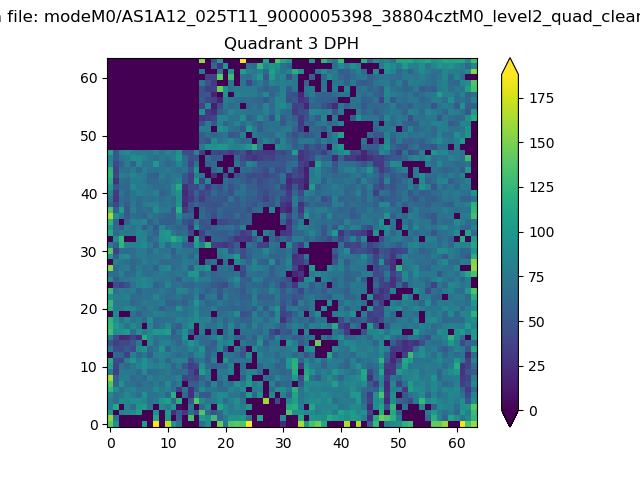 |
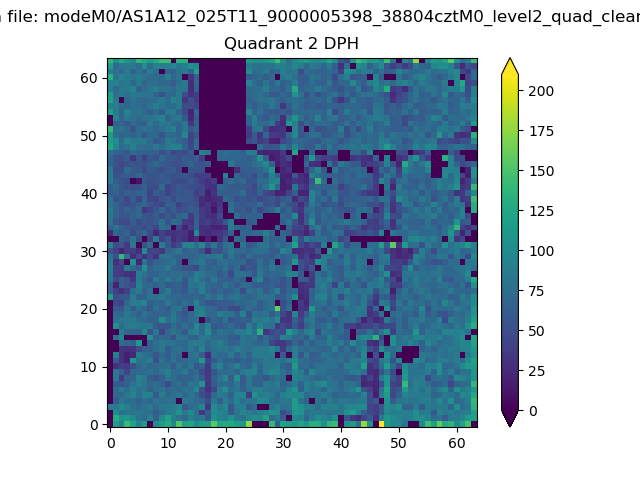 |
Quadrant C |
| Plot type | Count rate plots | Images |
|---|---|---|
| Comparison with Poisson distribution Blue bars denote a histogram of data divided into 1 sec bins. Red curve is a Poisson curve with rate = median count rate of data. |
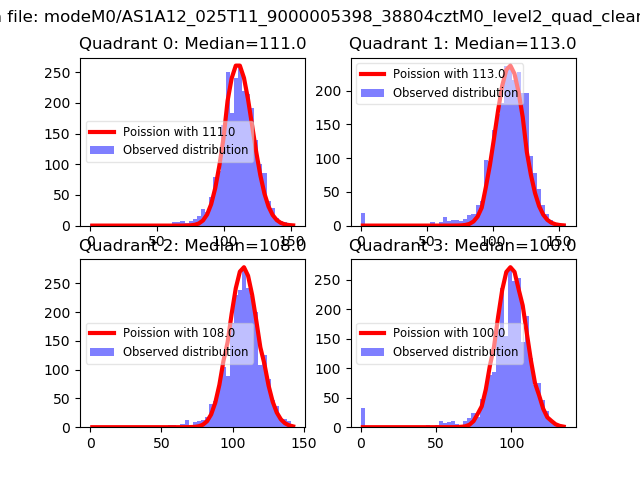 |
 |
| Quadrant-wise count rates Data is divided into 100 sec bins |
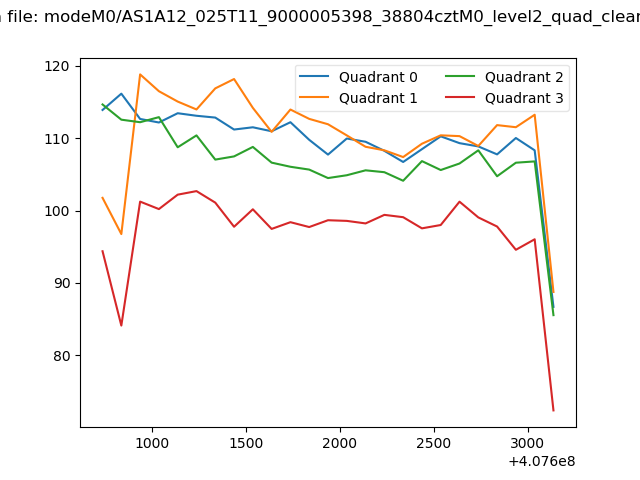 |
|
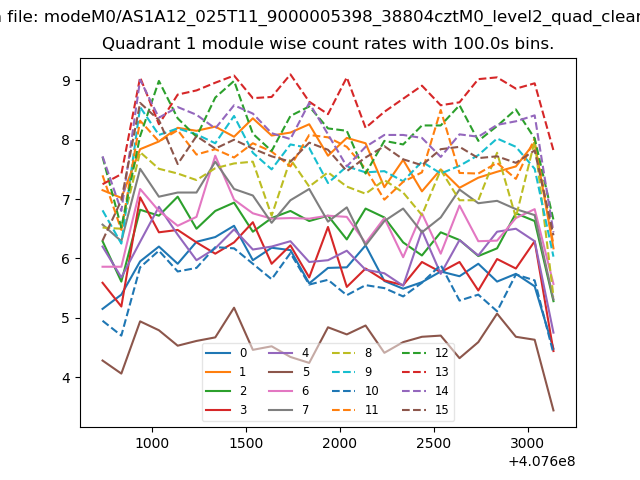
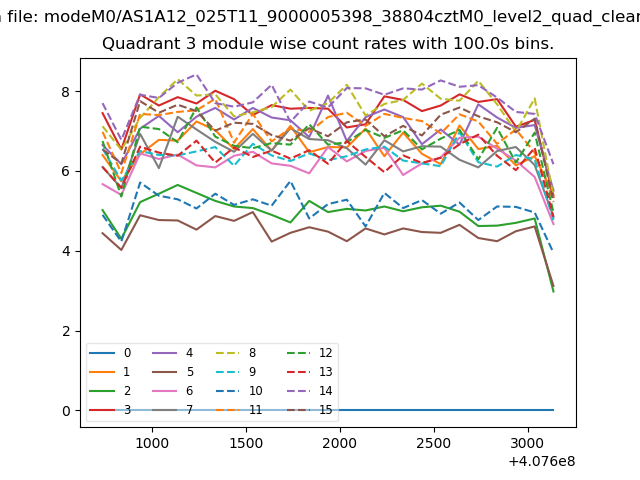
| Module-wise count rates for Quadrant A Data is divided into 100 sec bins |
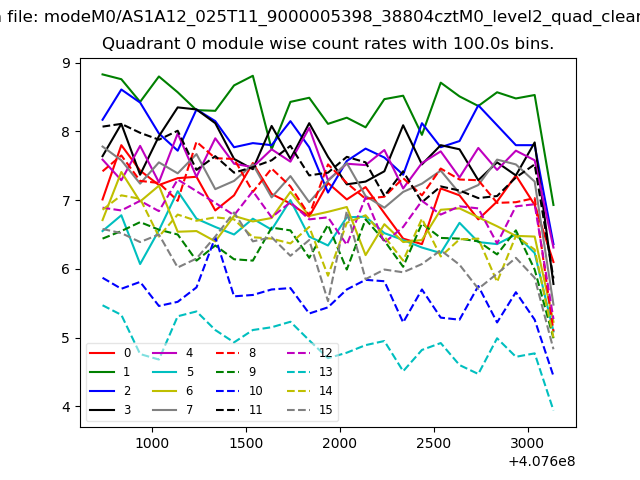 |
 |
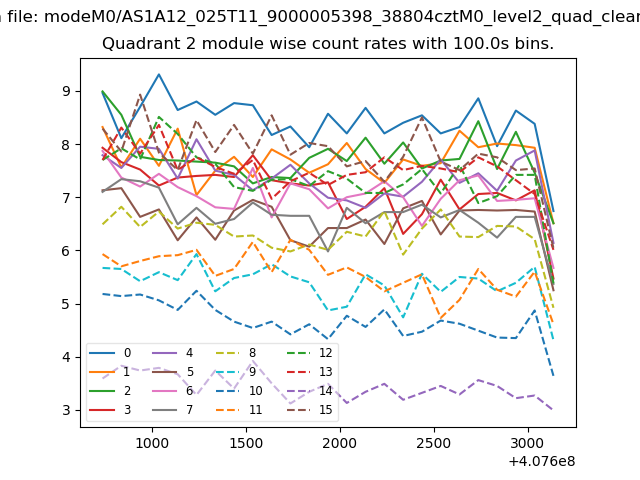
| Module-wise count rates for Quadrant B Data is divided into 100 sec bins |
 |
 |
| Module-wise count rates for Quadrant C Data is divided into 100 sec bins |
 |
 |
| Module-wise count rates for Quadrant D Data is divided into 100 sec bins |
 |
 |
| Parameter | Plot |
|---|---|
| CZT HV Monitor | 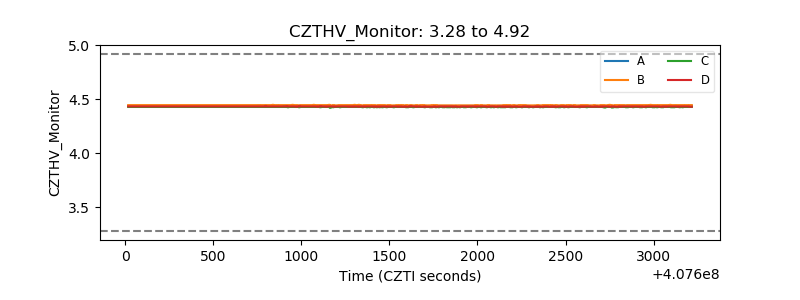 |
| D_VDD | 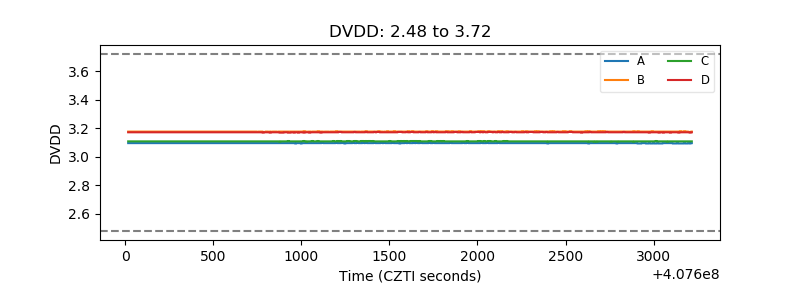 |
| Temperature 1 | 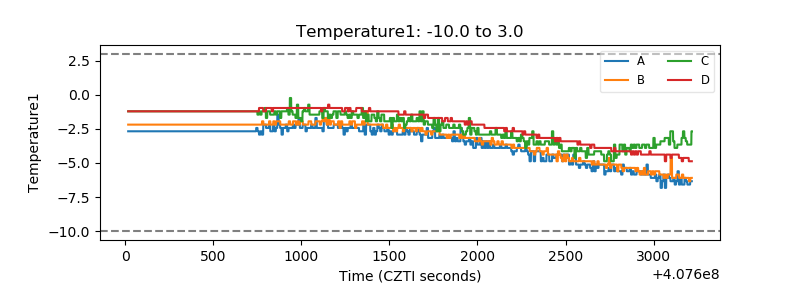 |
| Veto HV Monitor | 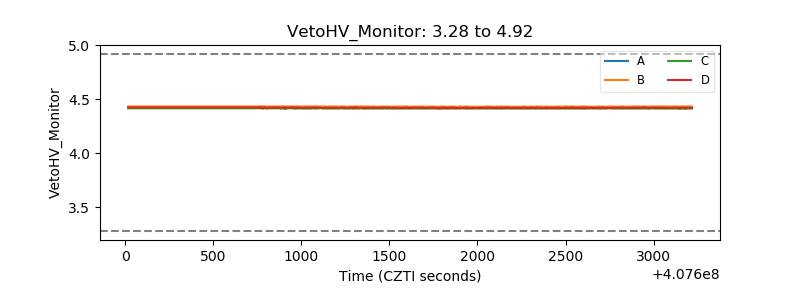 |
| Veto LLD | 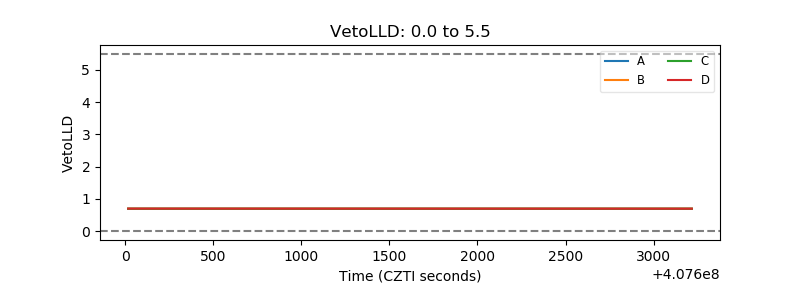 |
| Alpha Counter | 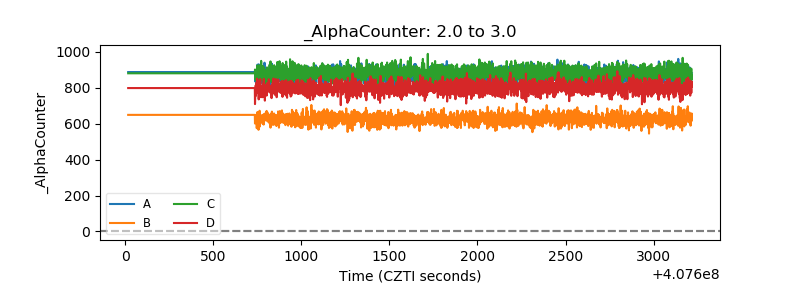 |
| _CPM_Rate | 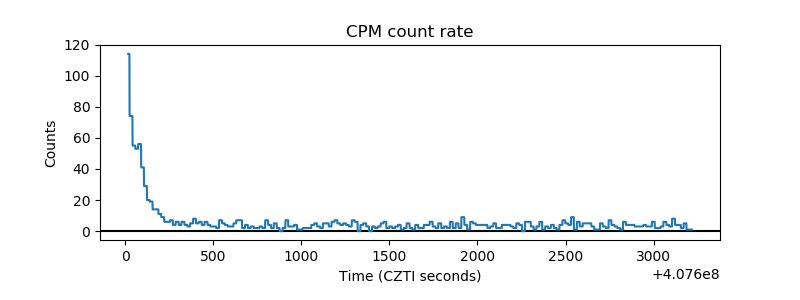 |
| CZT Counter | 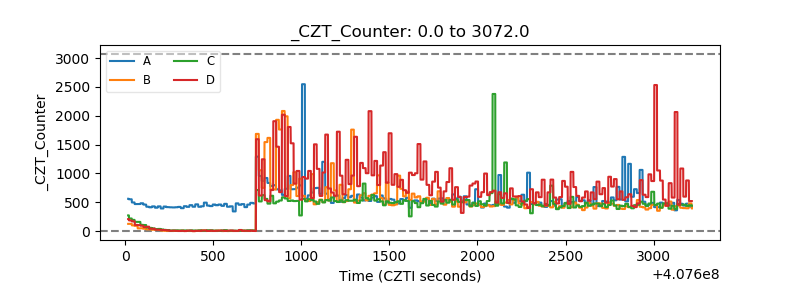 |
| +2.5 Volts monitor |  |
| +5 Volts monitor | 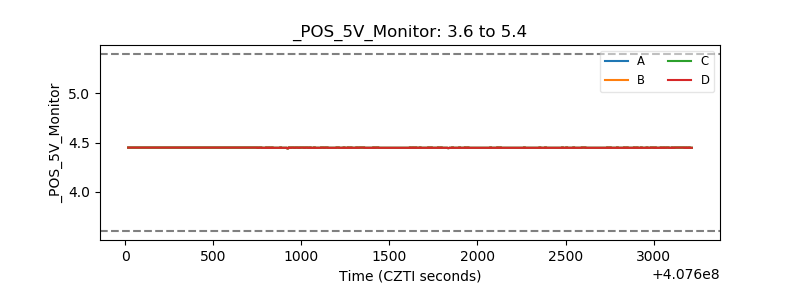 |
| _ROLL_ROT | 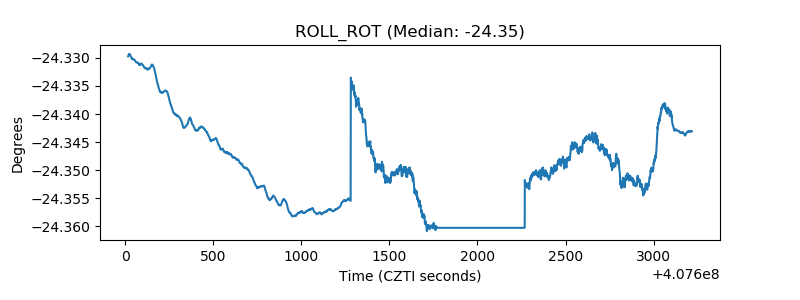 |
| _Roll_DEC | 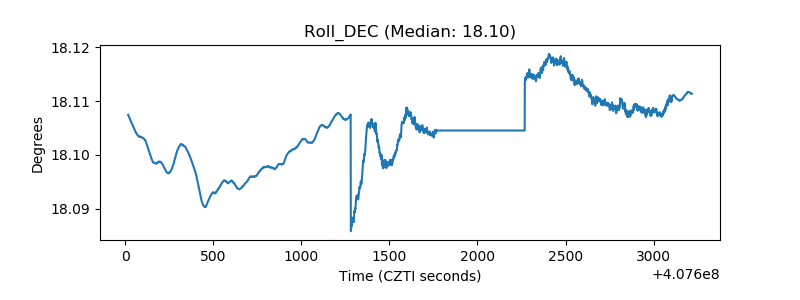 |
| _Roll_RA | 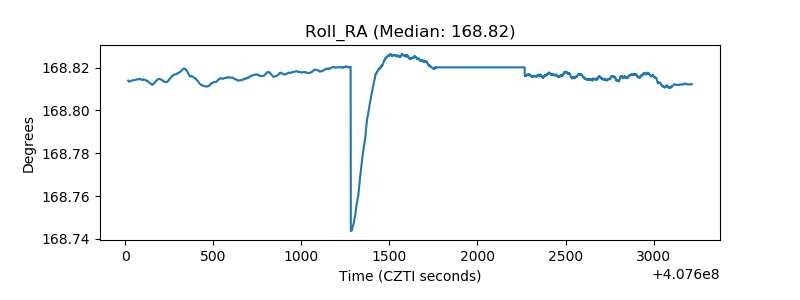 |
| Veto Counter | 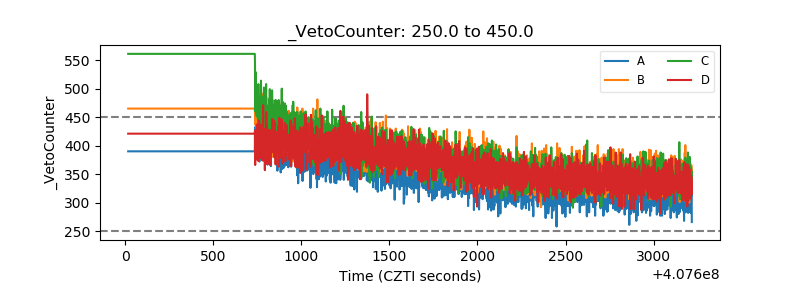 |