| Param | Original file | Final file |
|---|---|---|
| Filename | modeM0/AS1A12_025T17_9000005400_38804cztM0_level2.fits | modeM0/AS1A12_025T17_9000005400_38804cztM0_level2_quad_clean.evt |
| Size (bytes) | 124,488,000 | 29,643,840 |
| Size | 118.7 MB | 28.3 MB |
| Events in quadrant A | 1,082,727 | 198,815 |
| Events in quadrant B | 825,411 | 204,210 |
| Events in quadrant C | 918,116 | 193,615 |
| Events in quadrant D | 1,649,999 | 178,708 |
| Mode M9 | |||
|---|---|---|---|
| Quadrant | BADHDUFLAG | Total packets | Discarded packets |
| A | 0 | 16 | 0 |
| B | 0 | 16 | 0 |
| C | 0 | 16 | 0 |
| D | 0 | 16 | 0 |
| Mode SS | |||
|---|---|---|---|
| Quadrant | BADHDUFLAG | Total packets | Discarded packets |
| A | 0 | 36 | 0 |
| B | 0 | 36 | 0 |
| C | 0 | 36 | 0 |
| D | 0 | 36 | 0 |
| Mode M0 | |||
|---|---|---|---|
| Quadrant | BADHDUFLAG | Total packets | Discarded packets |
| A | 0 | 4243 | 2 |
| B | 0 | 3420 | 1 |
| C | 0 | 3675 | 1 |
| D | 0 | 6100 | 1 |
| Quadrant | Total seconds | Saturated seconds | Saturation percentage |
|---|---|---|---|
| A | 1664 | 21 | 1.262019% |
| B | 1664 | 4 | 0.240385% |
| C | 1664 | 12 | 0.721154% |
| D | 1664 | 65 | 3.906250% |
Noise dominated data is calculated using 1-second bins in cleaned event files. If a bin has >2000 counts, and if more than 50% of those come from <1% of pixels, then it is considered to be noise-dominated and hence unusable.
| Quadrant | # 1 sec bins | Bins with >0 counts | Bins with >2000 counts | High rate bins dominated by noise | Noise dominated (total time) | Noise dominated (detector-on time) | Marked lightcurve |
|---|---|---|---|---|---|---|---|
| A | 3276 | 1665 | 17 | 17 | 0.52% | 1.02% | 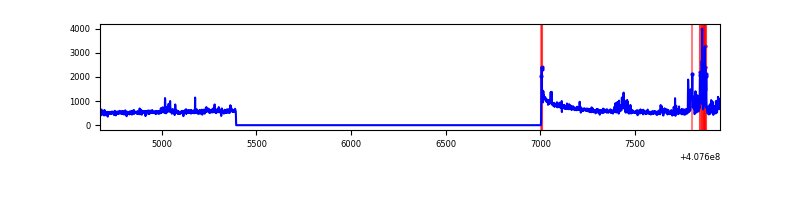 |
| B | 3276 | 1665 | 0 | 0 | 0.00% | 0.00% | 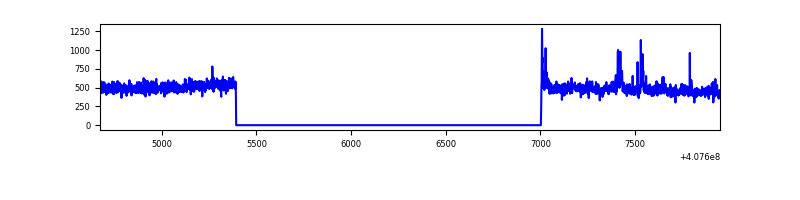 |
| C | 3276 | 1665 | 7 | 7 | 0.21% | 0.42% | 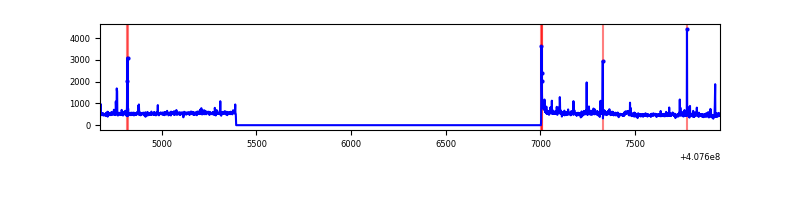 |
| D | 3276 | 1665 | 49 | 49 | 1.50% | 2.94% | 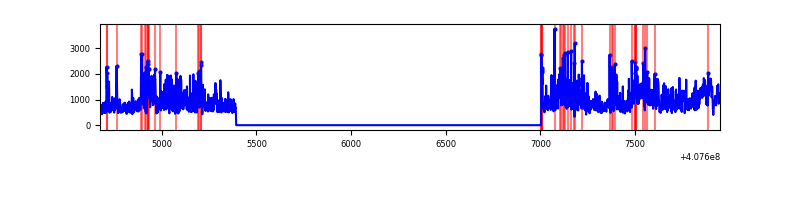 |
Top three noisy pixels from each quadrant. If the there are fewer than three noisy pixels in the level2.evt file, extra rows are filled as -1
| Pixel properties | Quadrant properties | ||||||
|---|---|---|---|---|---|---|---|
| Quadrant | DetID | PixID | Counts | Sigma | Mean | Median | Sigma |
| A | 10 | 83 | 162679 | 3845.24 | 200 | 196 | 42.3 |
| A | 13 | 248 | 86236 | 2036.18 | 200 | 196 | 42.3 |
| A | 12 | 16 | 41730 | 982.92 | 200 | 196 | 42.3 |
| B | 5 | 184 | 21077 | 512.66 | 199 | 194 | 40.7 |
| B | 0 | 230 | 8985 | 215.81 | 199 | 194 | 40.7 |
| B | 0 | 186 | 5650 | 133.94 | 199 | 194 | 40.7 |
| C | 15 | 214 | 76142 | 1640.4 | 193 | 193 | 46.3 |
| C | 1 | 23 | 32939 | 707.26 | 193 | 193 | 46.3 |
| C | 15 | 208 | 22388 | 479.38 | 193 | 193 | 46.3 |
| D | 12 | 235 | 435600 | 8916.29 | 194 | 188 | 48.8 |
| D | 2 | 16 | 255155 | 5221.17 | 194 | 188 | 48.8 |
| D | 2 | 249 | 111653 | 2282.56 | 194 | 188 | 48.8 |
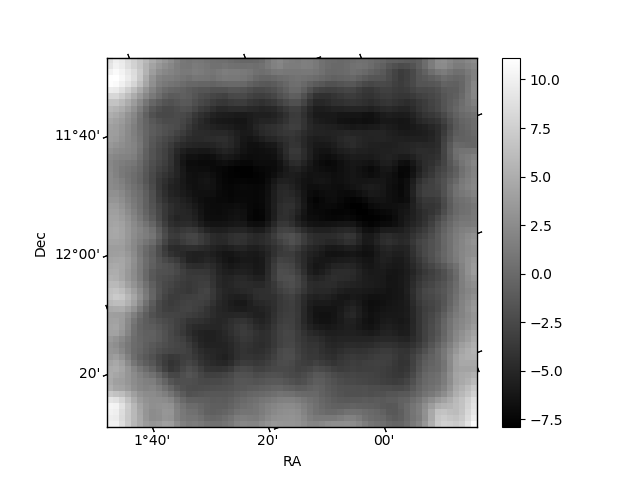
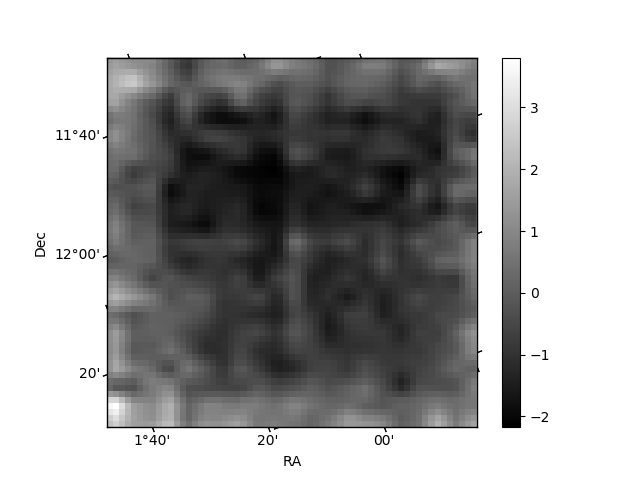
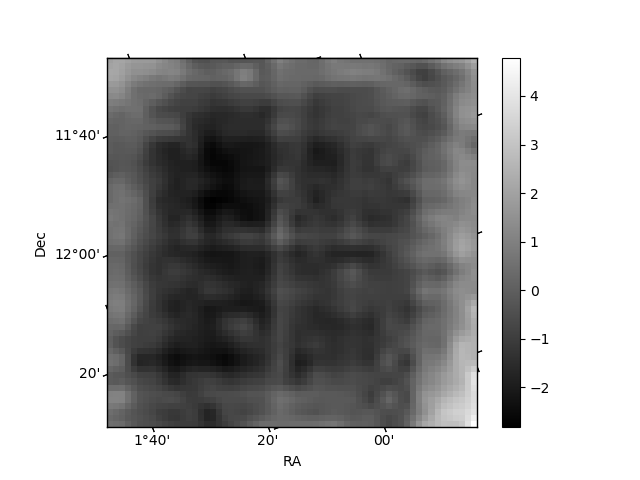
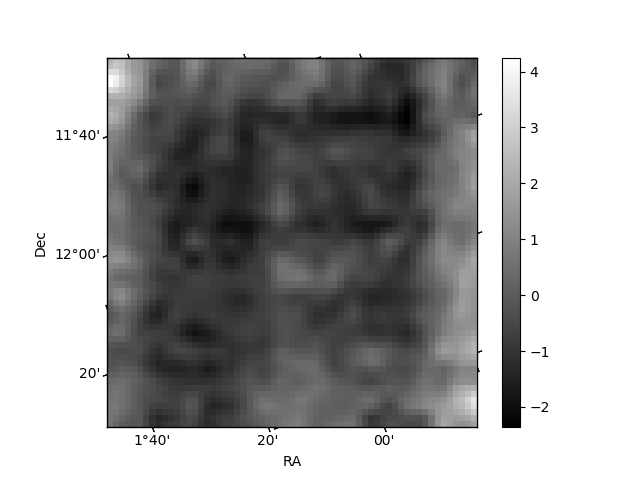
Histogram calculated using DETX and DETY for each event in the final _common_clean file
| Quadrant A | 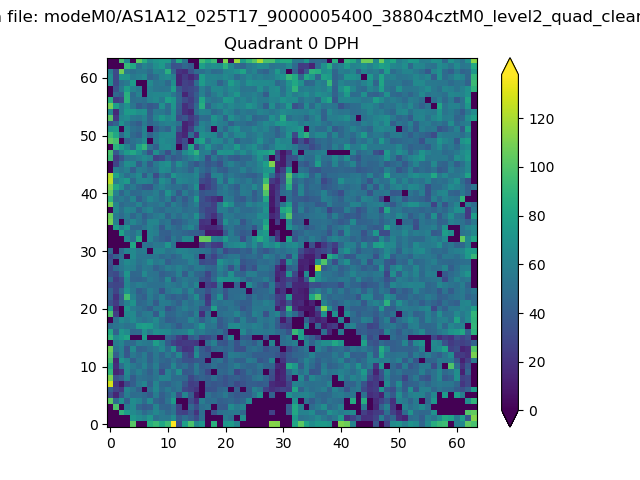 |
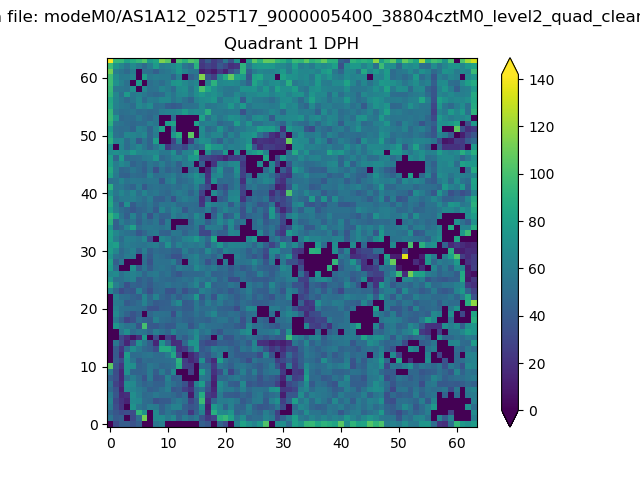 |
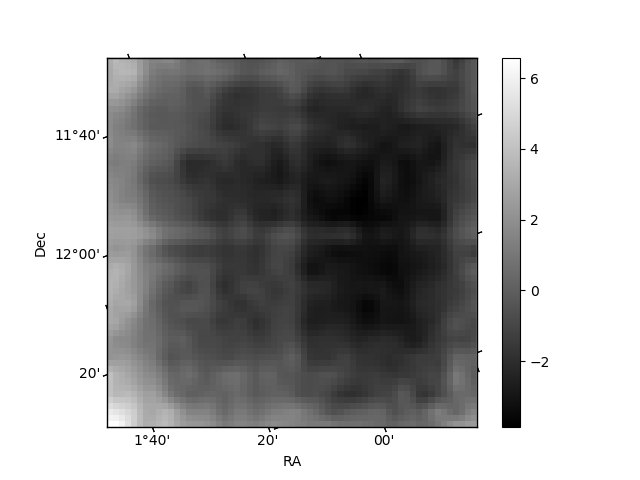
Quadrant B |
|---|---|---|---|
| Quadrant D | 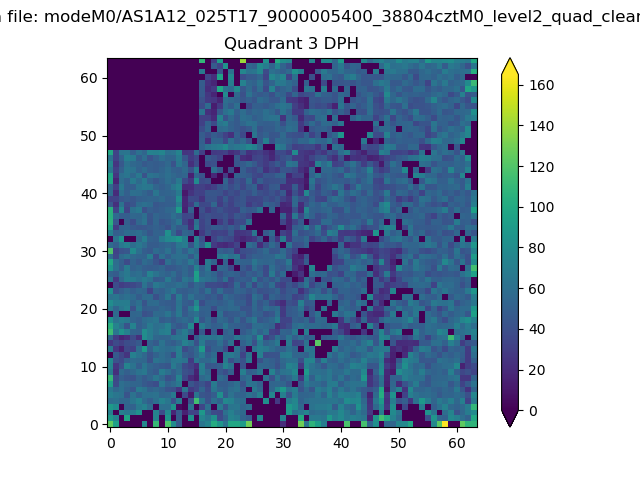 |
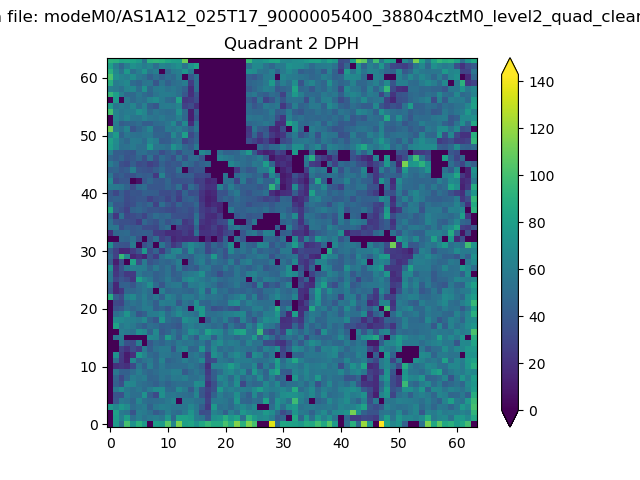 |
Quadrant C |
| Plot type | Count rate plots | Images |
|---|---|---|
| Comparison with Poisson distribution Blue bars denote a histogram of data divided into 1 sec bins. Red curve is a Poisson curve with rate = median count rate of data. |
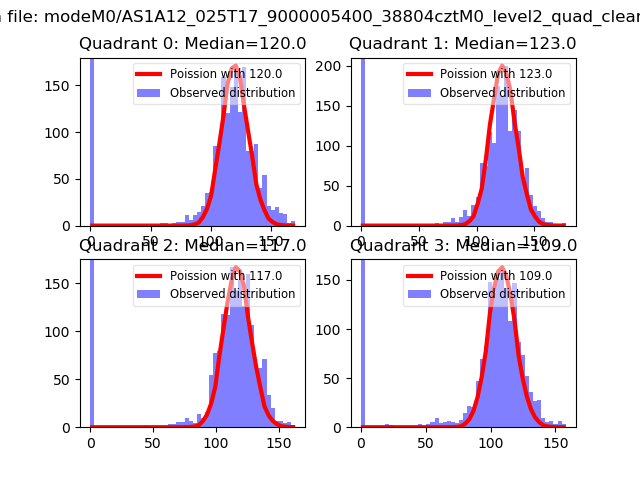 |
 |
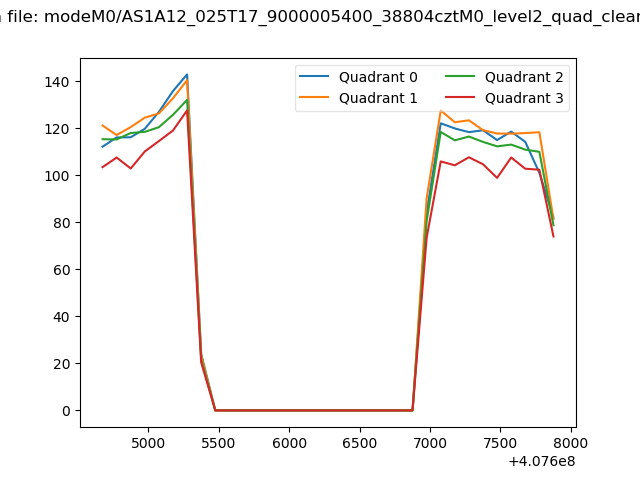
| Quadrant-wise count rates Data is divided into 100 sec bins |
 |
|
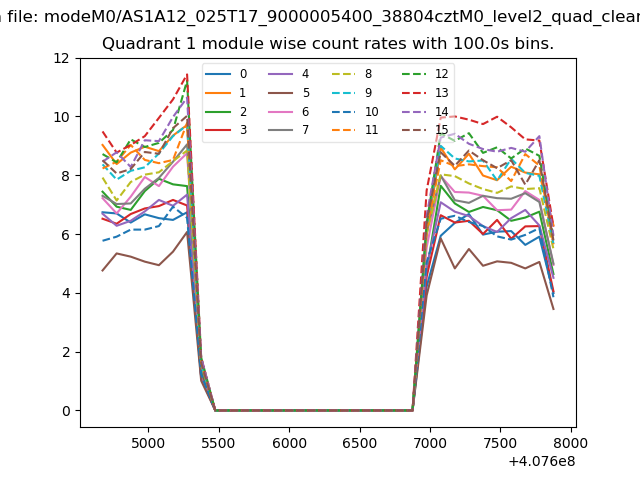
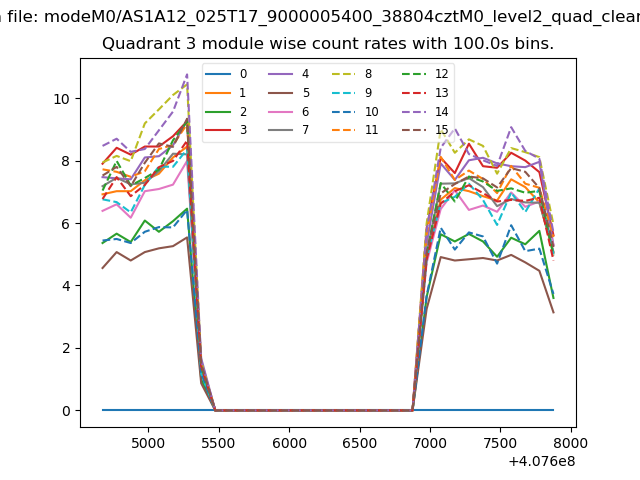
| Module-wise count rates for Quadrant A Data is divided into 100 sec bins |
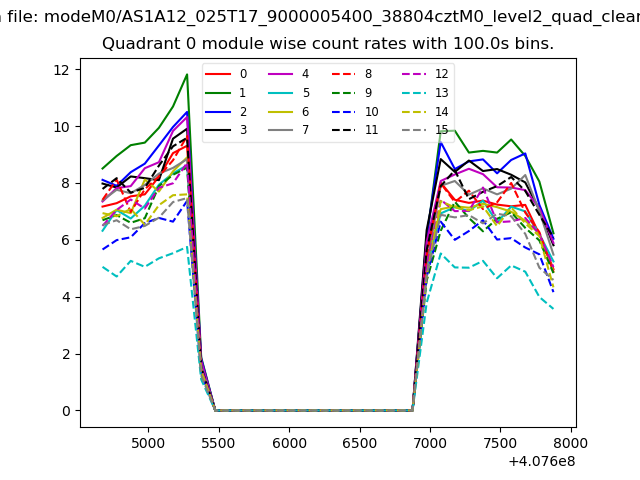 |
 |
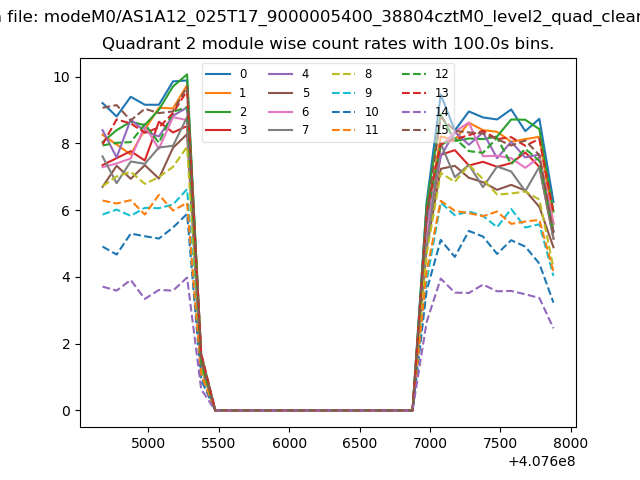
| Module-wise count rates for Quadrant B Data is divided into 100 sec bins |
 |
 |
| Module-wise count rates for Quadrant C Data is divided into 100 sec bins |
 |
 |
| Module-wise count rates for Quadrant D Data is divided into 100 sec bins |
 |
 |
| Parameter | Plot |
|---|---|
| CZT HV Monitor | 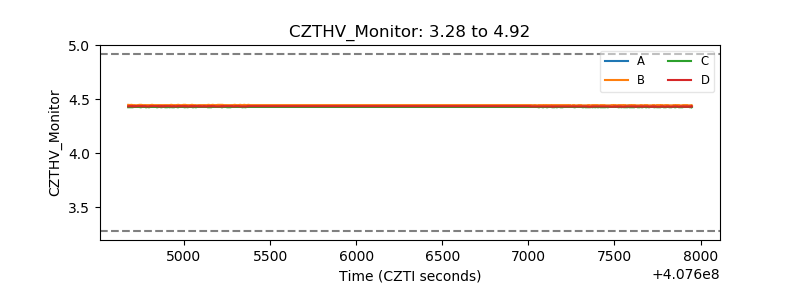 |
| D_VDD | 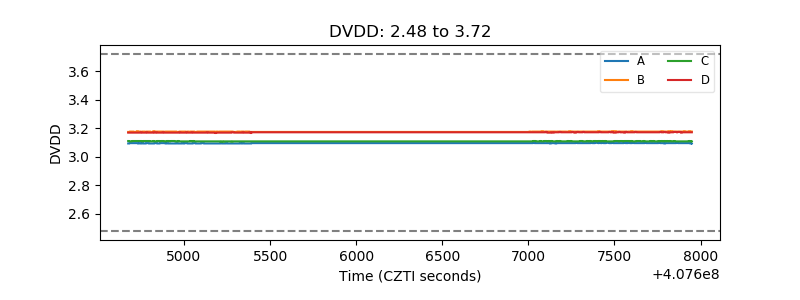 |
| Temperature 1 | 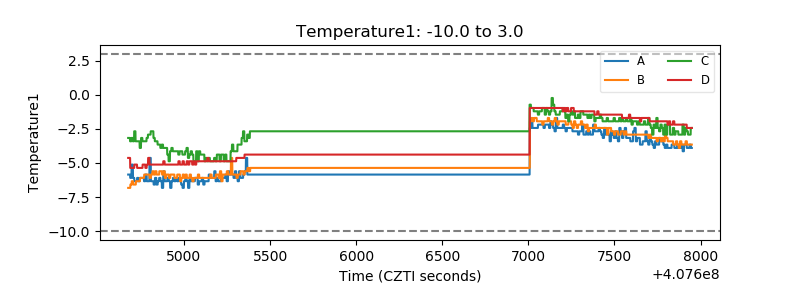 |
| Veto HV Monitor | 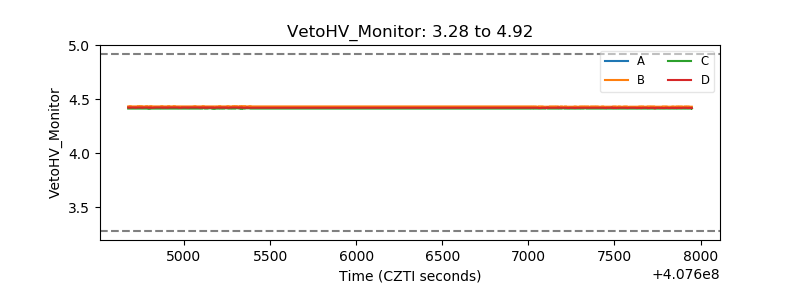 |
| Veto LLD | 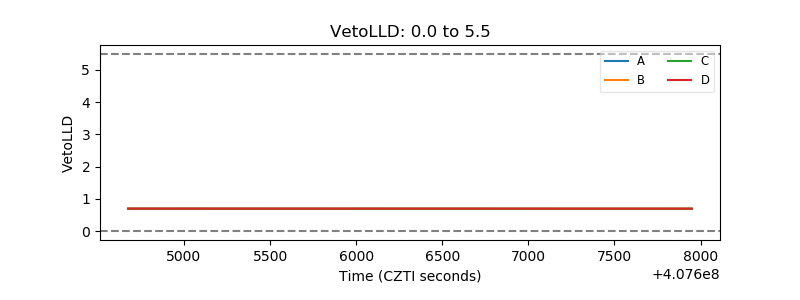 |
| Alpha Counter | 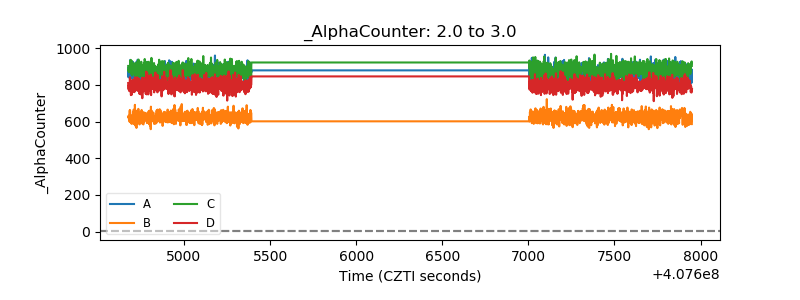 |
| _CPM_Rate | 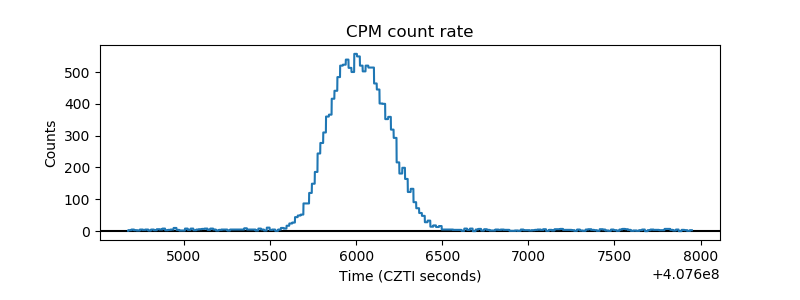 |
| CZT Counter | 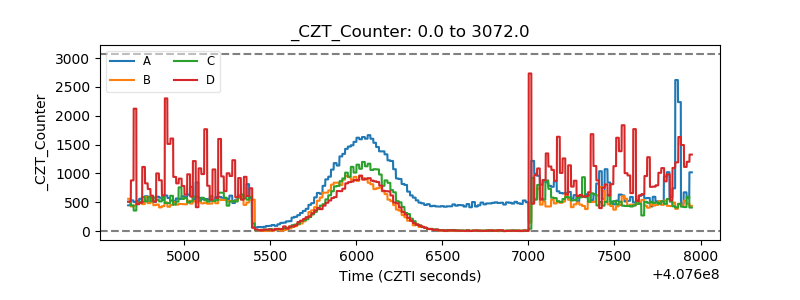 |
| +2.5 Volts monitor |  |
| +5 Volts monitor |  |
| _ROLL_ROT | 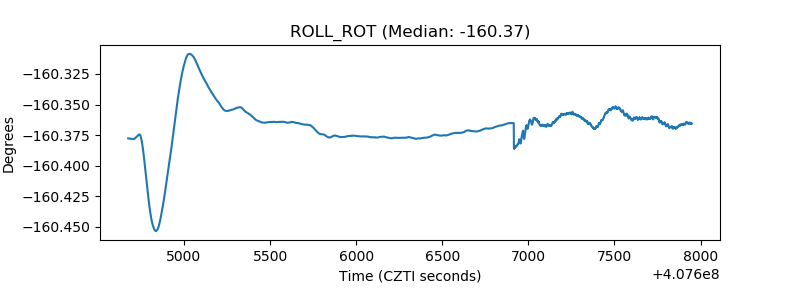 |
| _Roll_DEC | 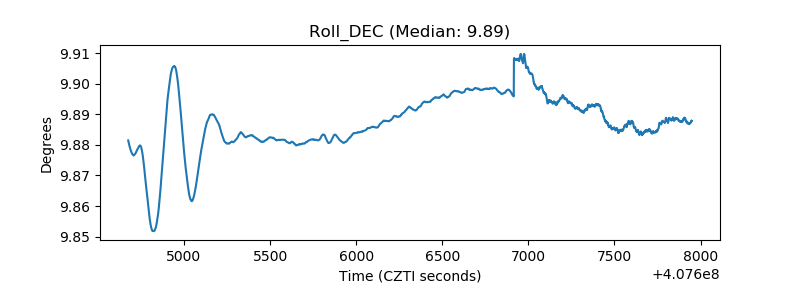 |
| _Roll_RA | 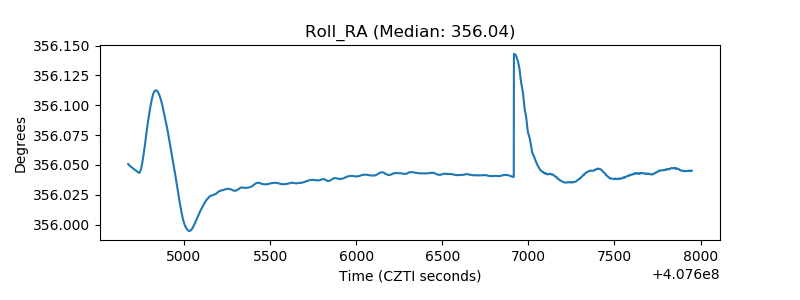 |
| Veto Counter | 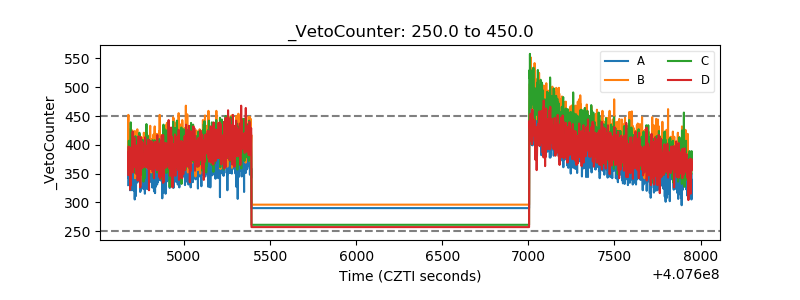 |