| Param | Original file | Final file |
|---|---|---|
| Filename | modeM0/AS1A12_025T17_9000005400_38805cztM0_level2.fits | modeM0/AS1A12_025T17_9000005400_38805cztM0_level2_quad_clean.evt |
| Size (bytes) | 451,264,320 | 90,717,120 |
| Size | 430.4 MB | 86.5 MB |
| Events in quadrant A | 3,475,167 | 624,960 |
| Events in quadrant B | 3,733,735 | 604,610 |
| Events in quadrant C | 2,743,486 | 611,190 |
| Events in quadrant D | 6,323,407 | 519,344 |
| Mode M9 | |||
|---|---|---|---|
| Quadrant | BADHDUFLAG | Total packets | Discarded packets |
| A | 0 | 23 | 0 |
| B | 0 | 23 | 0 |
| C | 0 | 23 | 0 |
| D | 0 | 24 | 0 |
| Mode SS | |||
|---|---|---|---|
| Quadrant | BADHDUFLAG | Total packets | Discarded packets |
| A | 0 | 114 | 0 |
| B | 0 | 114 | 0 |
| C | 0 | 114 | 0 |
| D | 0 | 114 | 0 |
| Mode M0 | |||
|---|---|---|---|
| Quadrant | BADHDUFLAG | Total packets | Discarded packets |
| A | 0 | 13896 | 3 |
| B | 0 | 14744 | 2 |
| C | 0 | 11569 | 2 |
| D | 0 | 22703 | 2 |
| Quadrant | Total seconds | Saturated seconds | Saturation percentage |
|---|---|---|---|
| A | 5522 | 36 | 0.651938% |
| B | 5522 | 406 | 7.352409% |
| C | 5522 | 18 | 0.325969% |
| D | 5522 | 592 | 10.720753% |
Noise dominated data is calculated using 1-second bins in cleaned event files. If a bin has >2000 counts, and if more than 50% of those come from <1% of pixels, then it is considered to be noise-dominated and hence unusable.
| Quadrant | # 1 sec bins | Bins with >0 counts | Bins with >2000 counts | High rate bins dominated by noise | Noise dominated (total time) | Noise dominated (detector-on time) | Marked lightcurve |
|---|---|---|---|---|---|---|---|
| A | 7255 | 5523 | 30 | 30 | 0.41% | 0.54% | 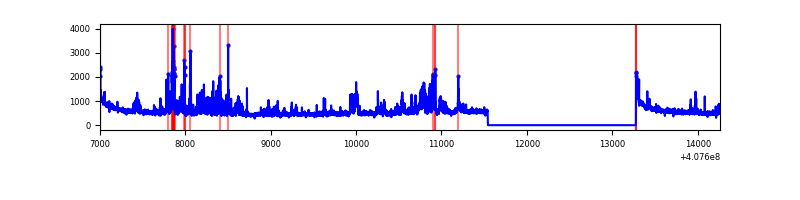 |
| B | 7255 | 5523 | 123 | 123 | 1.70% | 2.23% | 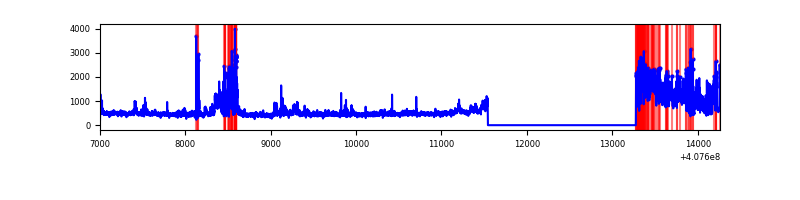 |
| C | 7255 | 5523 | 10 | 10 | 0.14% | 0.18% | 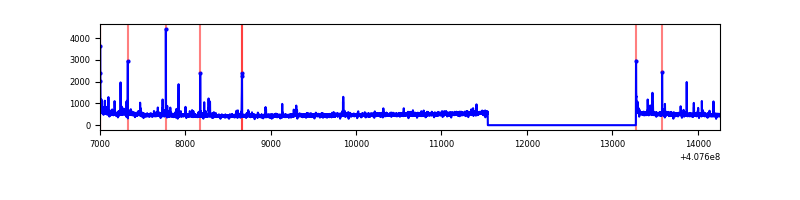 |
| D | 7255 | 5523 | 620 | 620 | 8.55% | 11.23% | 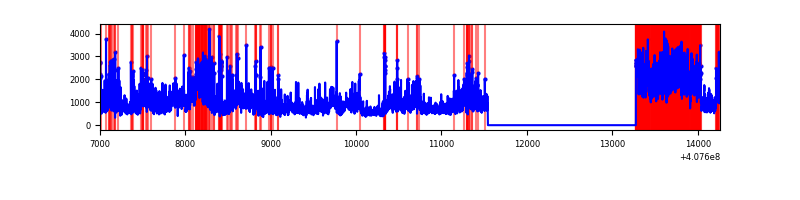 |
Top three noisy pixels from each quadrant. If the there are fewer than three noisy pixels in the level2.evt file, extra rows are filled as -1
| Pixel properties | Quadrant properties | ||||||
|---|---|---|---|---|---|---|---|
| Quadrant | DetID | PixID | Counts | Sigma | Mean | Median | Sigma |
| A | 10 | 83 | 434321 | 3495.2 | 612 | 600 | 124.1 |
| A | 12 | 16 | 387794 | 3120.26 | 612 | 600 | 124.1 |
| A | 13 | 248 | 197487 | 1586.64 | 612 | 600 | 124.1 |
| B | 5 | 184 | 1224621 | 10506.26 | 601 | 586 | 116.5 |
| B | 0 | 230 | 56902 | 483.38 | 601 | 586 | 116.5 |
| B | 15 | 85 | 19344 | 161.01 | 601 | 586 | 116.5 |
| C | 15 | 214 | 243936 | 1741.49 | 601 | 606 | 139.7 |
| C | 1 | 23 | 81607 | 579.72 | 601 | 606 | 139.7 |
| C | 0 | 10 | 32995 | 231.8 | 601 | 606 | 139.7 |
| D | 12 | 235 | 2607323 | 18295.07 | 581 | 564 | 142.5 |
| D | 2 | 16 | 684841 | 4802.48 | 581 | 564 | 142.5 |
| D | 13 | 249 | 264542 | 1852.68 | 581 | 564 | 142.5 |
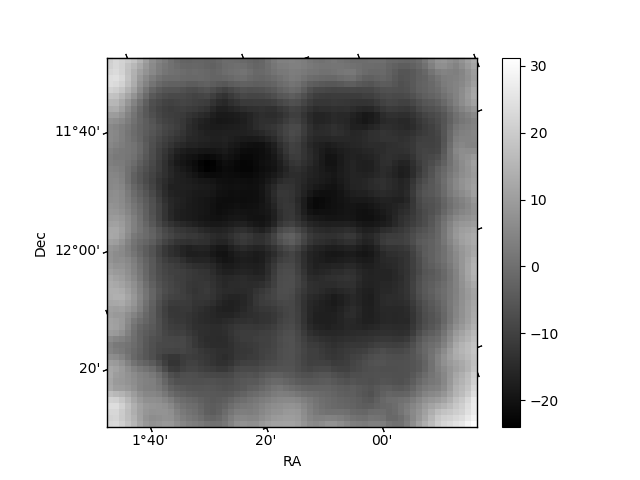
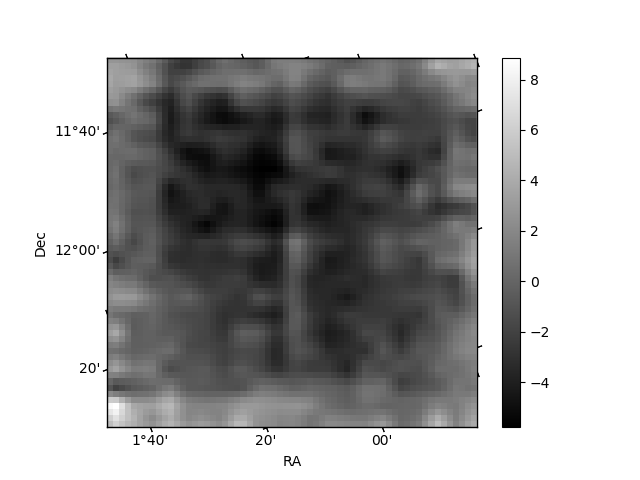
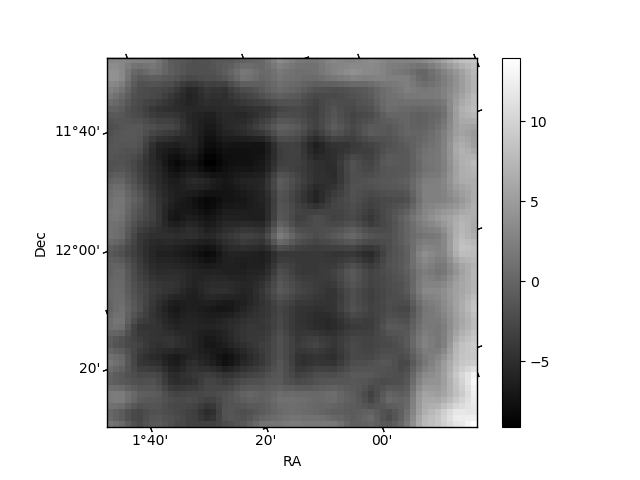
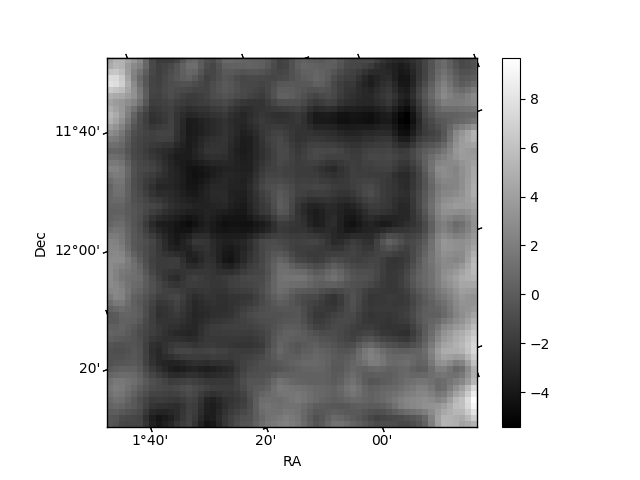
Histogram calculated using DETX and DETY for each event in the final _common_clean file
| Quadrant A | 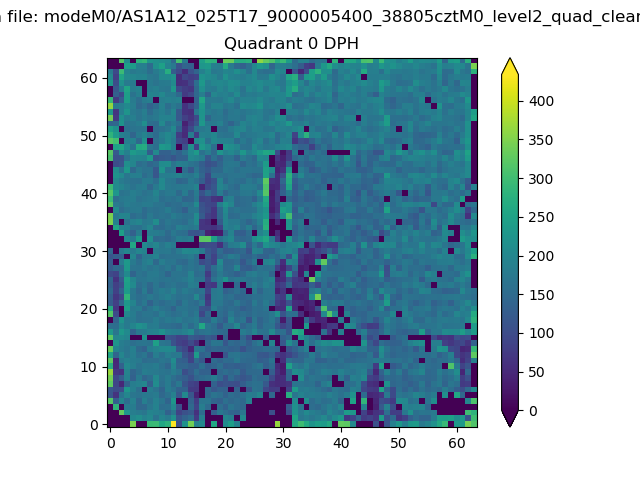 |
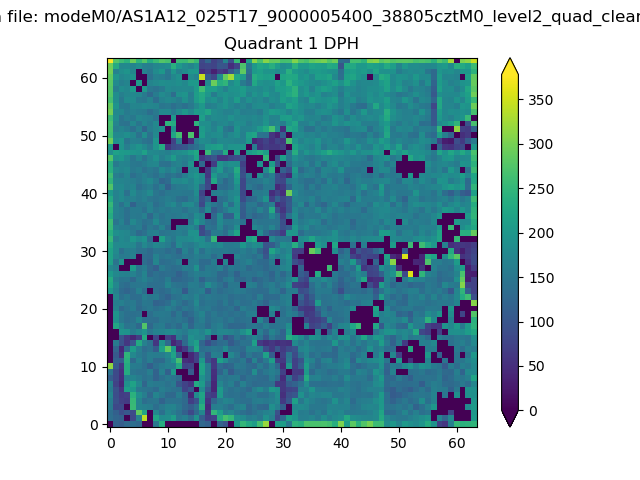 |
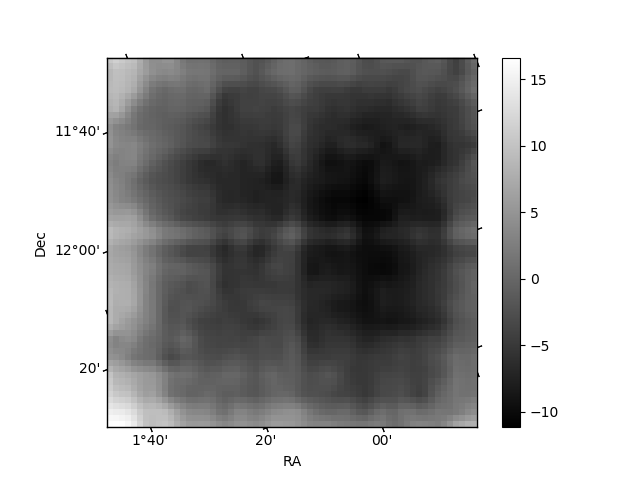
Quadrant B |
|---|---|---|---|
| Quadrant D | 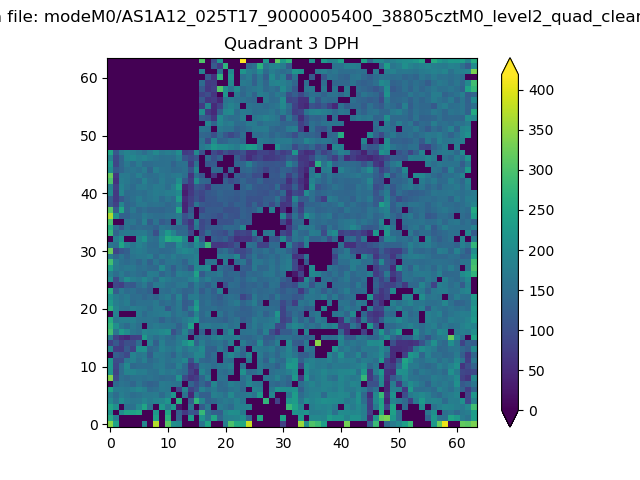 |
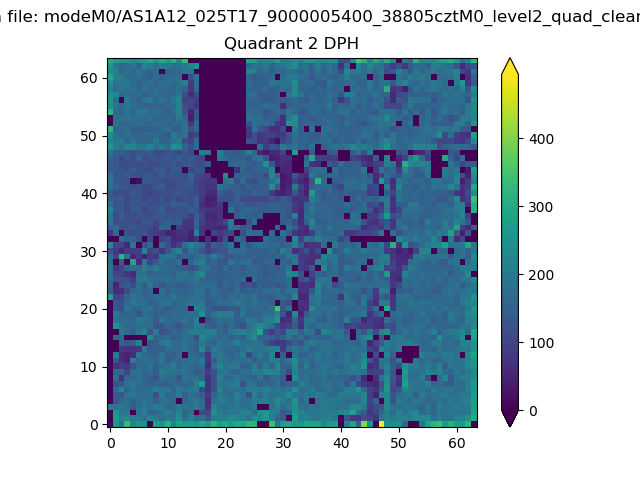 |
Quadrant C |
| Plot type | Count rate plots | Images |
|---|---|---|
| Comparison with Poisson distribution Blue bars denote a histogram of data divided into 1 sec bins. Red curve is a Poisson curve with rate = median count rate of data. |
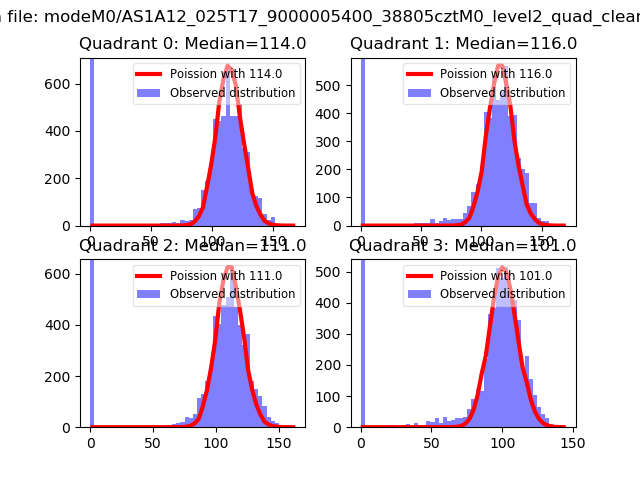 |
 |
| Quadrant-wise count rates Data is divided into 100 sec bins |
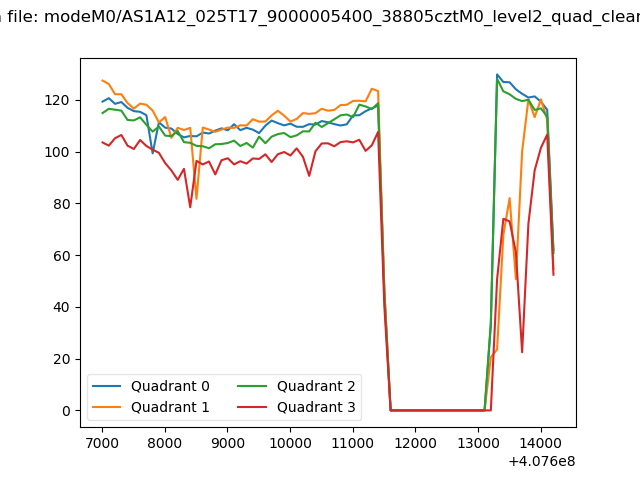 |
|
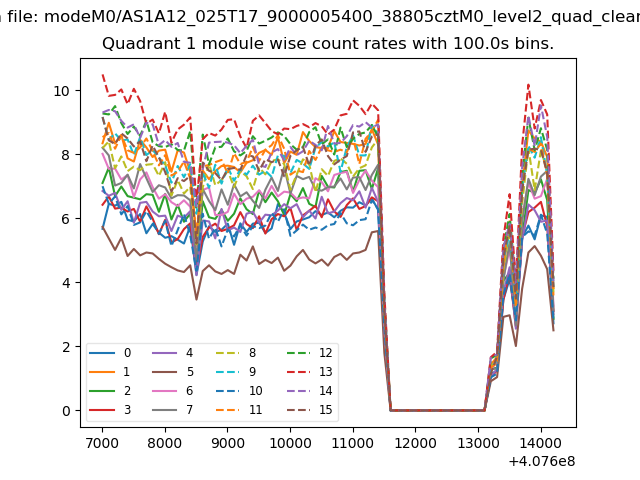
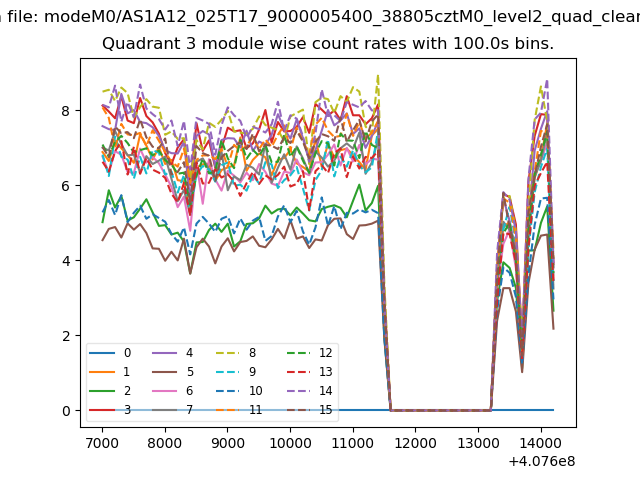
| Module-wise count rates for Quadrant A Data is divided into 100 sec bins |
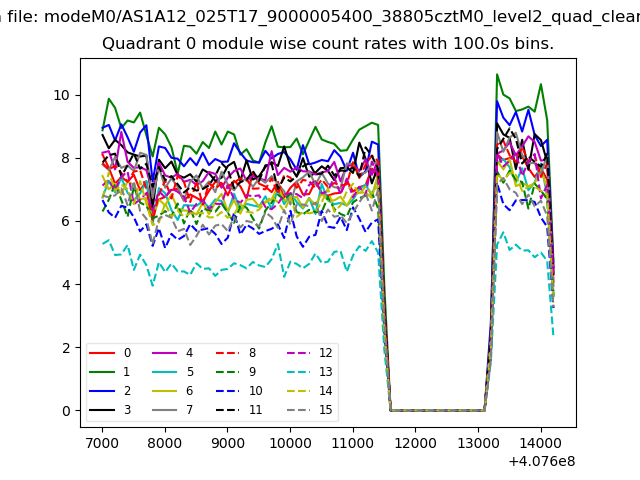 |
 |
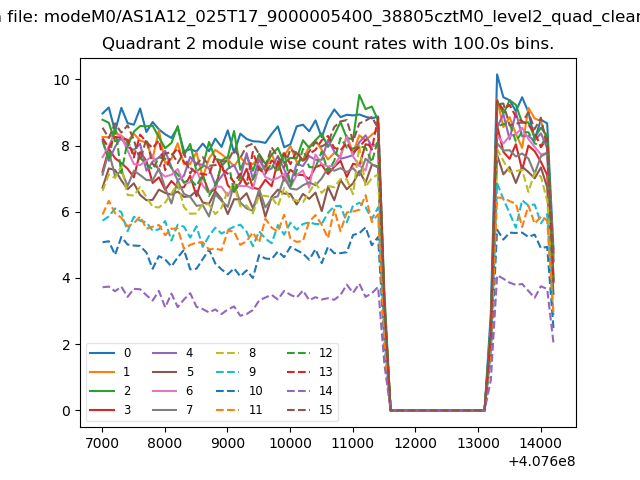
| Module-wise count rates for Quadrant B Data is divided into 100 sec bins |
 |
 |
| Module-wise count rates for Quadrant C Data is divided into 100 sec bins |
 |
 |
| Module-wise count rates for Quadrant D Data is divided into 100 sec bins |
 |
 |
| Parameter | Plot |
|---|---|
| CZT HV Monitor | 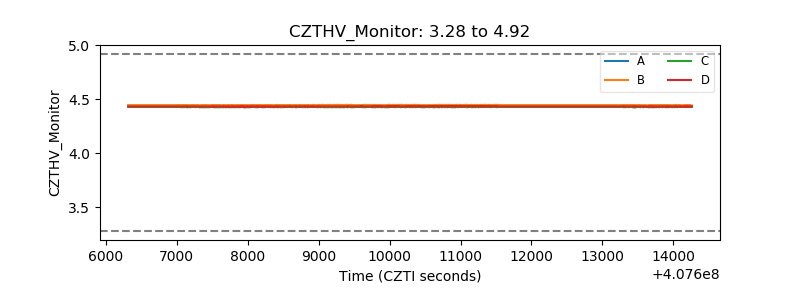 |
| D_VDD | 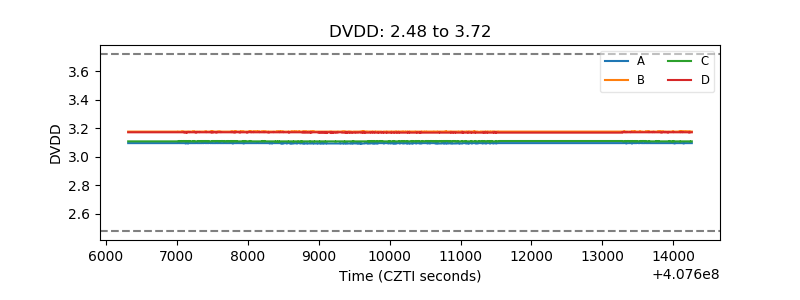 |
| Temperature 1 | 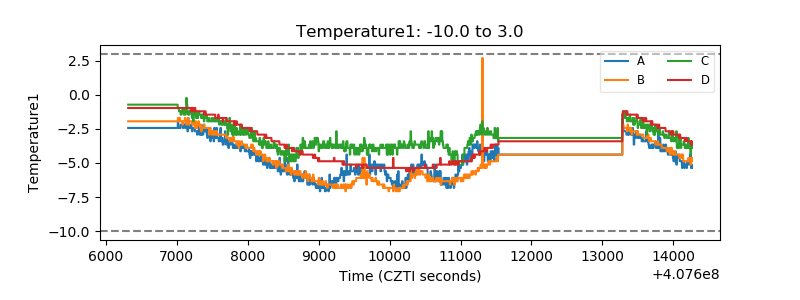 |
| Veto HV Monitor | 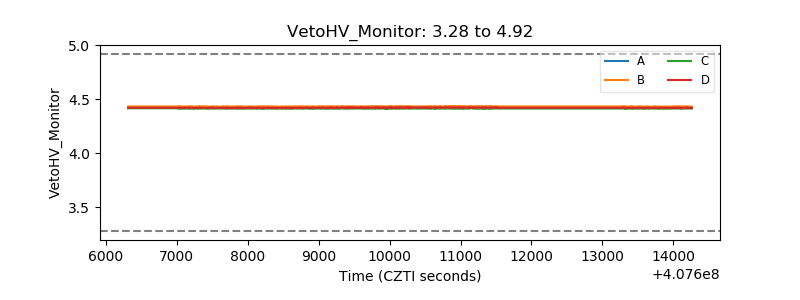 |
| Veto LLD | 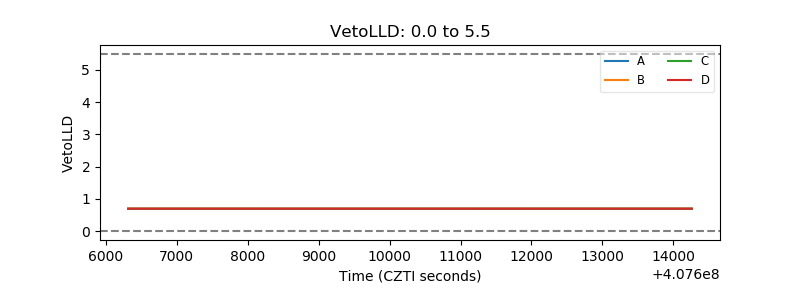 |
| Alpha Counter | 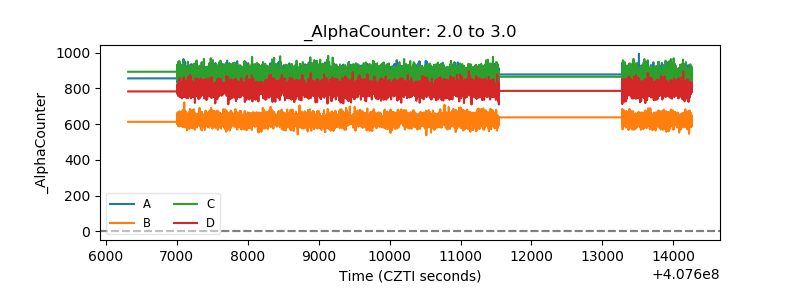 |
| _CPM_Rate | 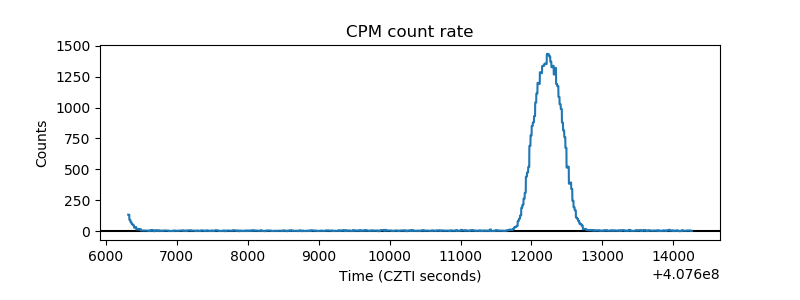 |
| CZT Counter | 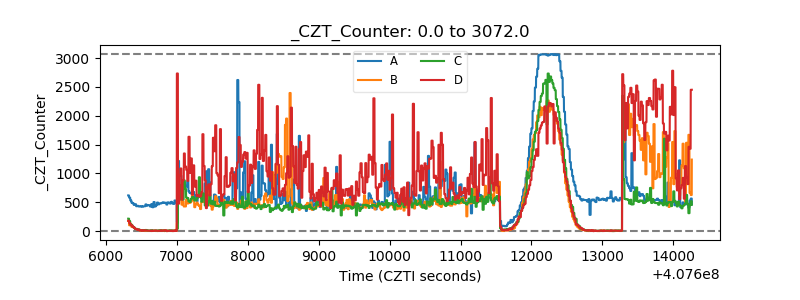 |
| +2.5 Volts monitor |  |
| +5 Volts monitor | 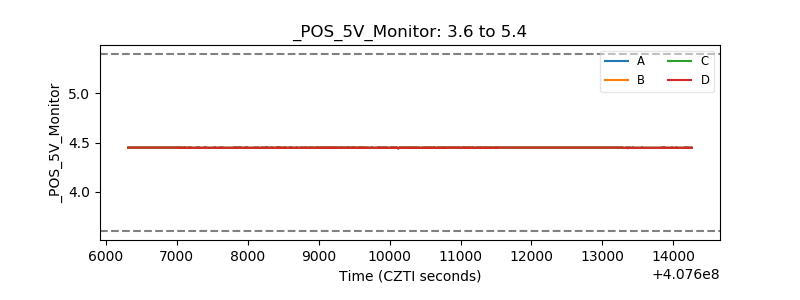 |
| _ROLL_ROT | 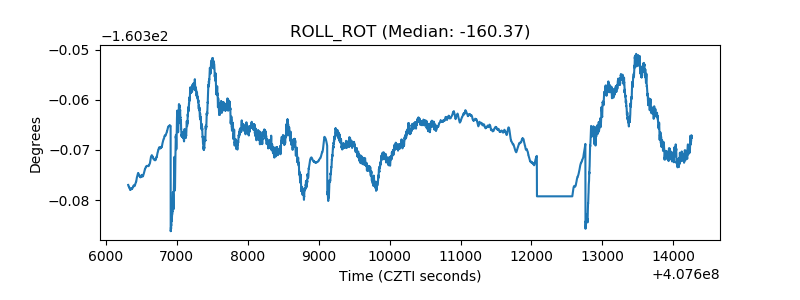 |
| _Roll_DEC | 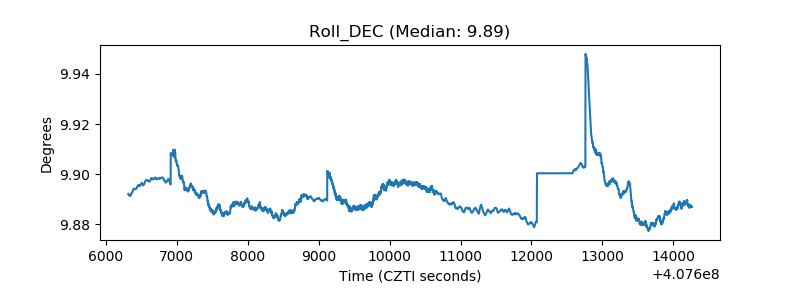 |
| _Roll_RA | 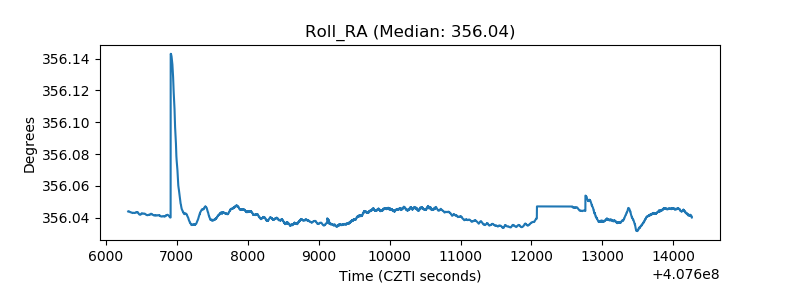 |
| Veto Counter | 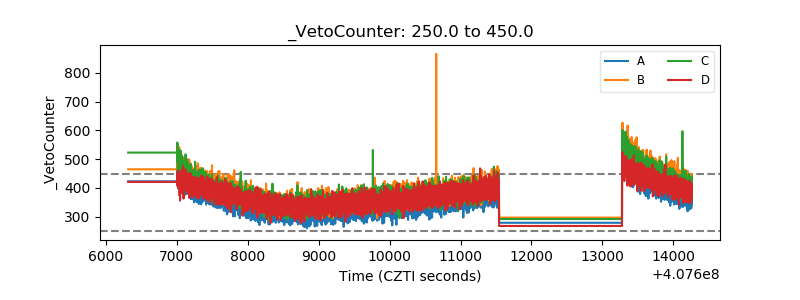 |