| Param | Original file | Final file |
|---|---|---|
| Filename | modeM0/AS1A12_025T17_9000005400_38807cztM0_level2.fits | modeM0/AS1A12_025T17_9000005400_38807cztM0_level2_quad_clean.evt |
| Size (bytes) | 438,361,920 | 89,853,120 |
| Size | 418.1 MB | 85.7 MB |
| Events in quadrant A | 3,819,687 | 611,629 |
| Events in quadrant B | 3,890,153 | 604,819 |
| Events in quadrant C | 2,628,045 | 614,290 |
| Events in quadrant D | 5,476,632 | 518,781 |
| Mode M9 | |||
|---|---|---|---|
| Quadrant | BADHDUFLAG | Total packets | Discarded packets |
| A | 0 | 25 | 0 |
| B | 0 | 25 | 0 |
| C | 0 | 25 | 0 |
| D | 0 | 26 | 0 |
| Mode SS | |||
|---|---|---|---|
| Quadrant | BADHDUFLAG | Total packets | Discarded packets |
| A | 0 | 106 | 0 |
| B | 0 | 106 | 0 |
| C | 0 | 106 | 0 |
| D | 0 | 106 | 0 |
| Mode M0 | |||
|---|---|---|---|
| Quadrant | BADHDUFLAG | Total packets | Discarded packets |
| A | 0 | 14736 | 2 |
| B | 0 | 15086 | 1 |
| C | 0 | 10956 | 1 |
| D | 0 | 20057 | 1 |
| Quadrant | Total seconds | Saturated seconds | Saturation percentage |
|---|---|---|---|
| A | 5307 | 178 | 3.354061% |
| B | 5307 | 488 | 9.195402% |
| C | 5307 | 12 | 0.226116% |
| D | 5307 | 544 | 10.250612% |
Noise dominated data is calculated using 1-second bins in cleaned event files. If a bin has >2000 counts, and if more than 50% of those come from <1% of pixels, then it is considered to be noise-dominated and hence unusable.
| Quadrant | # 1 sec bins | Bins with >0 counts | Bins with >2000 counts | High rate bins dominated by noise | Noise dominated (total time) | Noise dominated (detector-on time) | Marked lightcurve |
|---|---|---|---|---|---|---|---|
| A | 7130 | 5308 | 143 | 143 | 2.01% | 2.69% | 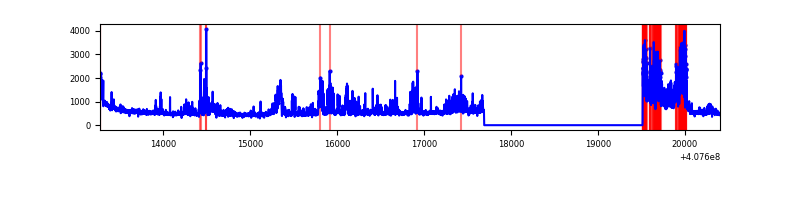 |
| B | 7130 | 5307 | 172 | 172 | 2.41% | 3.24% | 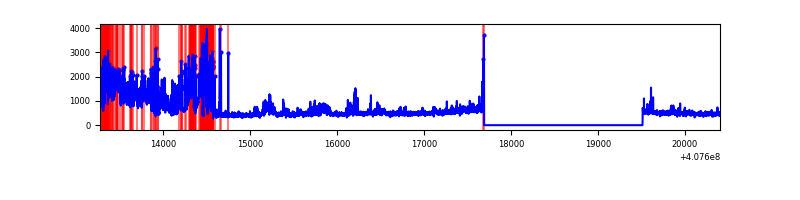 |
| C | 7130 | 5308 | 7 | 7 | 0.10% | 0.13% | 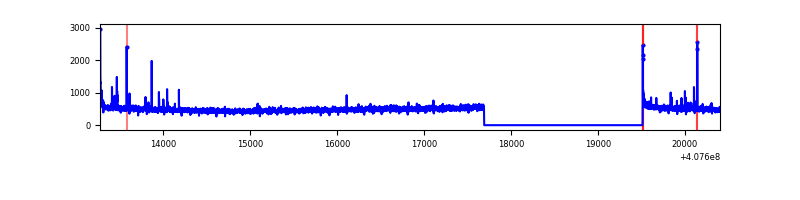 |
| D | 7130 | 5308 | 585 | 585 | 8.20% | 11.02% | 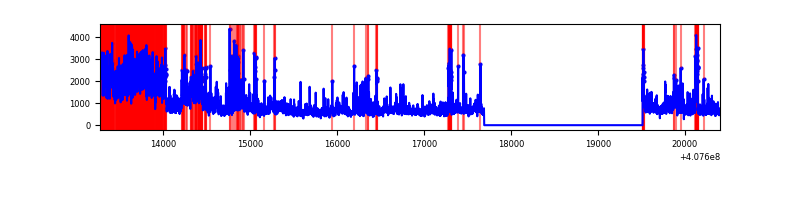 |
Top three noisy pixels from each quadrant. If the there are fewer than three noisy pixels in the level2.evt file, extra rows are filled as -1
| Pixel properties | Quadrant properties | ||||||
|---|---|---|---|---|---|---|---|
| Quadrant | DetID | PixID | Counts | Sigma | Mean | Median | Sigma |
| A | 13 | 248 | 517584 | 4255.85 | 598 | 587 | 121.5 |
| A | 12 | 16 | 471160 | 3873.7 | 598 | 587 | 121.5 |
| A | 10 | 83 | 408218 | 3355.57 | 598 | 587 | 121.5 |
| B | 5 | 184 | 1455127 | 12806.24 | 593 | 578 | 113.6 |
| B | 4 | 170 | 33028 | 285.7 | 593 | 578 | 113.6 |
| B | 15 | 85 | 18422 | 157.1 | 593 | 578 | 113.6 |
| C | 15 | 214 | 235554 | 1692.15 | 593 | 598 | 138.9 |
| C | 0 | 10 | 27313 | 192.4 | 593 | 598 | 138.9 |
| C | 1 | 23 | 25474 | 179.16 | 593 | 598 | 138.9 |
| D | 12 | 235 | 2194040 | 15800.28 | 571 | 557 | 138.8 |
| D | 2 | 16 | 602450 | 4335.6 | 571 | 557 | 138.8 |
| D | 5 | 222 | 148939 | 1068.84 | 571 | 557 | 138.8 |
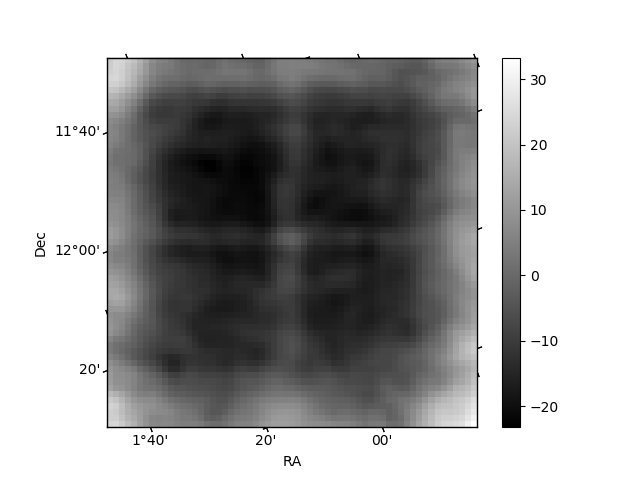
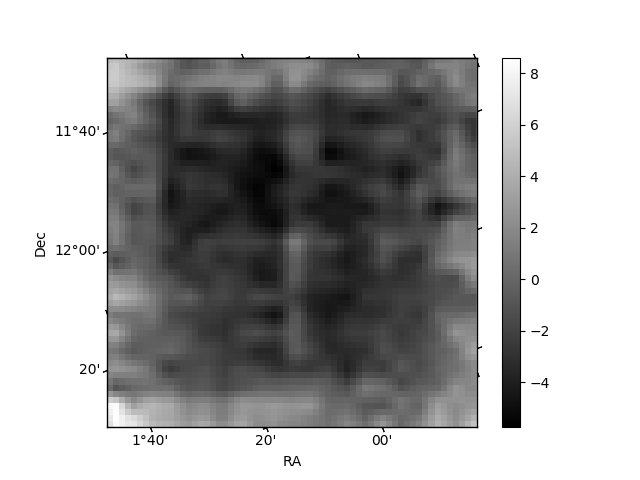
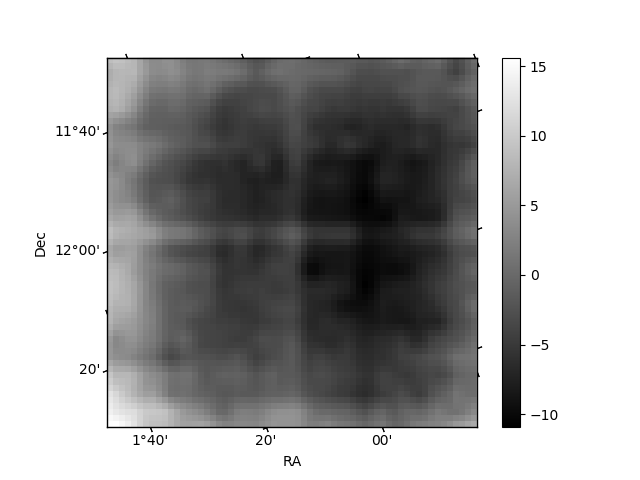
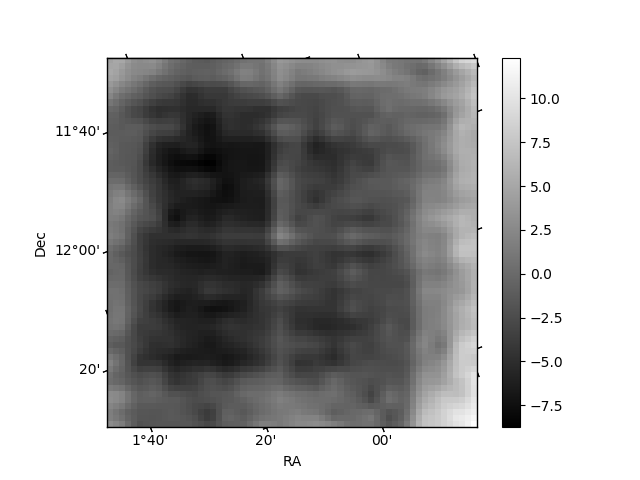
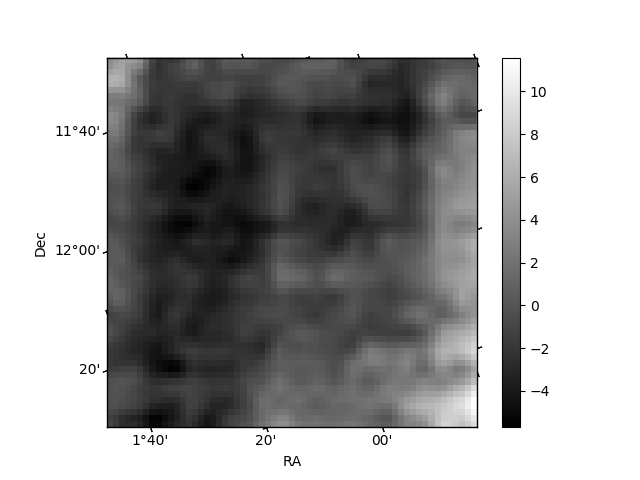
Histogram calculated using DETX and DETY for each event in the final _common_clean file
| Quadrant A | 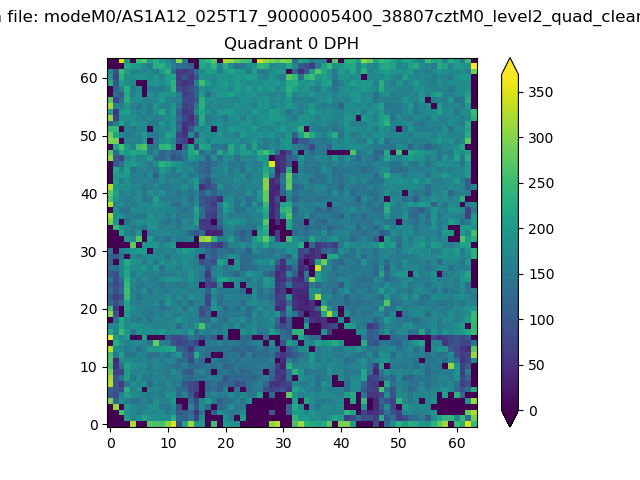 |
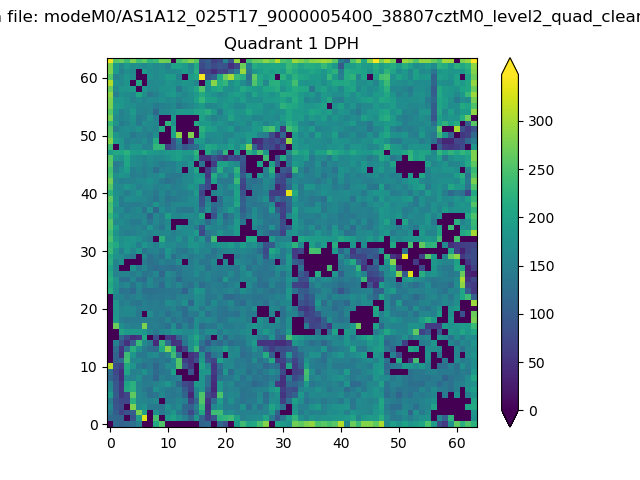 |
Quadrant B |
|---|---|---|---|
| Quadrant D | 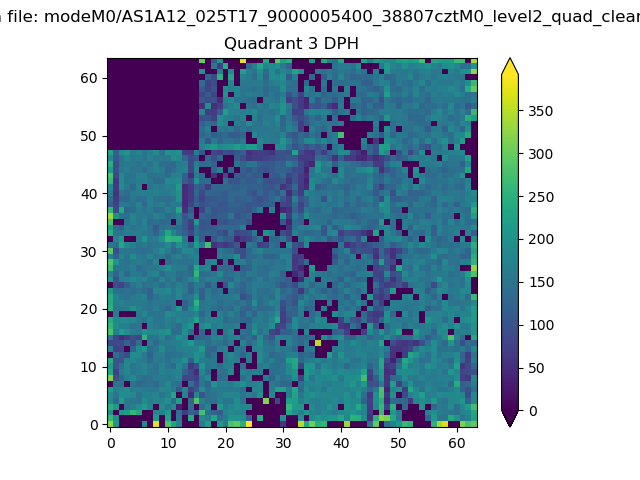 |
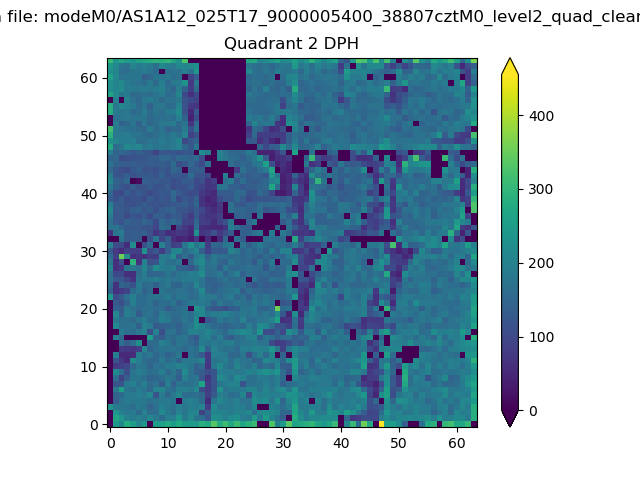 |
Quadrant C |
| Plot type | Count rate plots | Images |
|---|---|---|
| Comparison with Poisson distribution Blue bars denote a histogram of data divided into 1 sec bins. Red curve is a Poisson curve with rate = median count rate of data. |
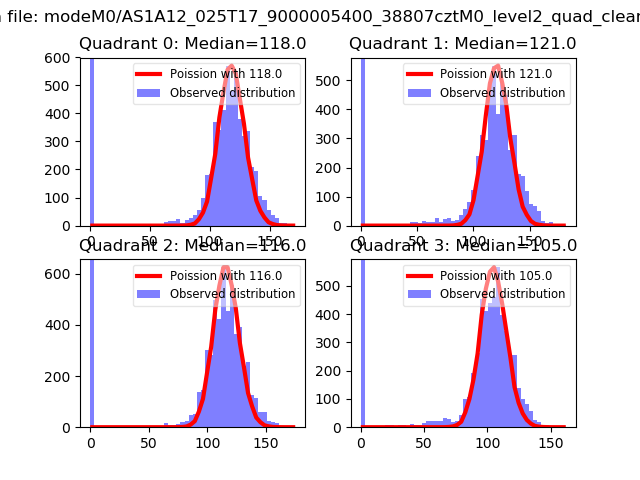 |
 |
| Quadrant-wise count rates Data is divided into 100 sec bins |
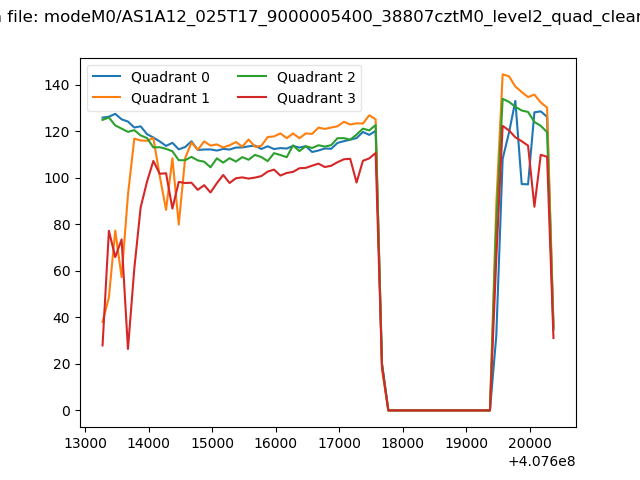 |
|
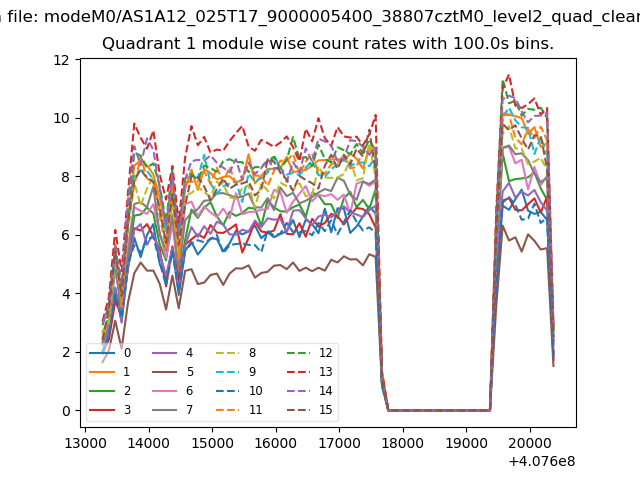
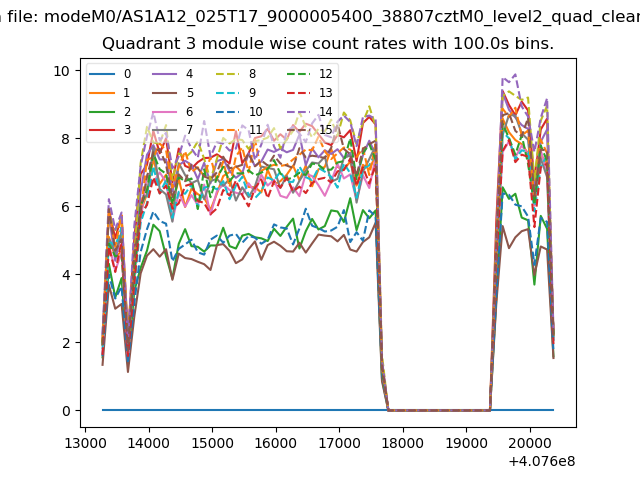
| Module-wise count rates for Quadrant A Data is divided into 100 sec bins |
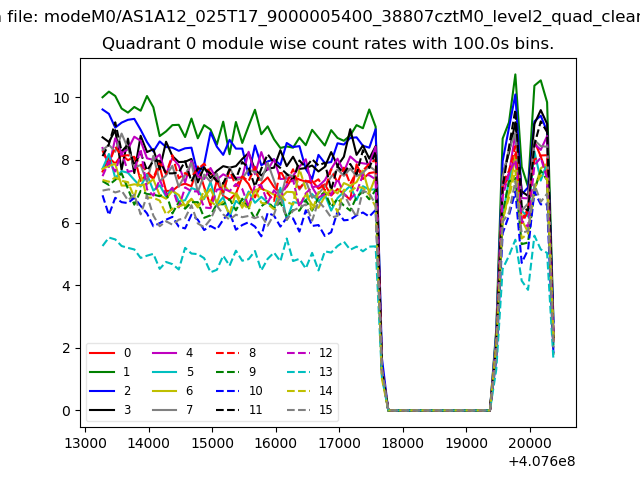 |
 |
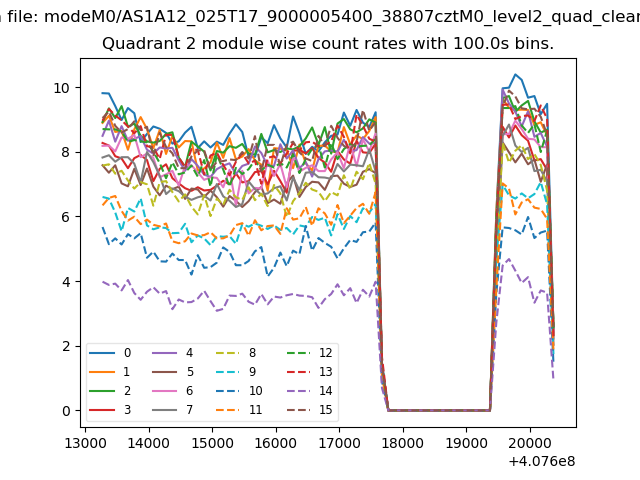
| Module-wise count rates for Quadrant B Data is divided into 100 sec bins |
 |
 |
| Module-wise count rates for Quadrant C Data is divided into 100 sec bins |
 |
 |
| Module-wise count rates for Quadrant D Data is divided into 100 sec bins |
 |
 |
| Parameter | Plot |
|---|---|
| CZT HV Monitor | 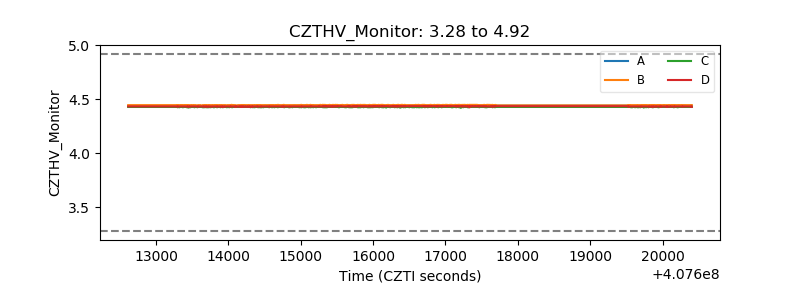 |
| D_VDD | 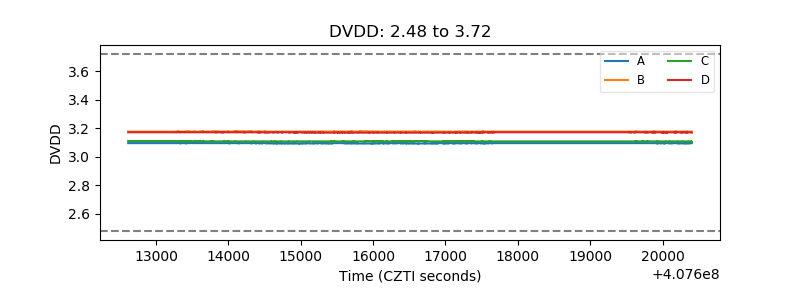 |
| Temperature 1 | 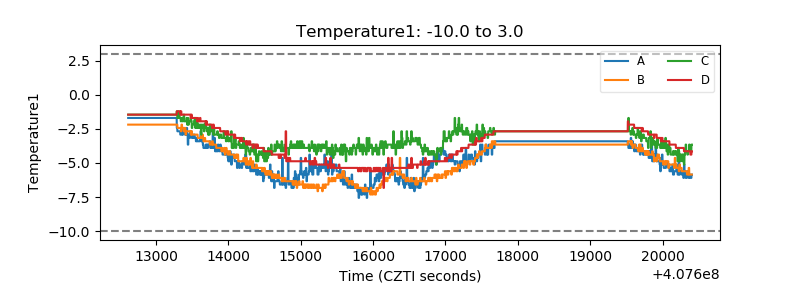 |
| Veto HV Monitor | 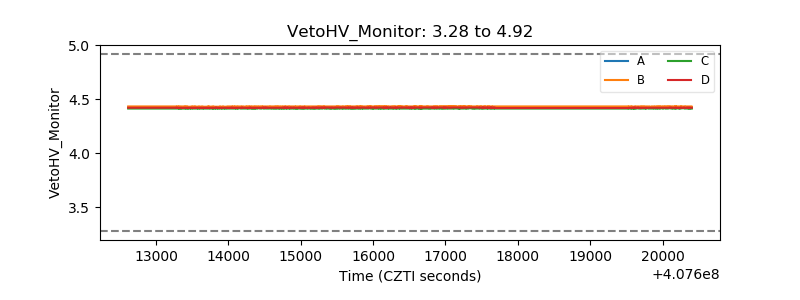 |
| Veto LLD | 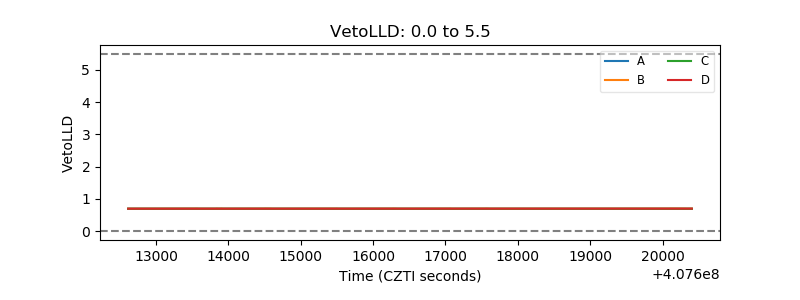 |
| Alpha Counter | 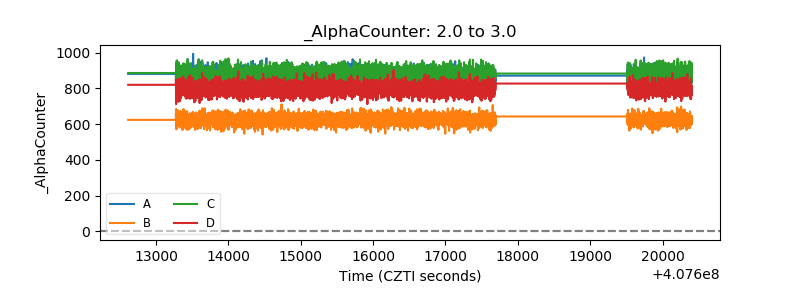 |
| _CPM_Rate | 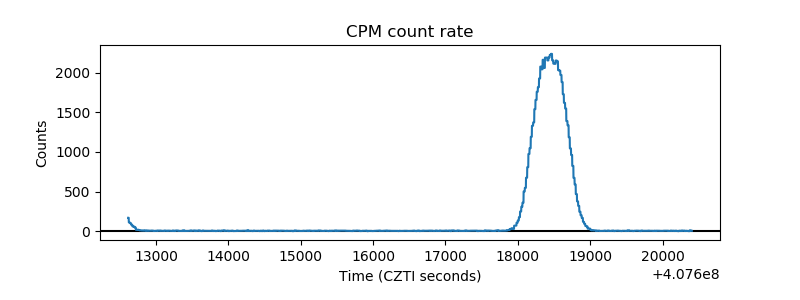 |
| CZT Counter | 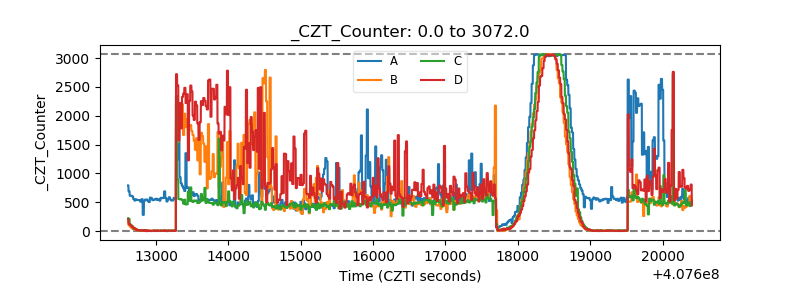 |
| +2.5 Volts monitor | 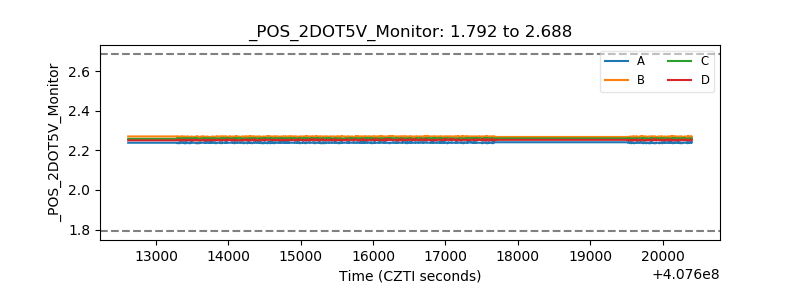 |
| +5 Volts monitor |  |
| _ROLL_ROT | 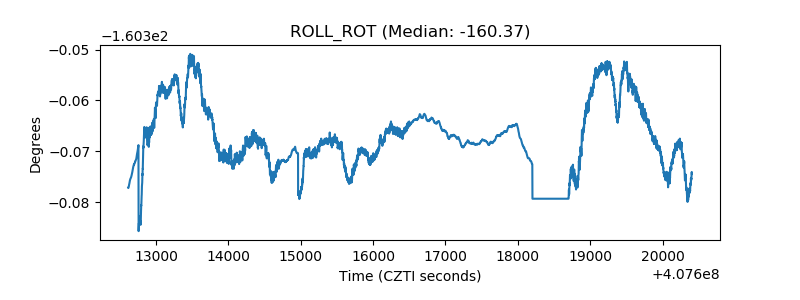 |
| _Roll_DEC | 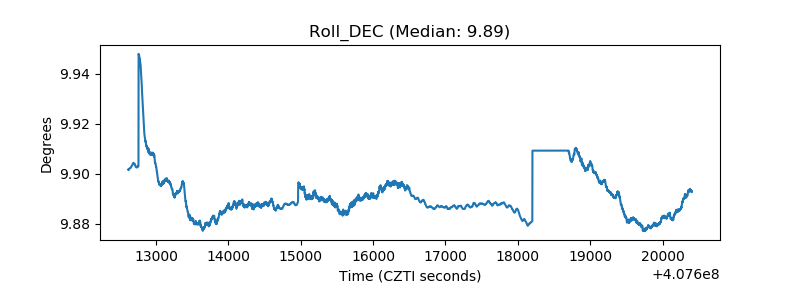 |
| _Roll_RA | 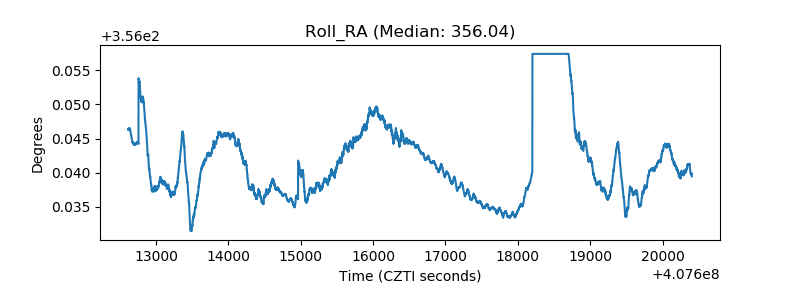 |
| Veto Counter | 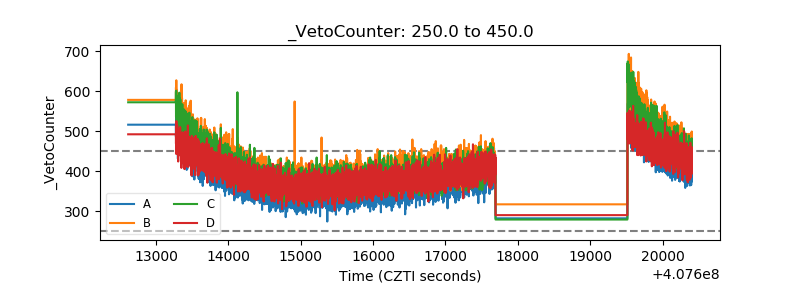 |