| Param | Original file | Final file |
|---|---|---|
| Filename | modeM0/AS1A12_025T17_9000005400_38808cztM0_level2.fits | modeM0/AS1A12_025T17_9000005400_38808cztM0_level2_quad_clean.evt |
| Size (bytes) | 87,373,440 | 19,840,320 |
| Size | 83.3 MB | 18.9 MB |
| Events in quadrant A | 1,140,036 | 122,338 |
| Events in quadrant B | 532,220 | 144,384 |
| Events in quadrant C | 567,194 | 134,150 |
| Events in quadrant D | 909,154 | 119,139 |
| Mode M9 | |||
|---|---|---|---|
| Quadrant | BADHDUFLAG | Total packets | Discarded packets |
| A | 0 | 8 | 0 |
| B | 0 | 8 | 0 |
| C | 0 | 8 | 0 |
| D | 0 | 9 | 0 |
| Mode SS | |||
|---|---|---|---|
| Quadrant | BADHDUFLAG | Total packets | Discarded packets |
| A | 0 | 20 | 0 |
| B | 0 | 20 | 0 |
| C | 0 | 20 | 0 |
| D | 0 | 20 | 0 |
| Mode M0 | |||
|---|---|---|---|
| Quadrant | BADHDUFLAG | Total packets | Discarded packets |
| A | 0 | 4050 | 0 |
| B | 0 | 2237 | 0 |
| C | 0 | 2291 | 0 |
| D | 0 | 3471 | 0 |
| Quadrant | Total seconds | Saturated seconds | Saturation percentage |
|---|---|---|---|
| A | 1064 | 153 | 14.379699% |
| B | 1064 | 2 | 0.187970% |
| C | 1064 | 5 | 0.469925% |
| D | 1064 | 40 | 3.759398% |
Noise dominated data is calculated using 1-second bins in cleaned event files. If a bin has >2000 counts, and if more than 50% of those come from <1% of pixels, then it is considered to be noise-dominated and hence unusable.
| Quadrant | # 1 sec bins | Bins with >0 counts | Bins with >2000 counts | High rate bins dominated by noise | Noise dominated (total time) | Noise dominated (detector-on time) | Marked lightcurve |
|---|---|---|---|---|---|---|---|
| A | 1064 | 1064 | 132 | 132 | 12.41% | 12.41% | 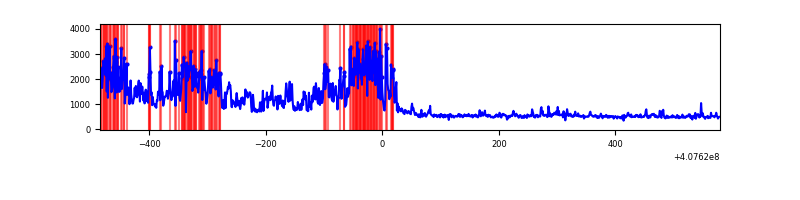 |
| B | 1064 | 1064 | 0 | 0 | 0.00% | 0.00% | 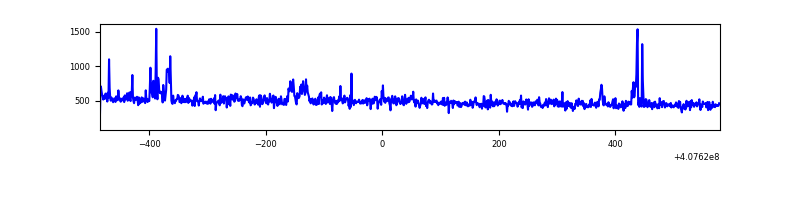 |
| C | 1064 | 1064 | 5 | 5 | 0.47% | 0.47% | 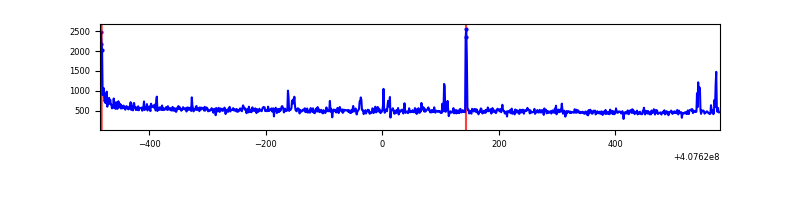 |
| D | 1064 | 1064 | 36 | 36 | 3.38% | 3.38% | 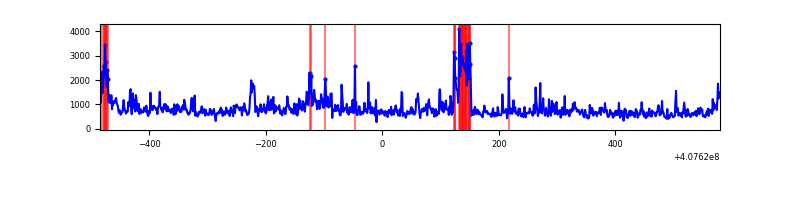 |
Top three noisy pixels from each quadrant. If the there are fewer than three noisy pixels in the level2.evt file, extra rows are filled as -1
| Pixel properties | Quadrant properties | ||||||
|---|---|---|---|---|---|---|---|
| Quadrant | DetID | PixID | Counts | Sigma | Mean | Median | Sigma |
| A | 13 | 248 | 367480 | 14065.82 | 119 | 117 | 26.1 |
| A | 12 | 16 | 151554 | 5798.31 | 119 | 117 | 26.1 |
| A | 10 | 83 | 126171 | 4826.43 | 119 | 117 | 26.1 |
| B | 5 | 184 | 19712 | 763.51 | 126 | 123 | 25.7 |
| B | 0 | 230 | 7483 | 286.87 | 126 | 123 | 25.7 |
| B | 4 | 170 | 4282 | 162.1 | 126 | 123 | 25.7 |
| C | 15 | 214 | 51630 | 1718.7 | 122 | 122 | 30.0 |
| C | 2 | 16 | 23773 | 789.18 | 122 | 122 | 30.0 |
| C | 0 | 10 | 11166 | 368.51 | 122 | 122 | 30.0 |
| D | 12 | 235 | 192109 | 6224.16 | 120 | 117 | 30.8 |
| D | 2 | 16 | 134372 | 4352.39 | 120 | 117 | 30.8 |
| D | 13 | 249 | 71238 | 2305.66 | 120 | 117 | 30.8 |
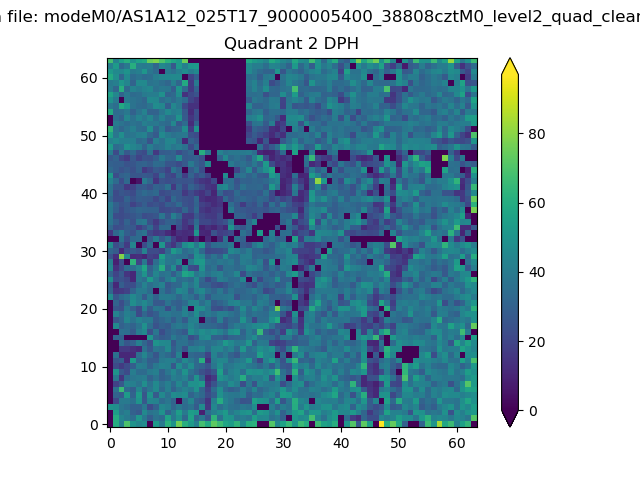
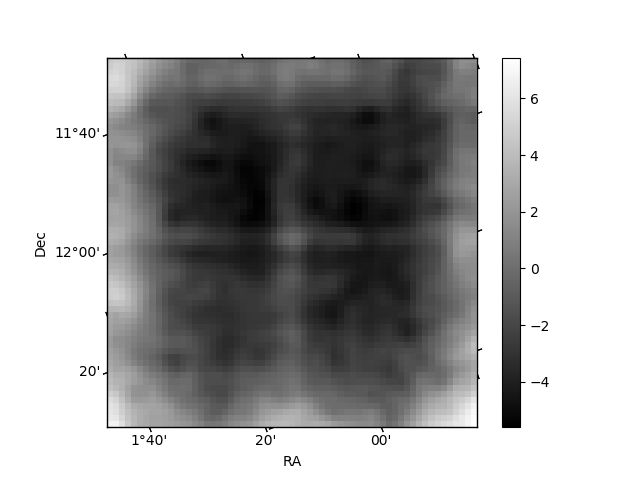
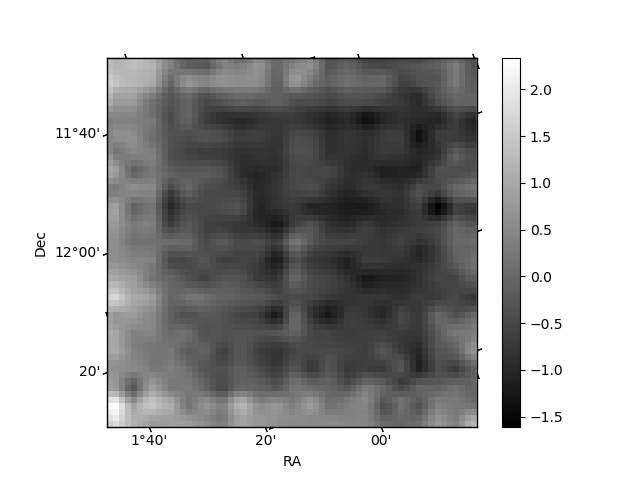
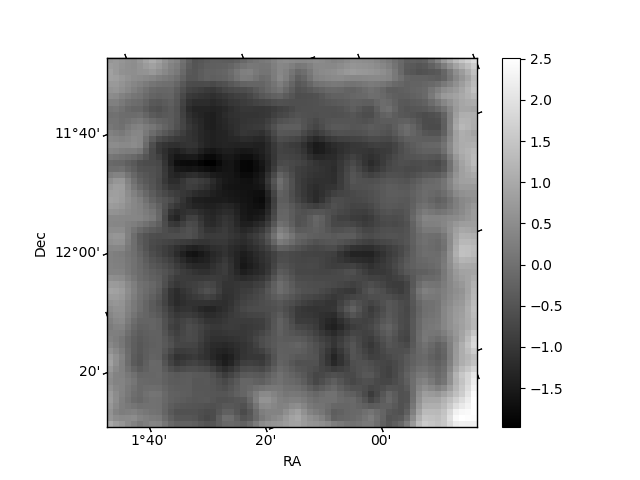
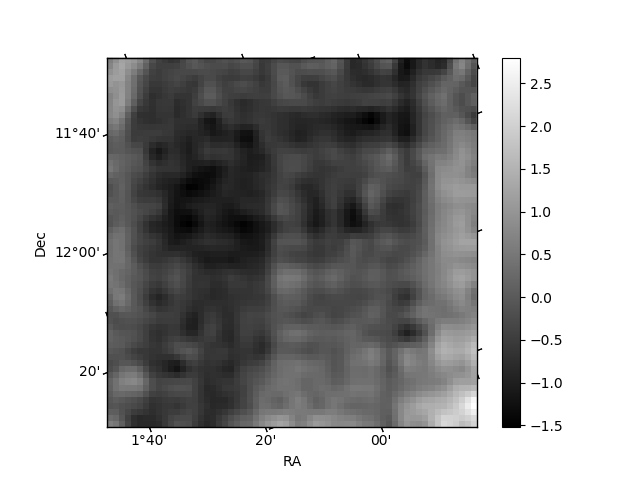
Histogram calculated using DETX and DETY for each event in the final _common_clean file
| Quadrant A | 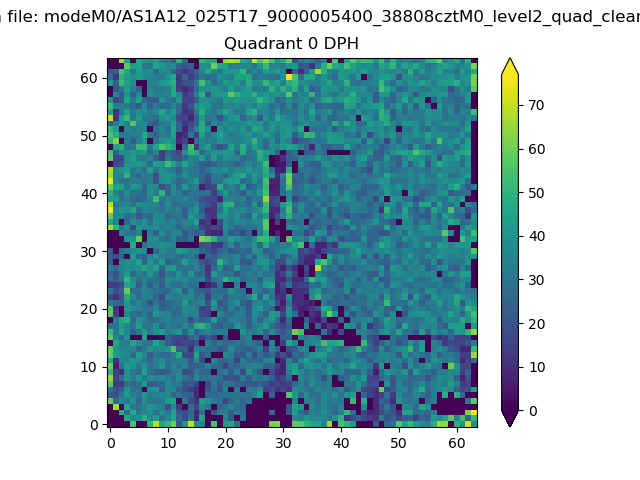 |
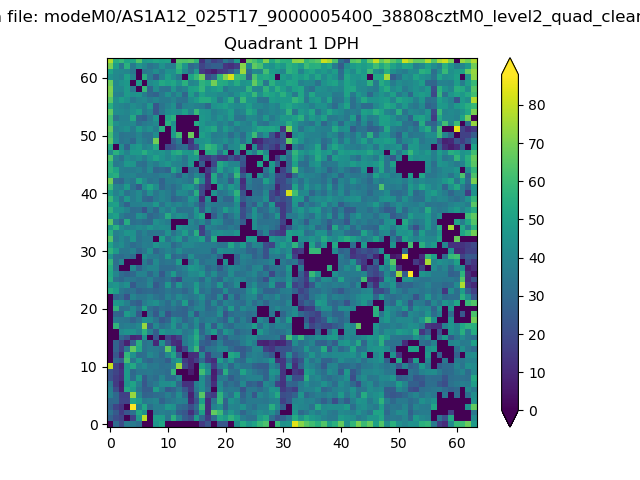 |
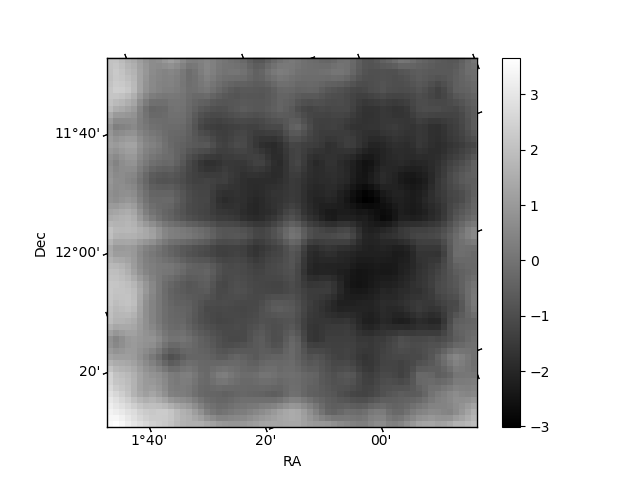
Quadrant B |
|---|---|---|---|
| Quadrant D | 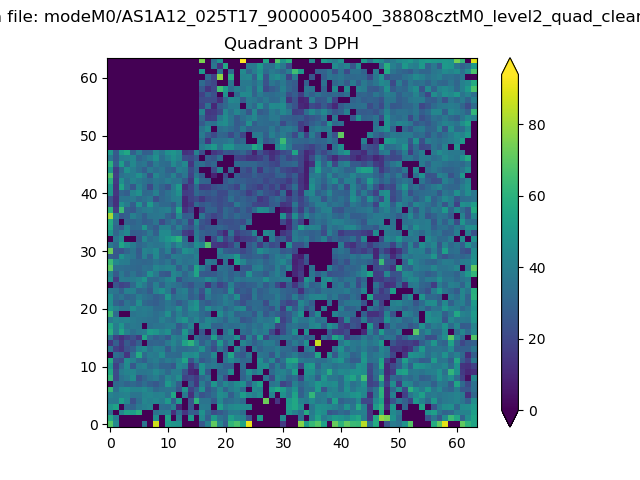 |
 |
Quadrant C |
| Plot type | Count rate plots | Images |
|---|---|---|
| Comparison with Poisson distribution Blue bars denote a histogram of data divided into 1 sec bins. Red curve is a Poisson curve with rate = median count rate of data. |
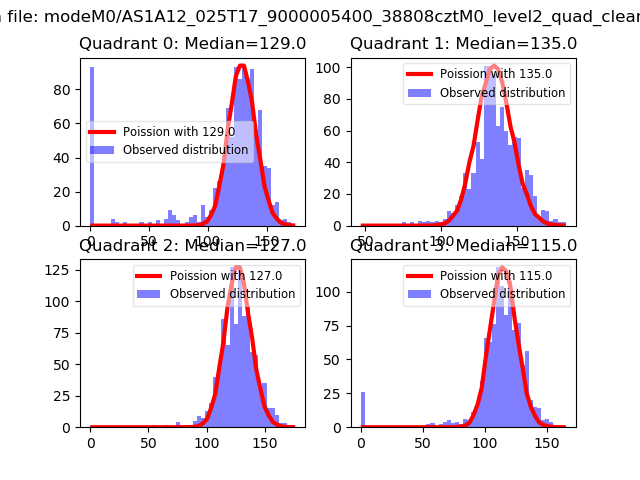 |
 |
| Quadrant-wise count rates Data is divided into 100 sec bins |
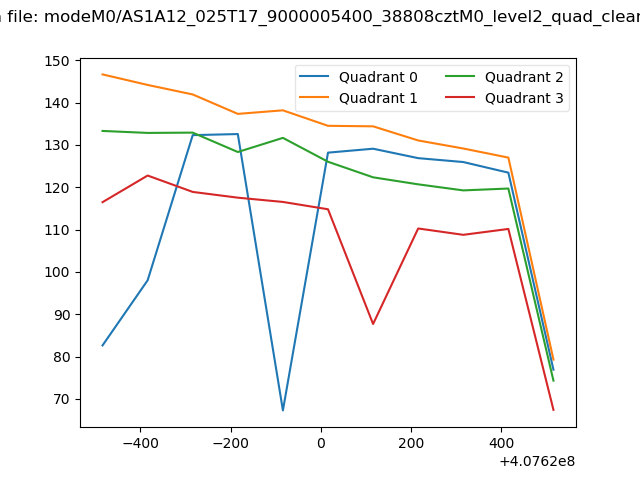 |
|
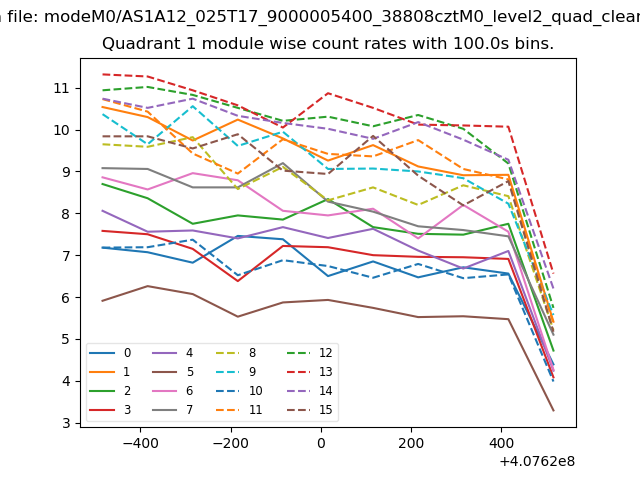
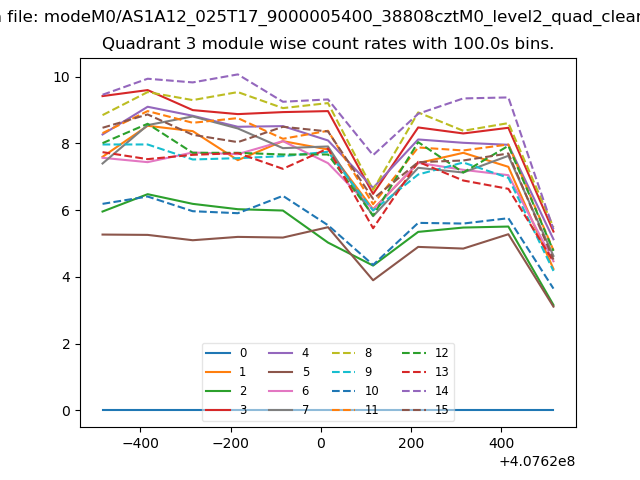
| Module-wise count rates for Quadrant A Data is divided into 100 sec bins |
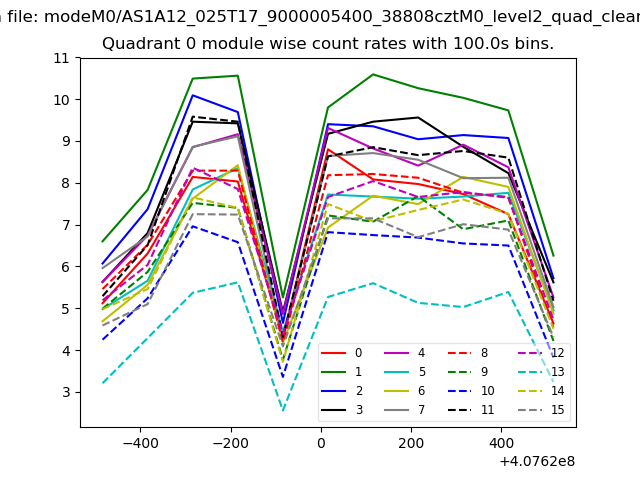 |
 |
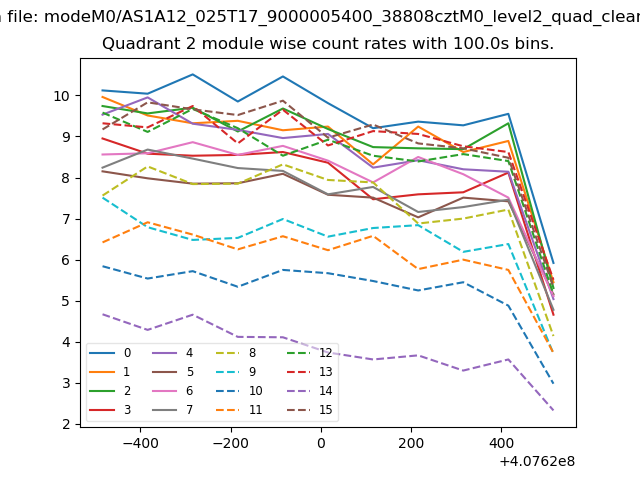
| Module-wise count rates for Quadrant B Data is divided into 100 sec bins |
 |
 |
| Module-wise count rates for Quadrant C Data is divided into 100 sec bins |
 |
 |
| Module-wise count rates for Quadrant D Data is divided into 100 sec bins |
 |
 |
| Parameter | Plot |
|---|---|
| CZT HV Monitor | 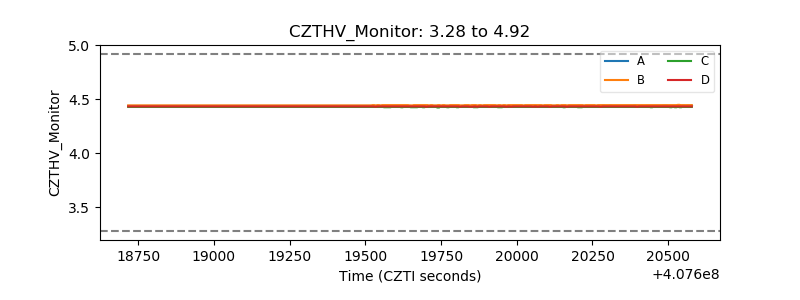 |
| D_VDD | 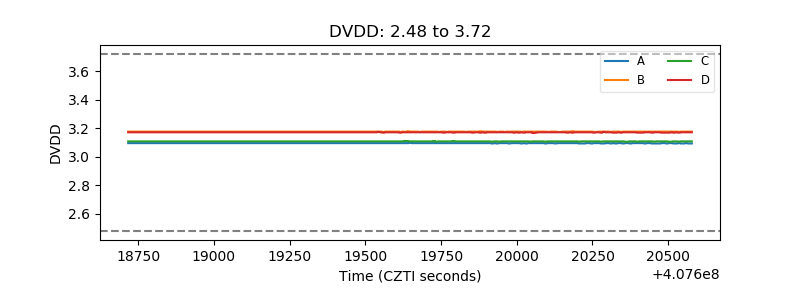 |
| Temperature 1 | 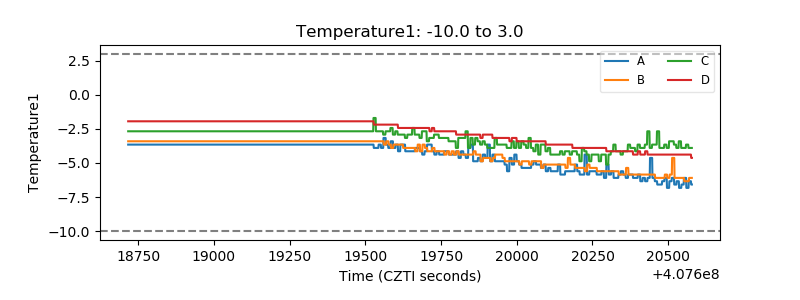 |
| Veto HV Monitor | 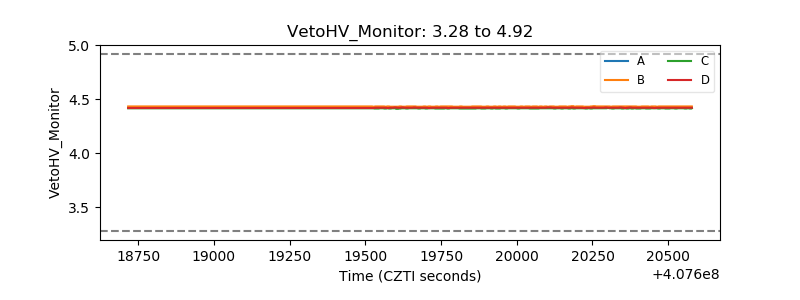 |
| Veto LLD | 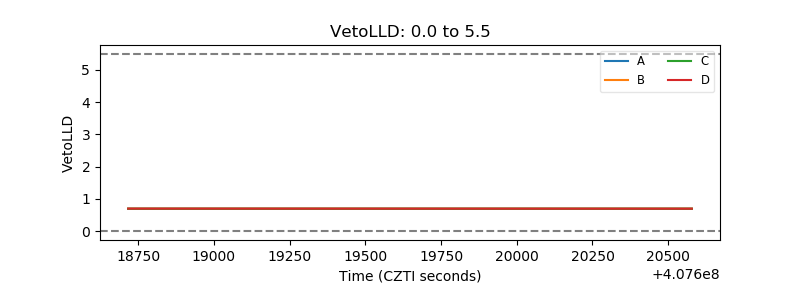 |
| Alpha Counter | 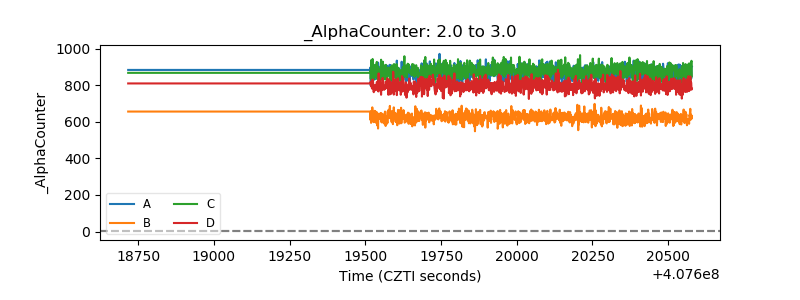 |
| _CPM_Rate | 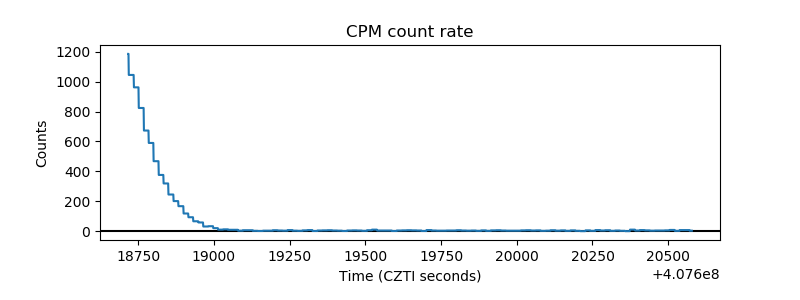 |
| CZT Counter | 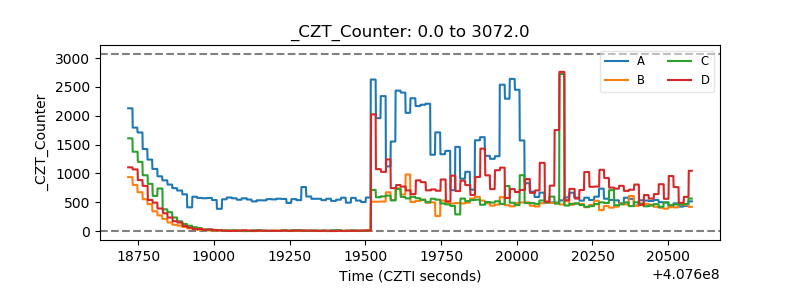 |
| +2.5 Volts monitor | 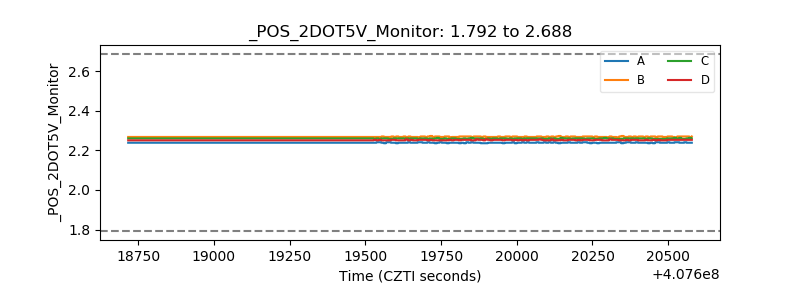 |
| +5 Volts monitor | 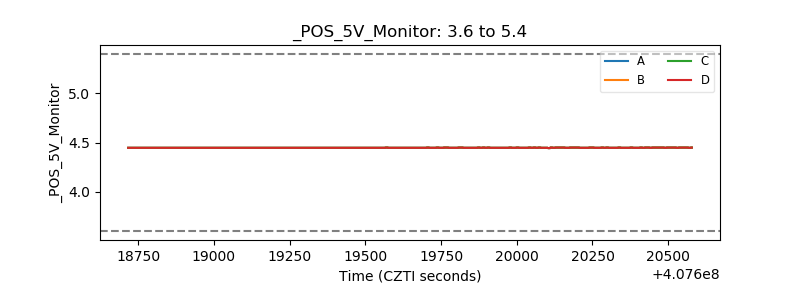 |
| _ROLL_ROT | 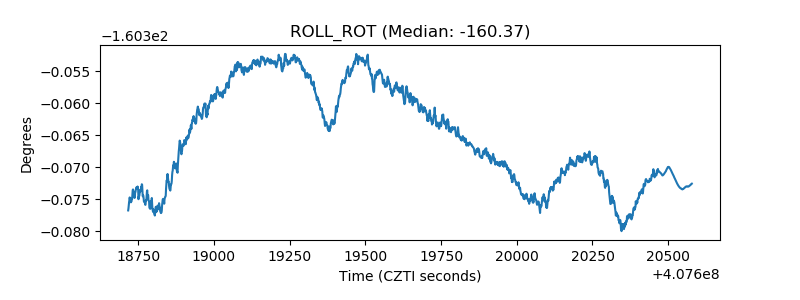 |
| _Roll_DEC | 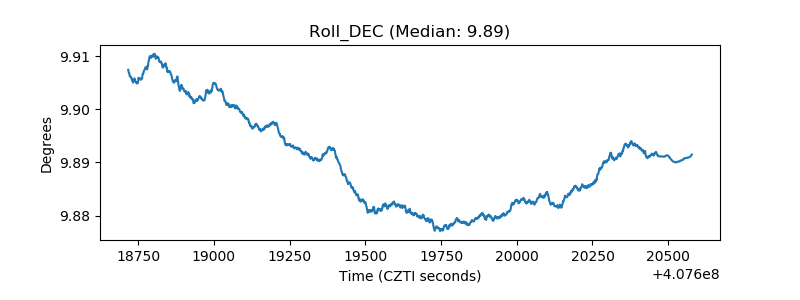 |
| _Roll_RA | 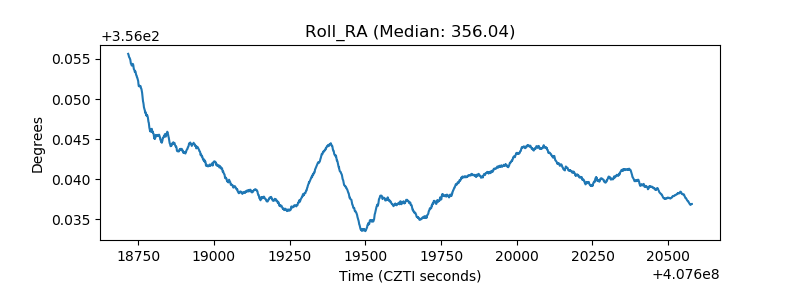 |
| Veto Counter | 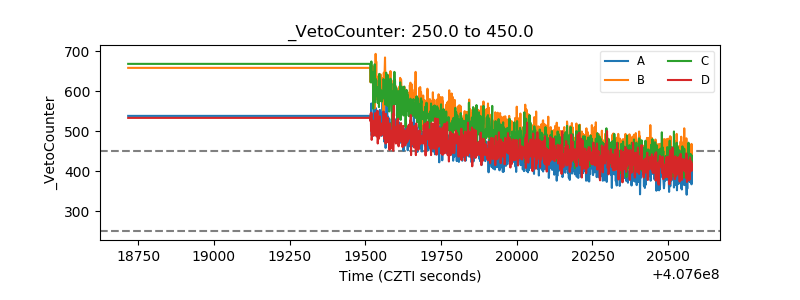 |