| Param | Original file | Final file |
|---|---|---|
| Filename | modeM0/AS1A12_061T07_9000005402_38809cztM0_level2.fits | modeM0/AS1A12_061T07_9000005402_38809cztM0_level2_quad_clean.evt |
| Size (bytes) | 364,921,920 | 95,613,120 |
| Size | 348.0 MB | 91.2 MB |
| Events in quadrant A | 3,064,048 | 656,805 |
| Events in quadrant B | 2,731,327 | 684,802 |
| Events in quadrant C | 2,663,385 | 638,918 |
| Events in quadrant D | 4,645,162 | 551,100 |
| Mode M9 | |||
|---|---|---|---|
| Quadrant | BADHDUFLAG | Total packets | Discarded packets |
| A | 0 | 31 | 0 |
| B | 0 | 31 | 0 |
| C | 0 | 31 | 0 |
| D | 0 | 32 | 0 |
| Mode SS | |||
|---|---|---|---|
| Quadrant | BADHDUFLAG | Total packets | Discarded packets |
| A | 0 | 106 | 0 |
| B | 0 | 106 | 0 |
| C | 0 | 106 | 0 |
| D | 0 | 106 | 0 |
| Mode M0 | |||
|---|---|---|---|
| Quadrant | BADHDUFLAG | Total packets | Discarded packets |
| A | 0 | 12274 | 3 |
| B | 0 | 11300 | 2 |
| C | 0 | 10843 | 2 |
| D | 0 | 17509 | 2 |
| Quadrant | Total seconds | Saturated seconds | Saturation percentage |
|---|---|---|---|
| A | 5196 | 14 | 0.269438% |
| B | 5196 | 27 | 0.519630% |
| C | 5196 | 9 | 0.173210% |
| D | 5196 | 346 | 6.658968% |
Noise dominated data is calculated using 1-second bins in cleaned event files. If a bin has >2000 counts, and if more than 50% of those come from <1% of pixels, then it is considered to be noise-dominated and hence unusable.
| Quadrant | # 1 sec bins | Bins with >0 counts | Bins with >2000 counts | High rate bins dominated by noise | Noise dominated (total time) | Noise dominated (detector-on time) | Marked lightcurve |
|---|---|---|---|---|---|---|---|
| A | 7259 | 5197 | 8 | 8 | 0.11% | 0.15% | 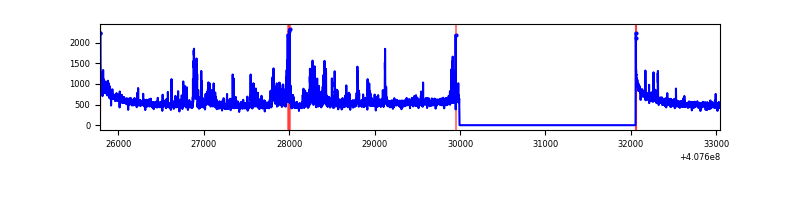 |
| B | 7259 | 5197 | 17 | 17 | 0.23% | 0.33% | 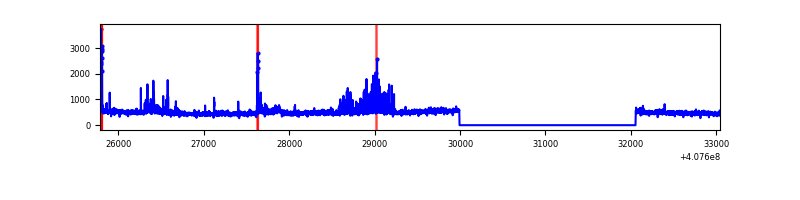 |
| C | 7259 | 5197 | 4 | 4 | 0.06% | 0.08% | 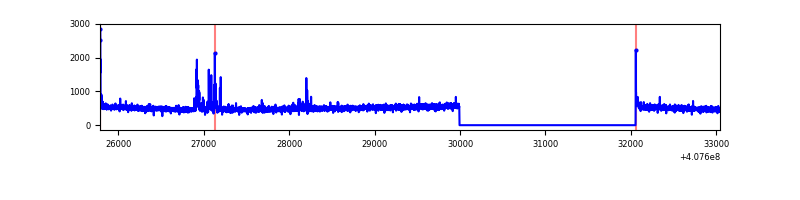 |
| D | 7259 | 5197 | 303 | 303 | 4.17% | 5.83% | 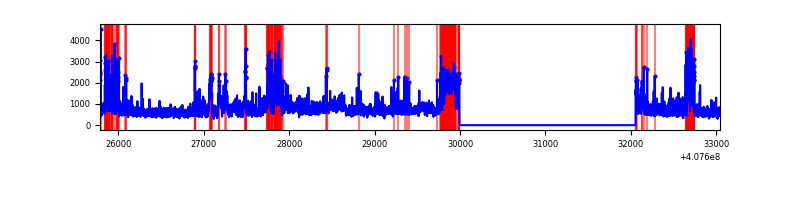 |
Top three noisy pixels from each quadrant. If the there are fewer than three noisy pixels in the level2.evt file, extra rows are filled as -1
| Pixel properties | Quadrant properties | ||||||
|---|---|---|---|---|---|---|---|
| Quadrant | DetID | PixID | Counts | Sigma | Mean | Median | Sigma |
| A | 10 | 83 | 385811 | 3164.87 | 604 | 593 | 121.7 |
| A | 12 | 16 | 255557 | 2094.73 | 604 | 593 | 121.7 |
| A | 12 | 194 | 40920 | 331.32 | 604 | 593 | 121.7 |
| B | 5 | 200 | 146876 | 1261.38 | 610 | 595 | 116.0 |
| B | 5 | 184 | 92371 | 791.38 | 610 | 595 | 116.0 |
| B | 0 | 230 | 56502 | 482.08 | 610 | 595 | 116.0 |
| C | 15 | 214 | 230762 | 1649.82 | 599 | 604 | 139.5 |
| C | 0 | 239 | 58920 | 418.02 | 599 | 604 | 139.5 |
| C | 0 | 10 | 26032 | 182.27 | 599 | 604 | 139.5 |
| D | 2 | 16 | 734648 | 5246.19 | 575 | 560 | 139.9 |
| D | 12 | 235 | 625779 | 4468.15 | 575 | 560 | 139.9 |
| D | 12 | 227 | 493200 | 3520.67 | 575 | 560 | 139.9 |
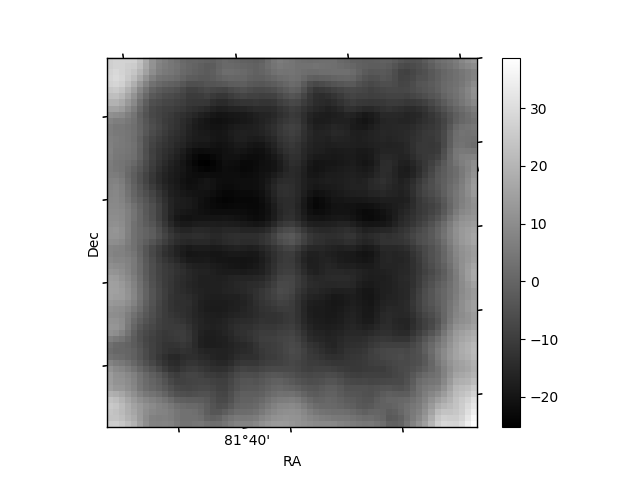
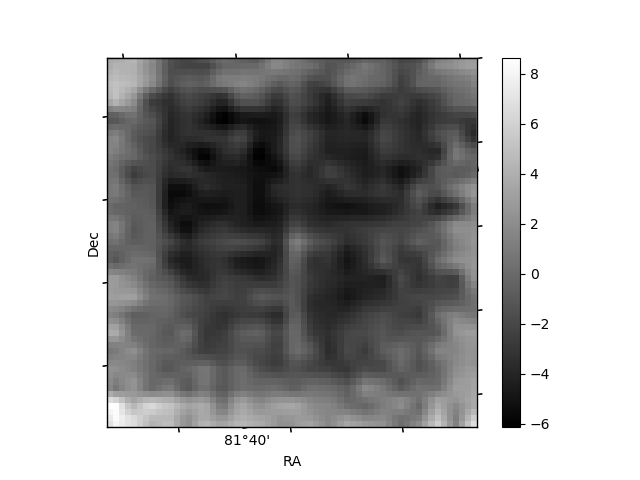
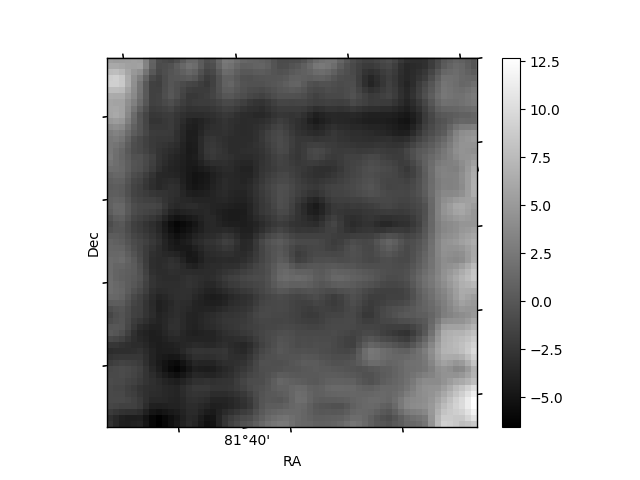
Histogram calculated using DETX and DETY for each event in the final _common_clean file
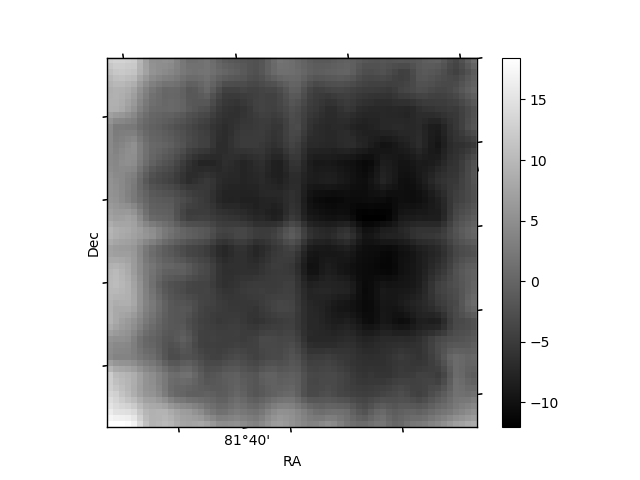
| Quadrant A | 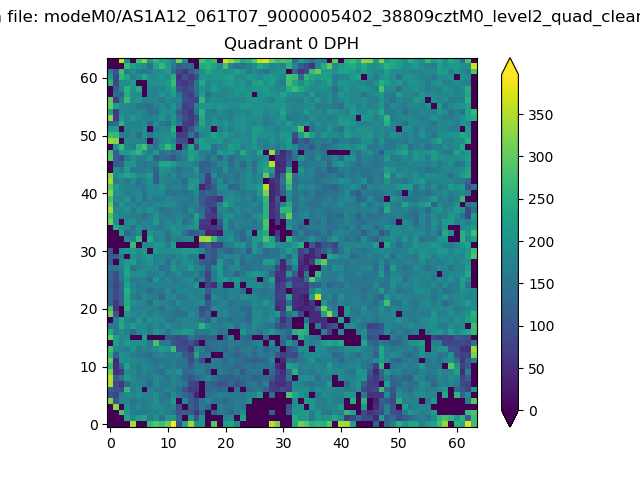 |
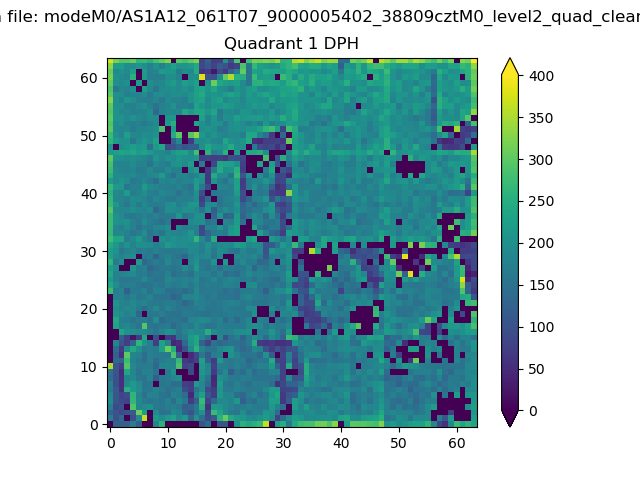 |
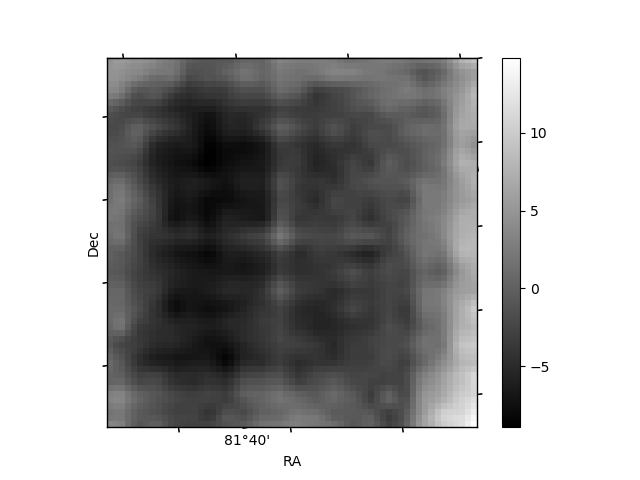
Quadrant B |
|---|---|---|---|
| Quadrant D | 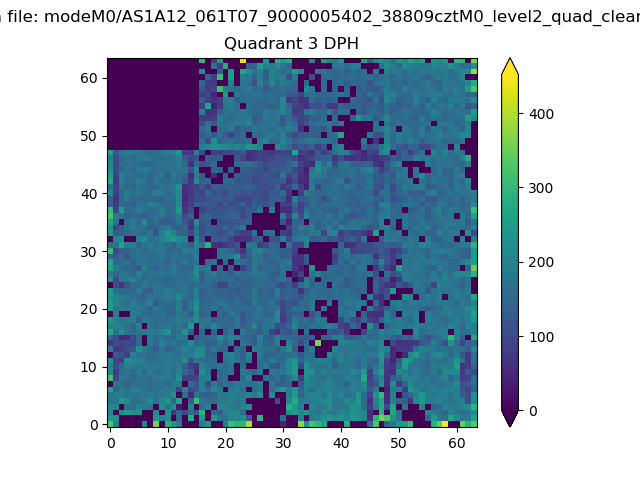 |
 |
Quadrant C |
| Plot type | Count rate plots | Images |
|---|---|---|
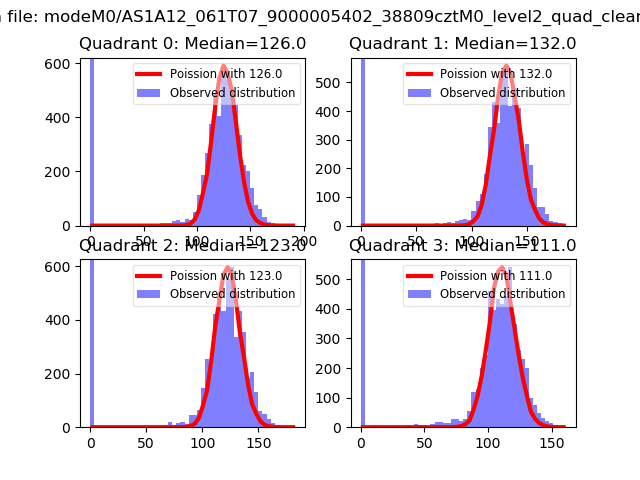
| Comparison with Poisson distribution Blue bars denote a histogram of data divided into 1 sec bins. Red curve is a Poisson curve with rate = median count rate of data. |
 |
 |
| Quadrant-wise count rates Data is divided into 100 sec bins |
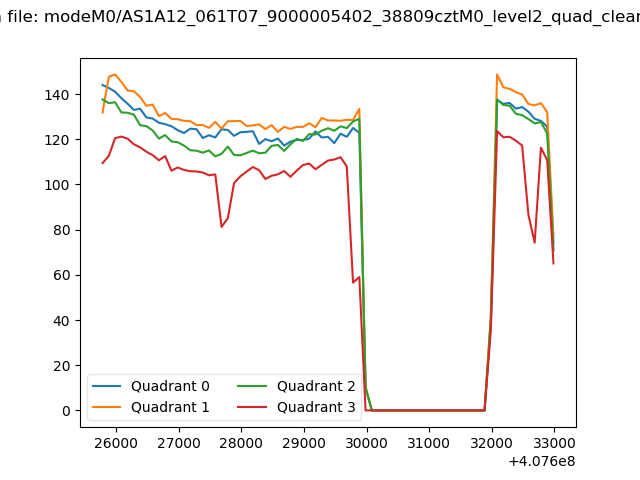 |
|
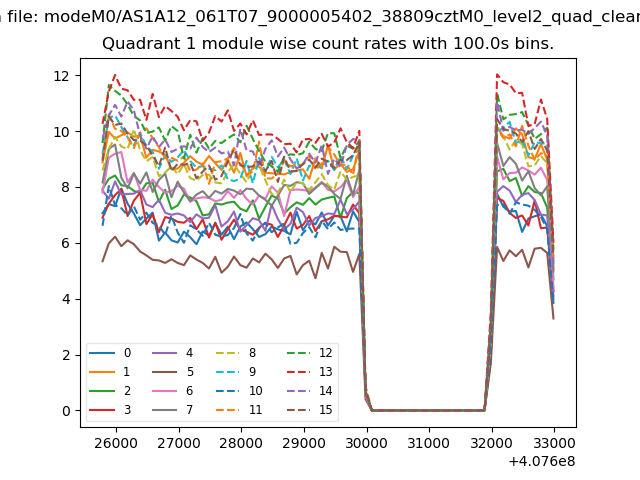
| Module-wise count rates for Quadrant A Data is divided into 100 sec bins |
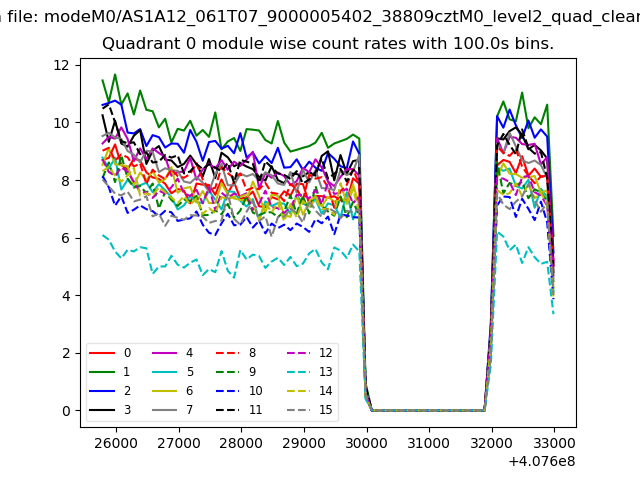 |
 |
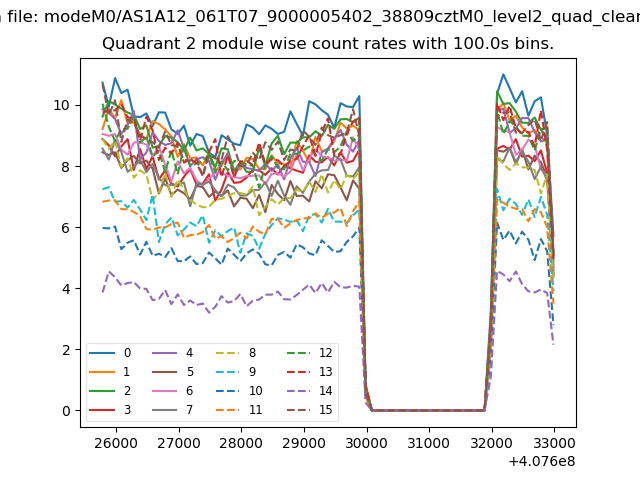
| Module-wise count rates for Quadrant B Data is divided into 100 sec bins |
 |
 |
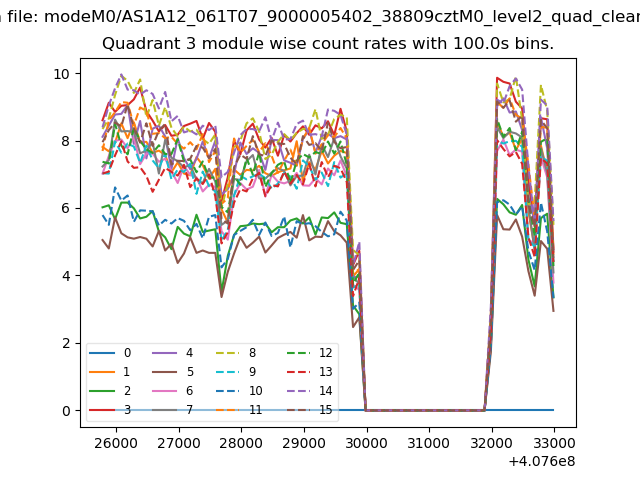
| Module-wise count rates for Quadrant C Data is divided into 100 sec bins |
 |
 |
| Module-wise count rates for Quadrant D Data is divided into 100 sec bins |
 |
 |
| Parameter | Plot |
|---|---|
| CZT HV Monitor |  |
| D_VDD | 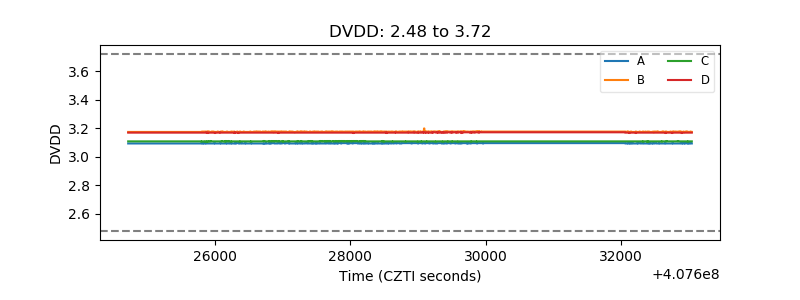 |
| Temperature 1 | 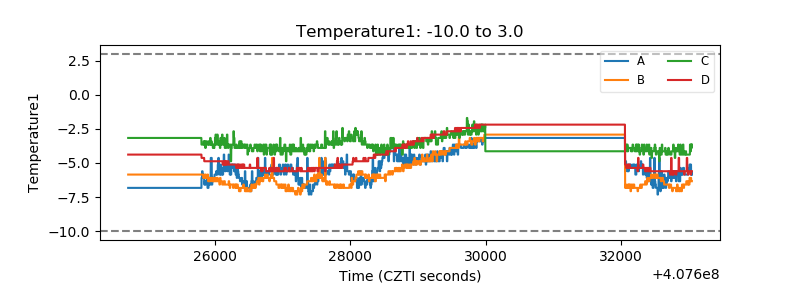 |
| Veto HV Monitor | 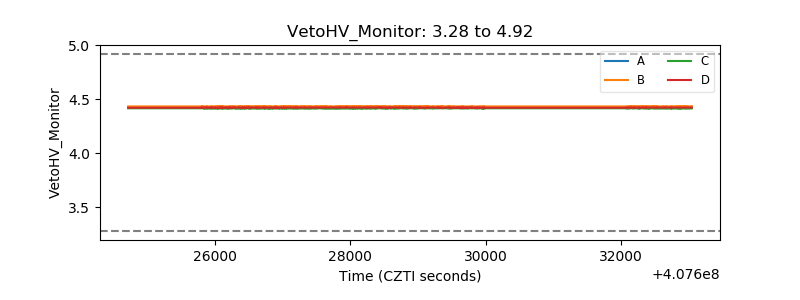 |
| Veto LLD | 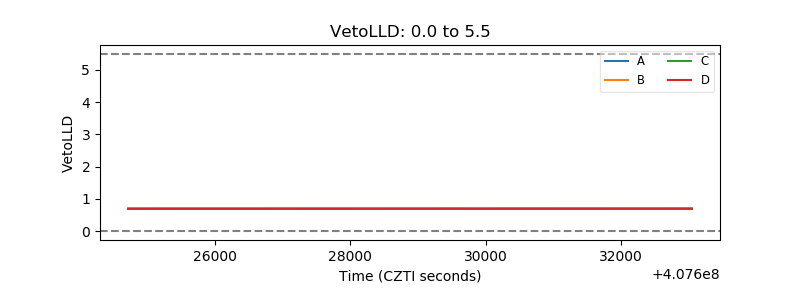 |
| Alpha Counter | 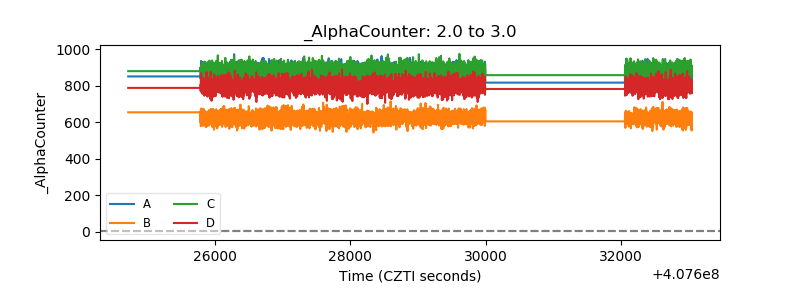 |
| _CPM_Rate | 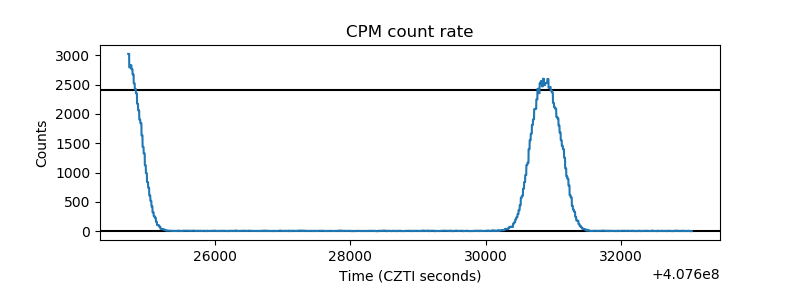 |
| CZT Counter | 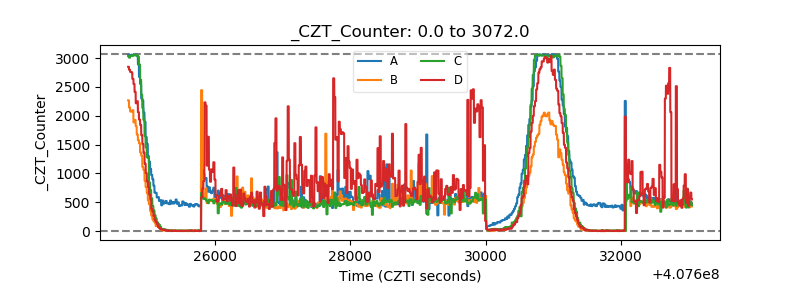 |
| +2.5 Volts monitor | 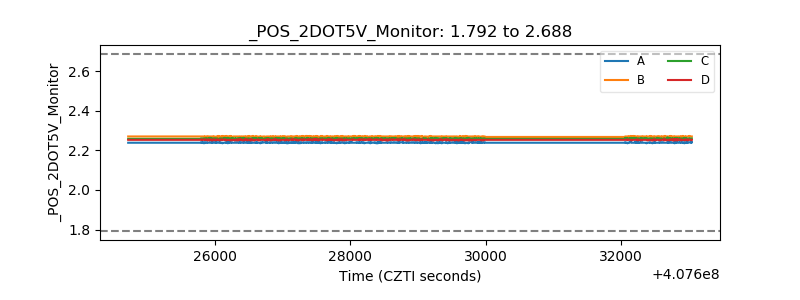 |
| +5 Volts monitor | 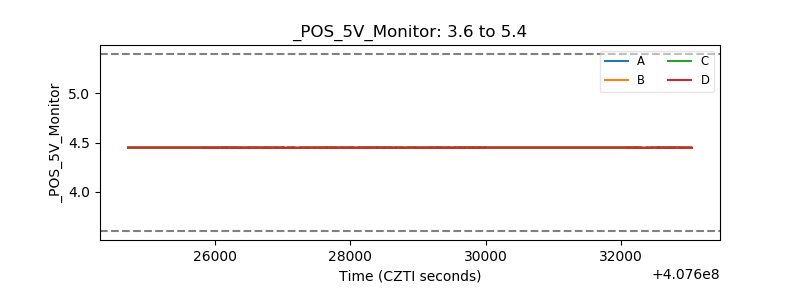 |
| _ROLL_ROT | 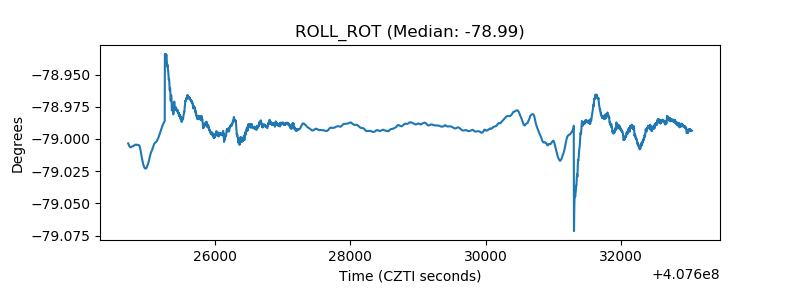 |
| _Roll_DEC | 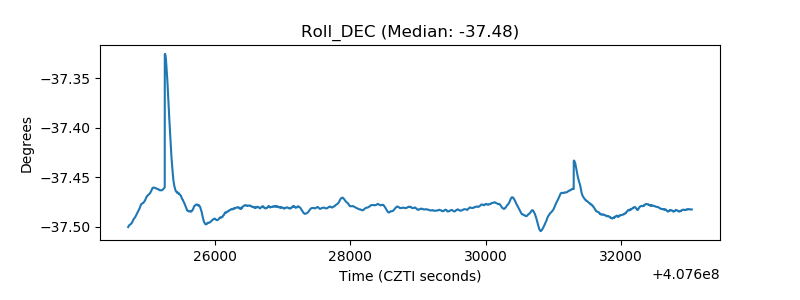 |
| _Roll_RA | 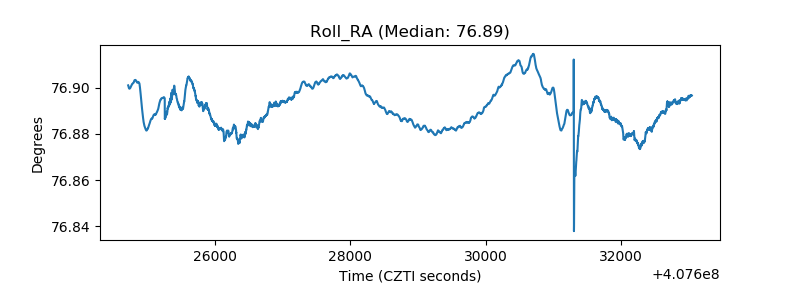 |
| Veto Counter | 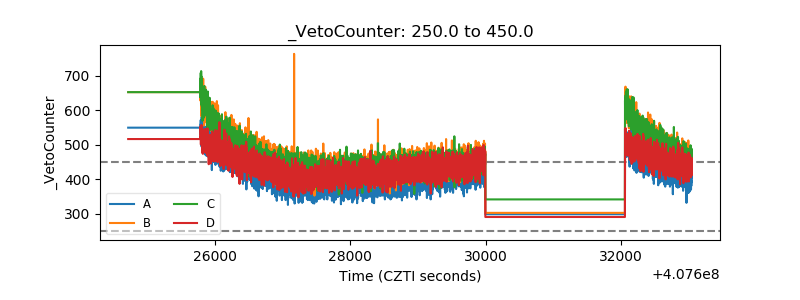 |