| Param | Original file | Final file |
|---|---|---|
| Filename | modeM0/AS1A12_061T07_9000005402_38810cztM0_level2.fits | modeM0/AS1A12_061T07_9000005402_38810cztM0_level2_quad_clean.evt |
| Size (bytes) | 341,069,760 | 91,229,760 |
| Size | 325.3 MB | 87.0 MB |
| Events in quadrant A | 2,791,828 | 620,145 |
| Events in quadrant B | 2,390,597 | 652,228 |
| Events in quadrant C | 2,500,969 | 612,523 |
| Events in quadrant D | 4,550,775 | 526,232 |
| Mode M9 | |||
|---|---|---|---|
| Quadrant | BADHDUFLAG | Total packets | Discarded packets |
| A | 0 | 39 | 0 |
| B | 0 | 39 | 0 |
| C | 0 | 39 | 0 |
| D | 0 | 40 | 0 |
| Mode SS | |||
|---|---|---|---|
| Quadrant | BADHDUFLAG | Total packets | Discarded packets |
| A | 0 | 100 | 0 |
| B | 0 | 100 | 0 |
| C | 0 | 100 | 0 |
| D | 0 | 100 | 0 |
| Mode M0 | |||
|---|---|---|---|
| Quadrant | BADHDUFLAG | Total packets | Discarded packets |
| A | 0 | 11316 | 3 |
| B | 0 | 10307 | 2 |
| C | 0 | 10242 | 2 |
| D | 0 | 17054 | 2 |
| Quadrant | Total seconds | Saturated seconds | Saturation percentage |
|---|---|---|---|
| A | 5023 | 20 | 0.398168% |
| B | 5023 | 11 | 0.218993% |
| C | 5023 | 5 | 0.099542% |
| D | 5023 | 330 | 6.569779% |
Noise dominated data is calculated using 1-second bins in cleaned event files. If a bin has >2000 counts, and if more than 50% of those come from <1% of pixels, then it is considered to be noise-dominated and hence unusable.
| Quadrant | # 1 sec bins | Bins with >0 counts | Bins with >2000 counts | High rate bins dominated by noise | Noise dominated (total time) | Noise dominated (detector-on time) | Marked lightcurve |
|---|---|---|---|---|---|---|---|
| A | 7146 | 5024 | 17 | 17 | 0.24% | 0.34% | 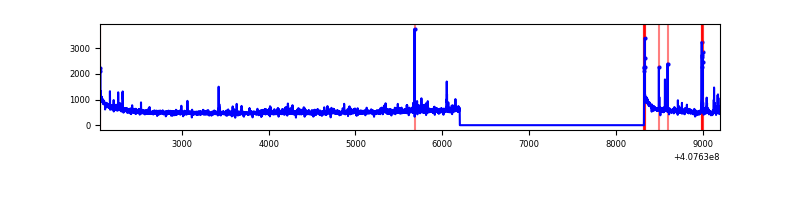 |
| B | 7146 | 5024 | 3 | 3 | 0.04% | 0.06% | 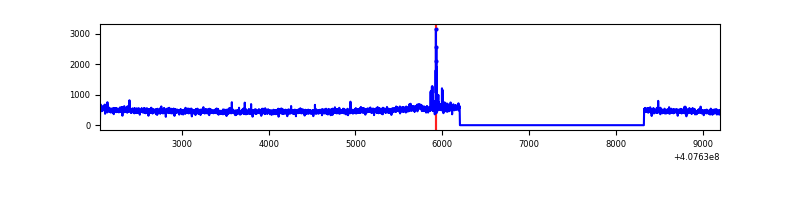 |
| C | 7146 | 5024 | 2 | 2 | 0.03% | 0.04% | 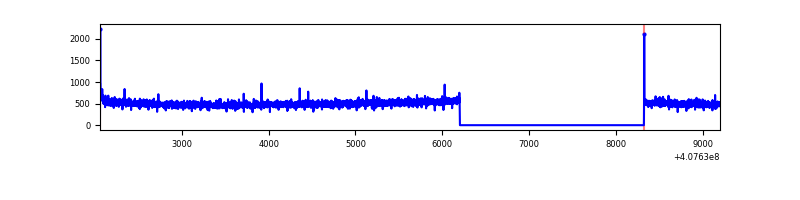 |
| D | 7146 | 5024 | 278 | 278 | 3.89% | 5.53% | 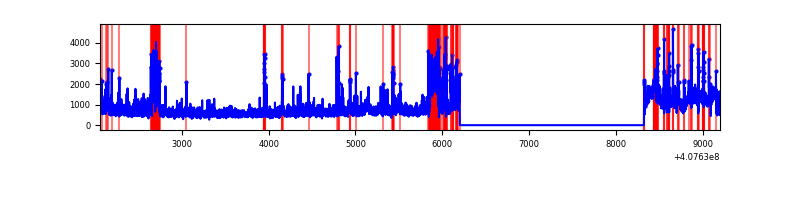 |
Top three noisy pixels from each quadrant. If the there are fewer than three noisy pixels in the level2.evt file, extra rows are filled as -1
| Pixel properties | Quadrant properties | ||||||
|---|---|---|---|---|---|---|---|
| Quadrant | DetID | PixID | Counts | Sigma | Mean | Median | Sigma |
| A | 10 | 83 | 373865 | 3195.56 | 579 | 569 | 116.8 |
| A | 13 | 248 | 74718 | 634.74 | 579 | 569 | 116.8 |
| A | 12 | 16 | 47628 | 402.84 | 579 | 569 | 116.8 |
| B | 0 | 230 | 50422 | 440.17 | 587 | 572 | 113.3 |
| B | 4 | 170 | 28644 | 247.87 | 587 | 572 | 113.3 |
| B | 12 | 111 | 13830 | 117.07 | 587 | 572 | 113.3 |
| C | 15 | 214 | 224407 | 1668.75 | 579 | 583 | 134.1 |
| C | 0 | 10 | 17578 | 126.71 | 579 | 583 | 134.1 |
| C | 13 | 61 | 3881 | 24.59 | 579 | 583 | 134.1 |
| D | 12 | 227 | 1110062 | 8286.48 | 553 | 538 | 133.9 |
| D | 2 | 16 | 586542 | 4376.57 | 553 | 538 | 133.9 |
| D | 2 | 249 | 317820 | 2369.62 | 553 | 538 | 133.9 |
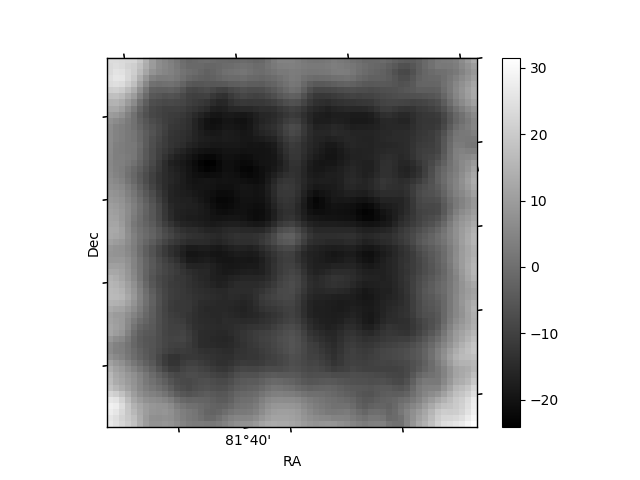
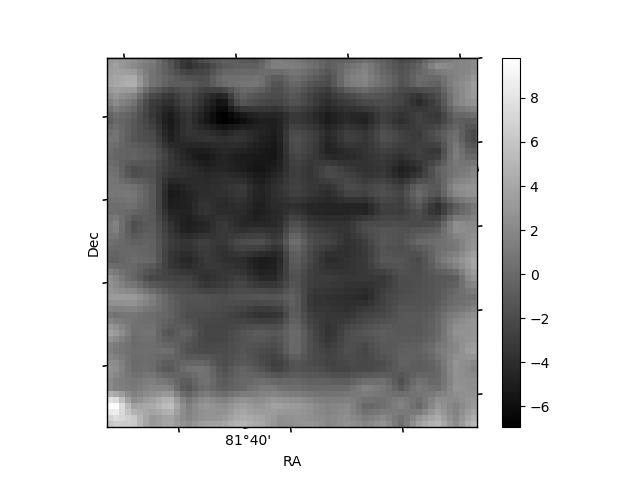
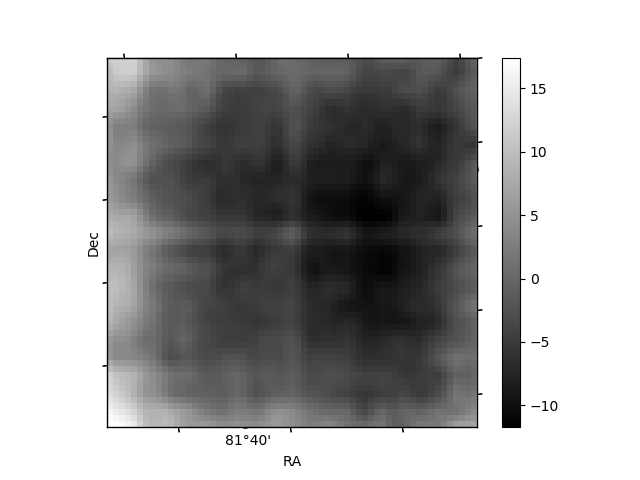
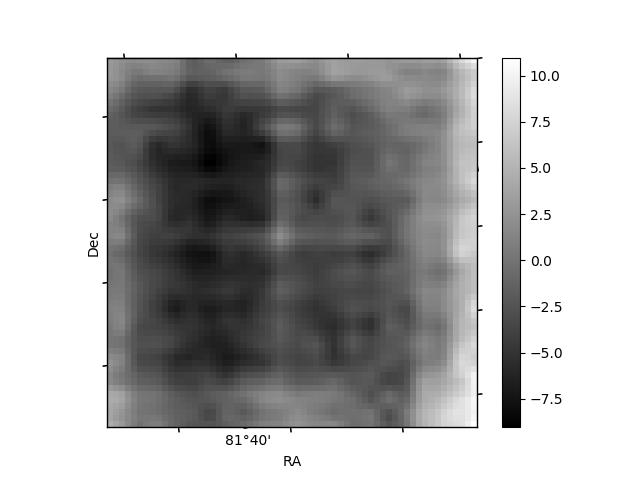
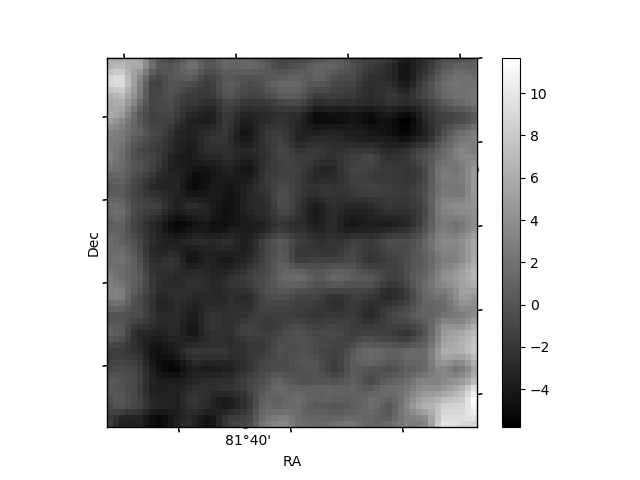
Histogram calculated using DETX and DETY for each event in the final _common_clean file
| Quadrant A | 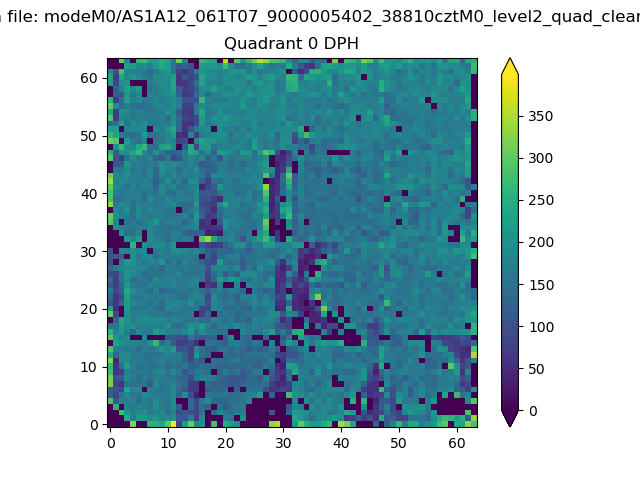 |
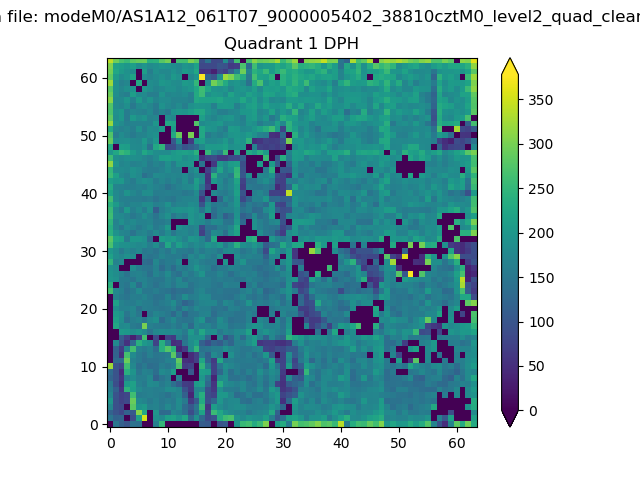 |
Quadrant B |
|---|---|---|---|
| Quadrant D | 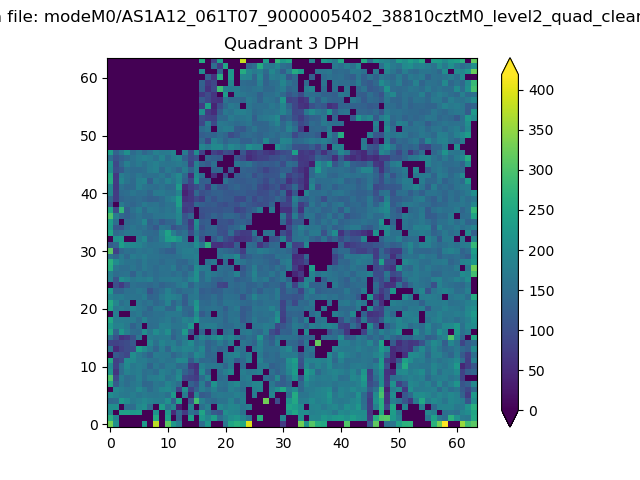 |
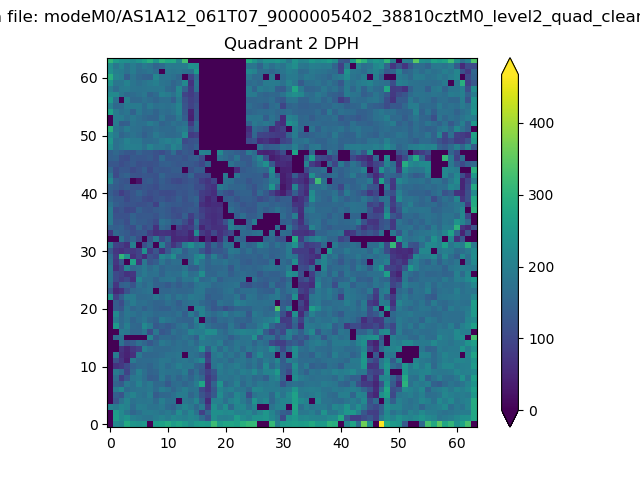 |
Quadrant C |
| Plot type | Count rate plots | Images |
|---|---|---|
| Comparison with Poisson distribution Blue bars denote a histogram of data divided into 1 sec bins. Red curve is a Poisson curve with rate = median count rate of data. |
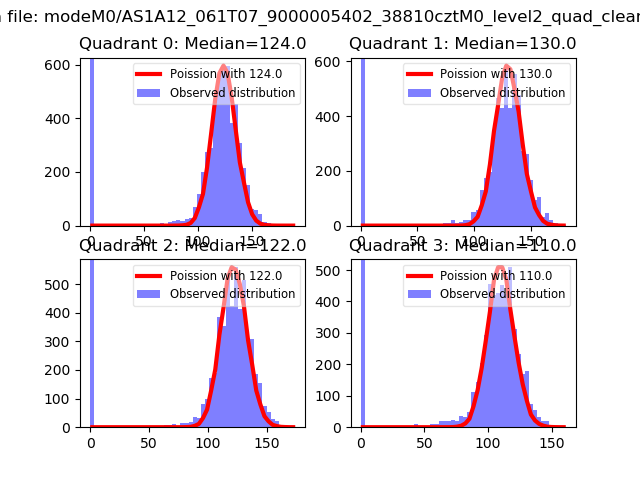 |
 |
| Quadrant-wise count rates Data is divided into 100 sec bins |
 |
|
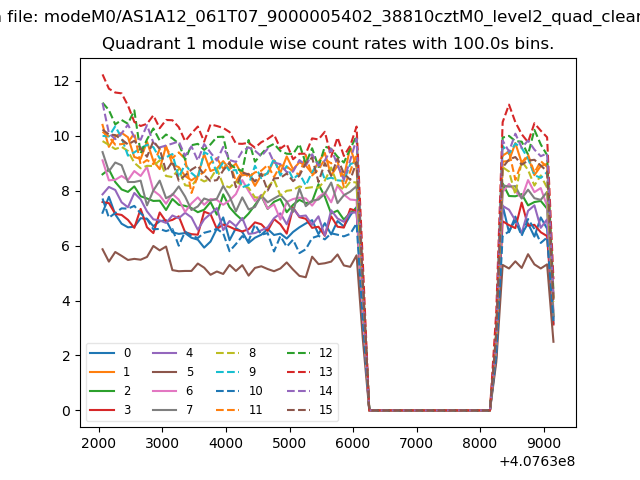
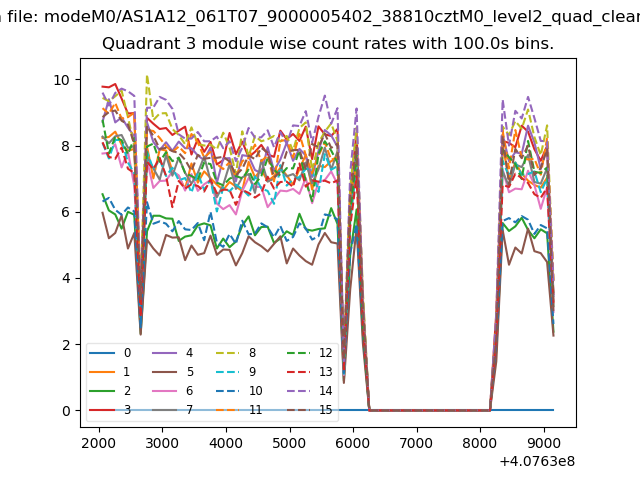
| Module-wise count rates for Quadrant A Data is divided into 100 sec bins |
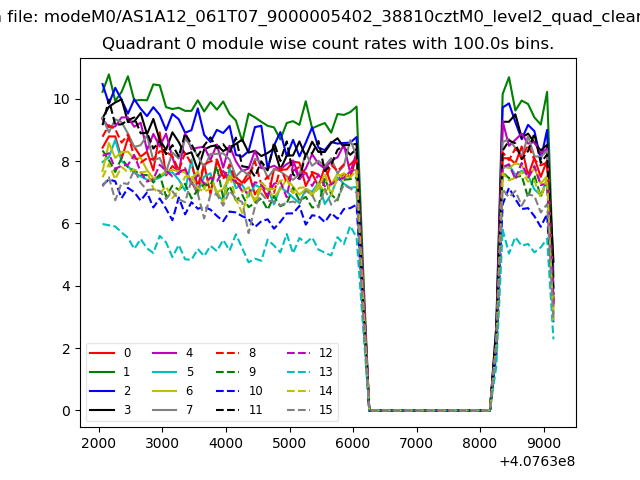 |
 |
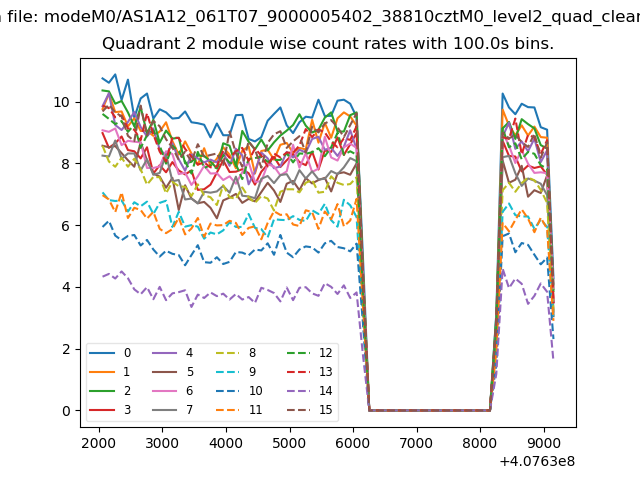
| Module-wise count rates for Quadrant B Data is divided into 100 sec bins |
 |
 |
| Module-wise count rates for Quadrant C Data is divided into 100 sec bins |
 |
 |
| Module-wise count rates for Quadrant D Data is divided into 100 sec bins |
 |
 |
| Parameter | Plot |
|---|---|
| CZT HV Monitor | 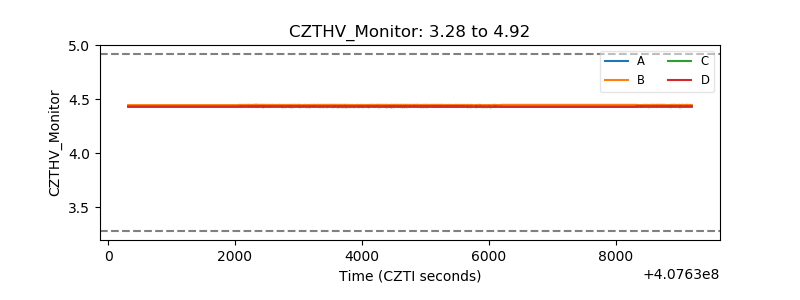 |
| D_VDD | 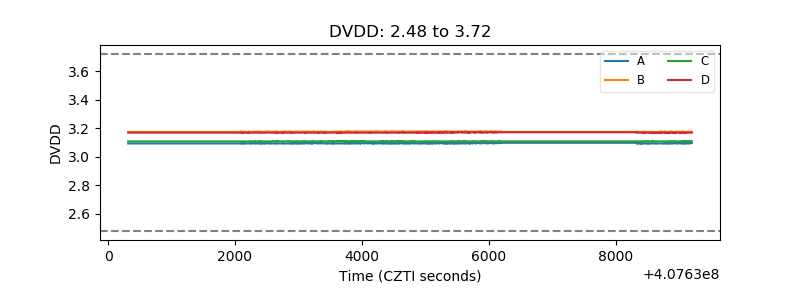 |
| Temperature 1 | 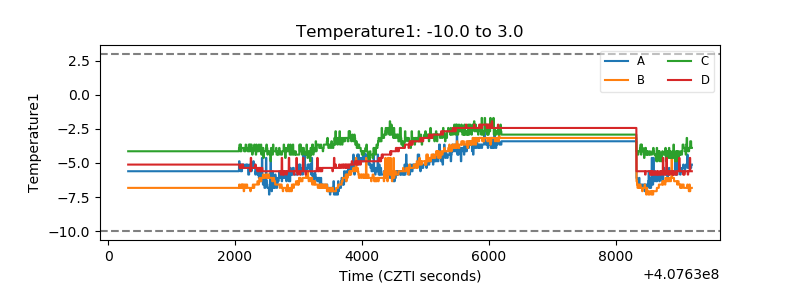 |
| Veto HV Monitor | 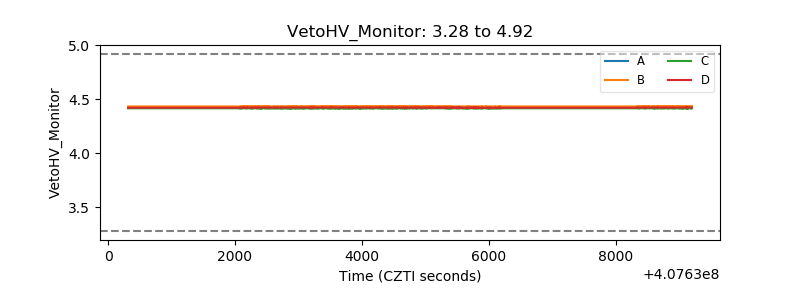 |
| Veto LLD | 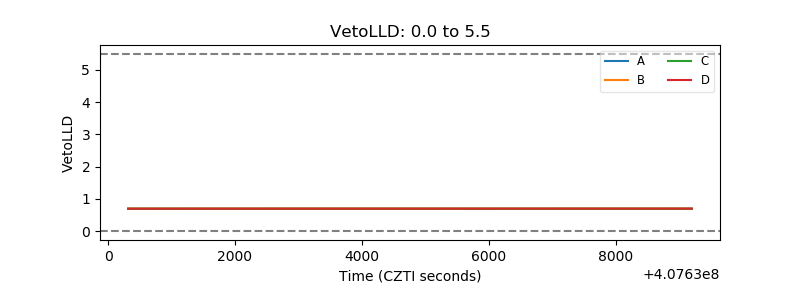 |
| Alpha Counter | 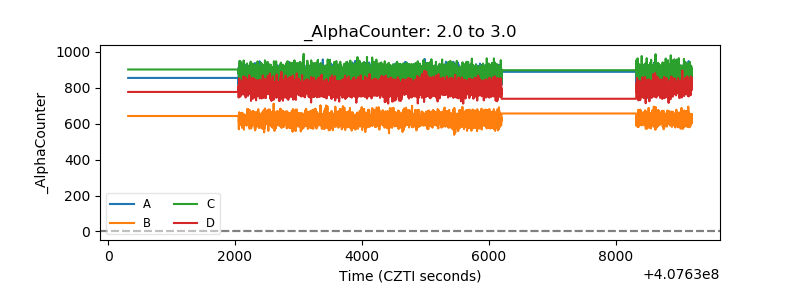 |
| _CPM_Rate | 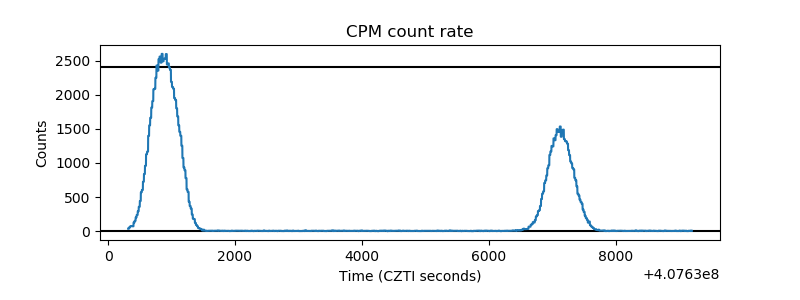 |
| CZT Counter | 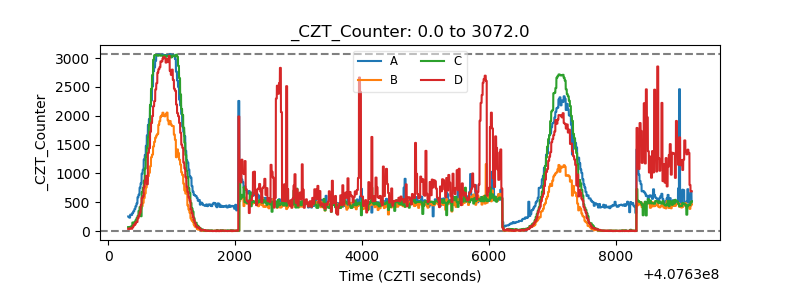 |
| +2.5 Volts monitor | 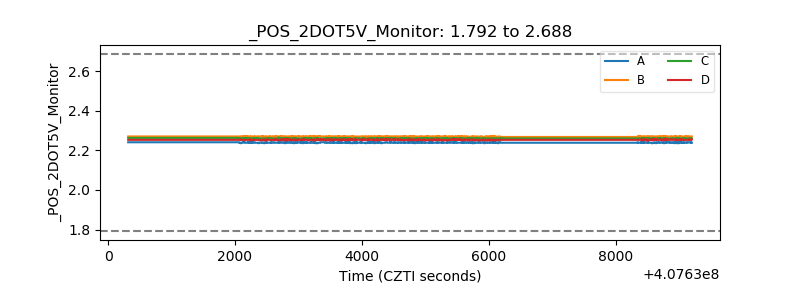 |
| +5 Volts monitor | 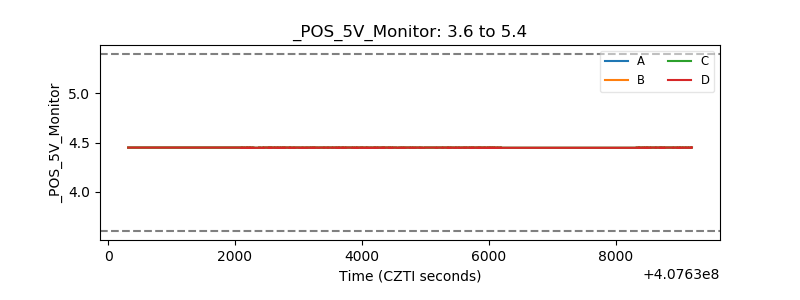 |
| _ROLL_ROT | 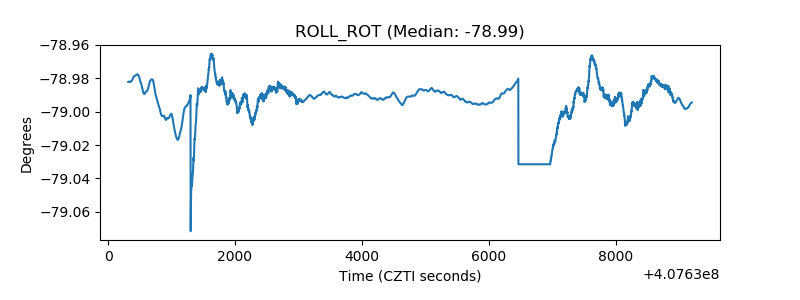 |
| _Roll_DEC | 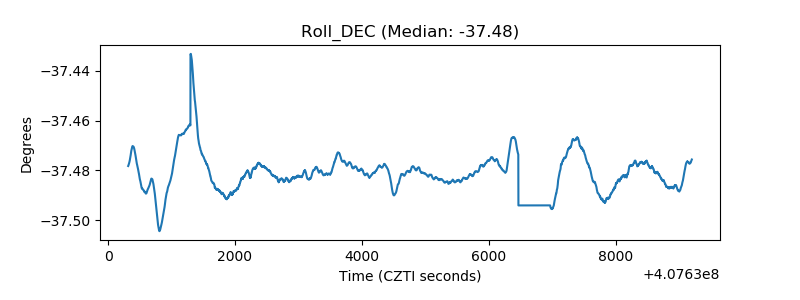 |
| _Roll_RA | 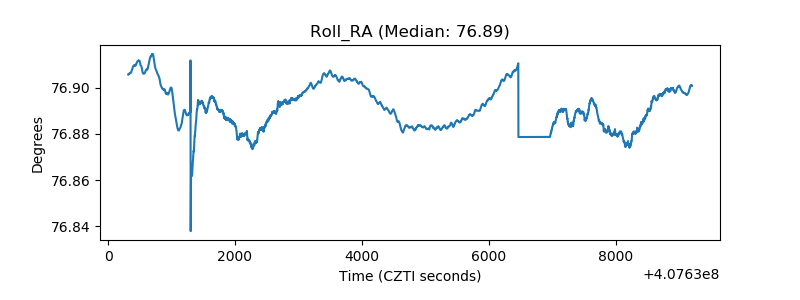 |
| Veto Counter | 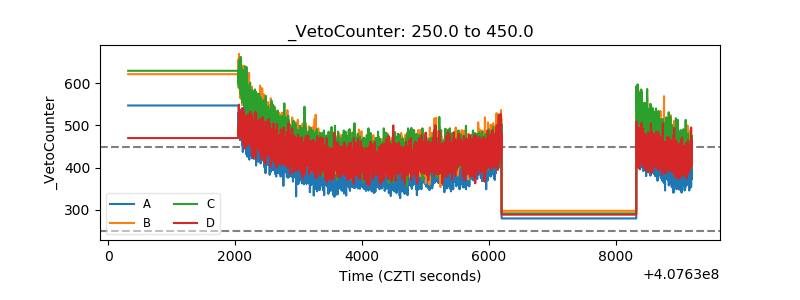 |