| Param | Original file | Final file |
|---|---|---|
| Filename | modeM0/AS1A12_061T07_9000005402_38812cztM0_level2.fits | modeM0/AS1A12_061T07_9000005402_38812cztM0_level2_quad_clean.evt |
| Size (bytes) | 335,900,160 | 87,120,000 |
| Size | 320.3 MB | 83.1 MB |
| Events in quadrant A | 2,997,126 | 585,061 |
| Events in quadrant B | 2,338,106 | 609,256 |
| Events in quadrant C | 2,568,642 | 576,594 |
| Events in quadrant D | 4,130,986 | 508,357 |
| Mode M9 | |||
|---|---|---|---|
| Quadrant | BADHDUFLAG | Total packets | Discarded packets |
| A | 0 | 41 | 0 |
| B | 0 | 41 | 0 |
| C | 0 | 41 | 0 |
| D | 0 | 41 | 0 |
| Mode SS | |||
|---|---|---|---|
| Quadrant | BADHDUFLAG | Total packets | Discarded packets |
| A | 0 | 106 | 0 |
| B | 0 | 106 | 0 |
| C | 0 | 106 | 0 |
| D | 0 | 106 | 0 |
| Mode M0 | |||
|---|---|---|---|
| Quadrant | BADHDUFLAG | Total packets | Discarded packets |
| A | 0 | 12029 | 3 |
| B | 0 | 10336 | 2 |
| C | 0 | 10610 | 2 |
| D | 0 | 15909 | 2 |
| Quadrant | Total seconds | Saturated seconds | Saturation percentage |
|---|---|---|---|
| A | 5124 | 29 | 0.565964% |
| B | 5124 | 9 | 0.175644% |
| C | 5124 | 6 | 0.117096% |
| D | 5124 | 288 | 5.620609% |
Noise dominated data is calculated using 1-second bins in cleaned event files. If a bin has >2000 counts, and if more than 50% of those come from <1% of pixels, then it is considered to be noise-dominated and hence unusable.
| Quadrant | # 1 sec bins | Bins with >0 counts | Bins with >2000 counts | High rate bins dominated by noise | Noise dominated (total time) | Noise dominated (detector-on time) | Marked lightcurve |
|---|---|---|---|---|---|---|---|
| A | 9220 | 5126 | 29 | 29 | 0.31% | 0.57% | 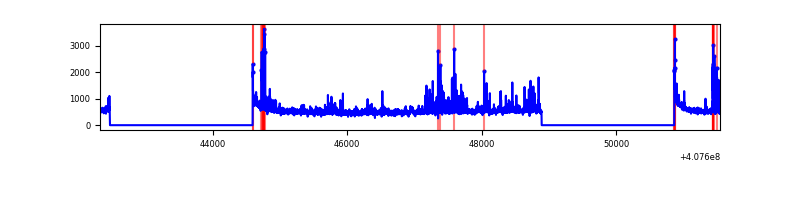 |
| B | 9220 | 5126 | 0 | 0 | 0.00% | 0.00% | 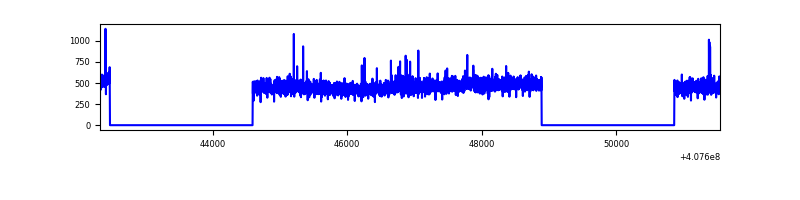 |
| C | 9220 | 5126 | 6 | 6 | 0.07% | 0.12% | 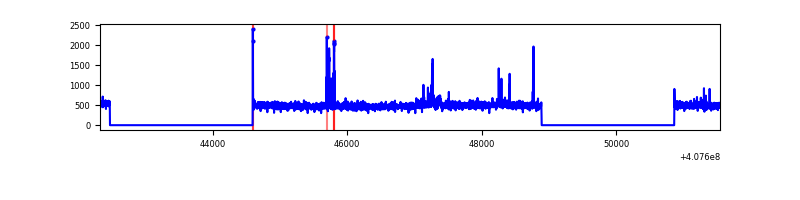 |
| D | 9220 | 5126 | 221 | 221 | 2.40% | 4.31% |  |
Top three noisy pixels from each quadrant. If the there are fewer than three noisy pixels in the level2.evt file, extra rows are filled as -1
| Pixel properties | Quadrant properties | ||||||
|---|---|---|---|---|---|---|---|
| Quadrant | DetID | PixID | Counts | Sigma | Mean | Median | Sigma |
| A | 10 | 83 | 382712 | 3255.47 | 577 | 565 | 117.4 |
| A | 13 | 248 | 340479 | 2895.69 | 577 | 565 | 117.4 |
| A | 12 | 16 | 25875 | 215.61 | 577 | 565 | 117.4 |
| B | 0 | 230 | 29776 | 258.13 | 577 | 560 | 113.2 |
| B | 4 | 170 | 16242 | 138.55 | 577 | 560 | 113.2 |
| B | 12 | 111 | 14137 | 119.95 | 577 | 560 | 113.2 |
| C | 15 | 214 | 231812 | 1722.14 | 571 | 573 | 134.3 |
| C | 0 | 239 | 74008 | 546.9 | 571 | 573 | 134.3 |
| C | 15 | 159 | 13950 | 99.62 | 571 | 573 | 134.3 |
| D | 2 | 249 | 663155 | 4887.74 | 552 | 537 | 135.6 |
| D | 2 | 16 | 543026 | 4001.62 | 552 | 537 | 135.6 |
| D | 12 | 235 | 311900 | 2296.74 | 552 | 537 | 135.6 |
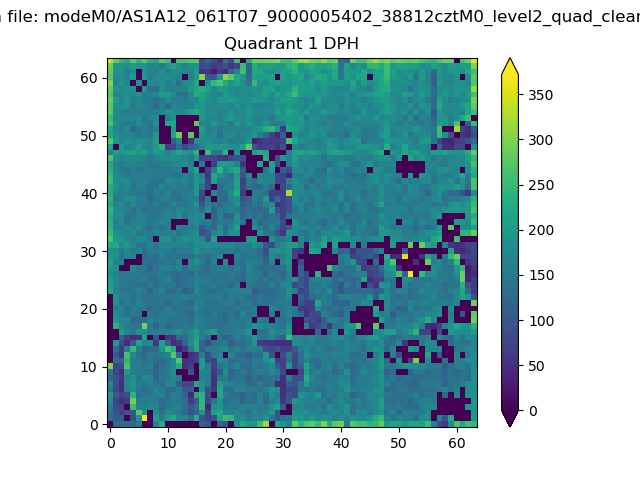
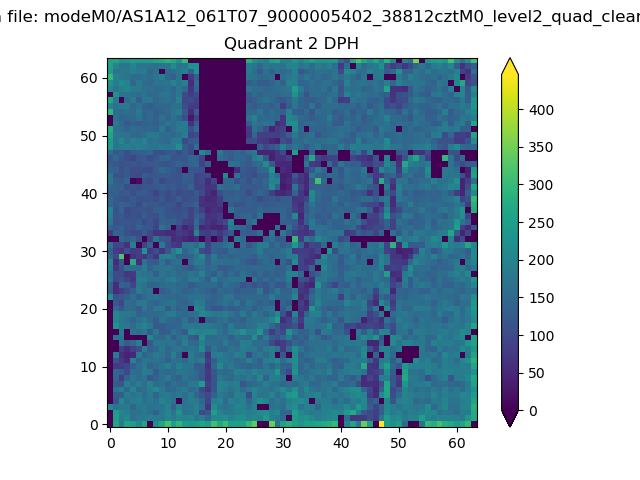
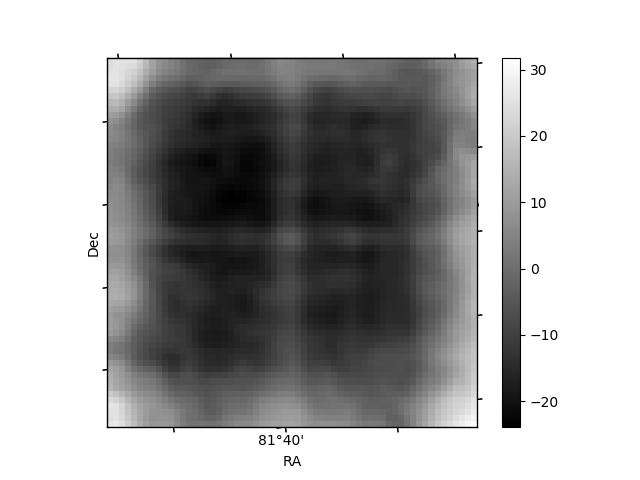
Histogram calculated using DETX and DETY for each event in the final _common_clean file
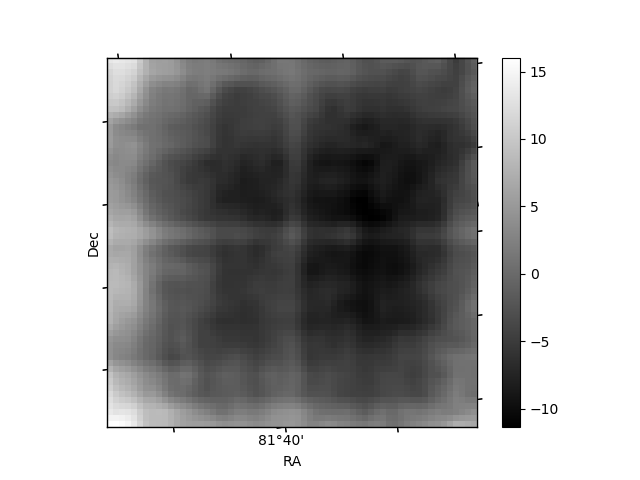
| Quadrant A | 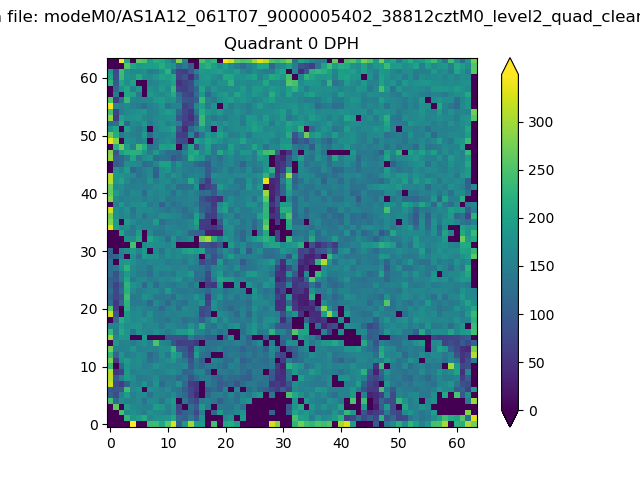 |
 |
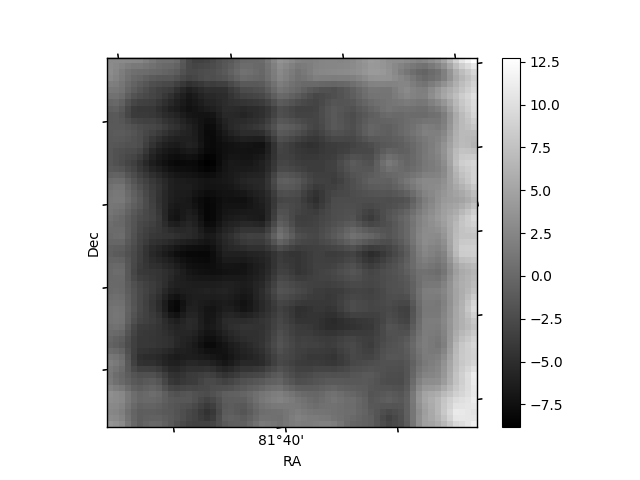
Quadrant B |
|---|---|---|---|
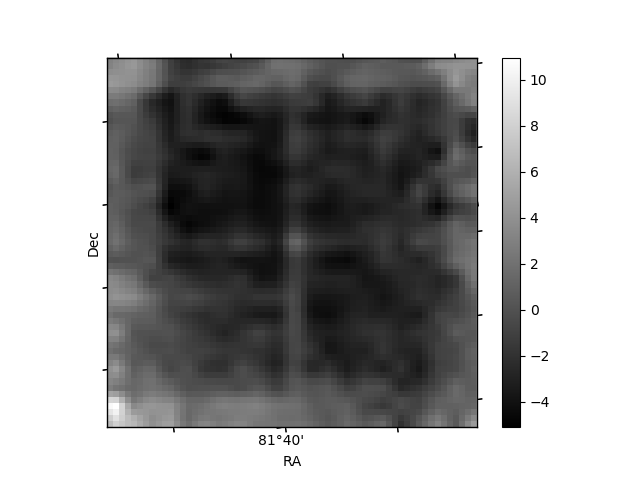
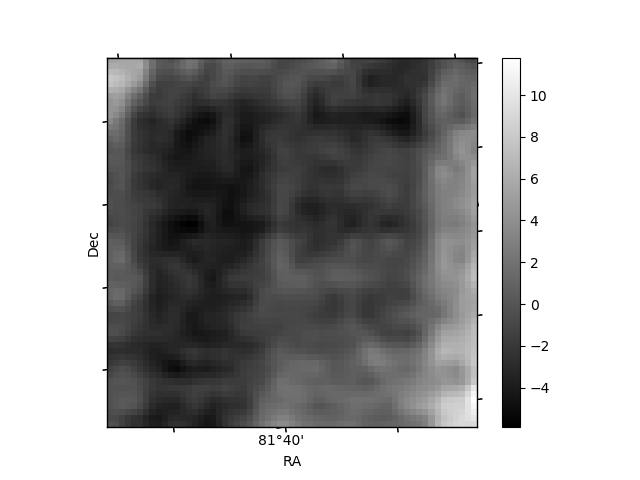
| Quadrant D | 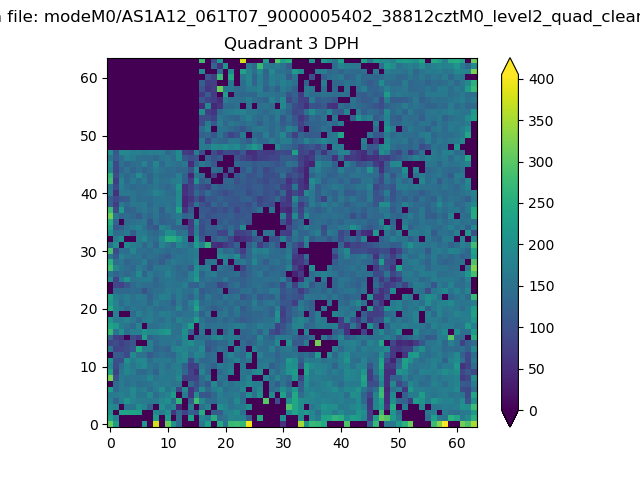 |
 |
Quadrant C |
| Plot type | Count rate plots | Images |
|---|---|---|
| Comparison with Poisson distribution Blue bars denote a histogram of data divided into 1 sec bins. Red curve is a Poisson curve with rate = median count rate of data. |
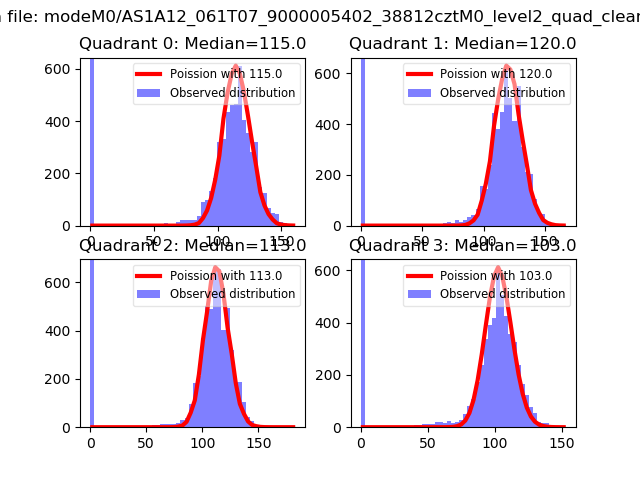 |
 |
| Quadrant-wise count rates Data is divided into 100 sec bins |
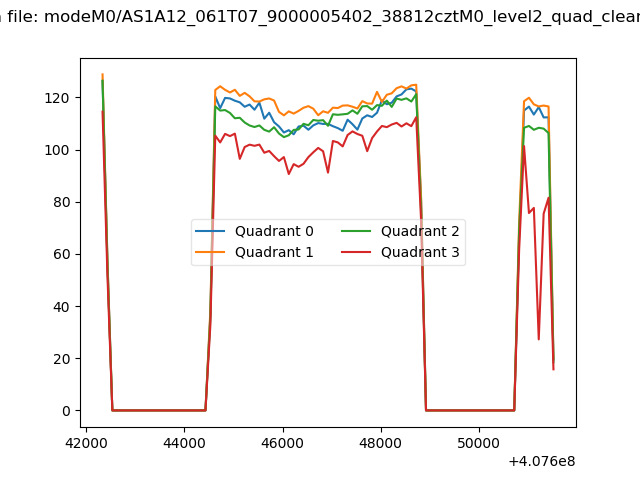 |
|
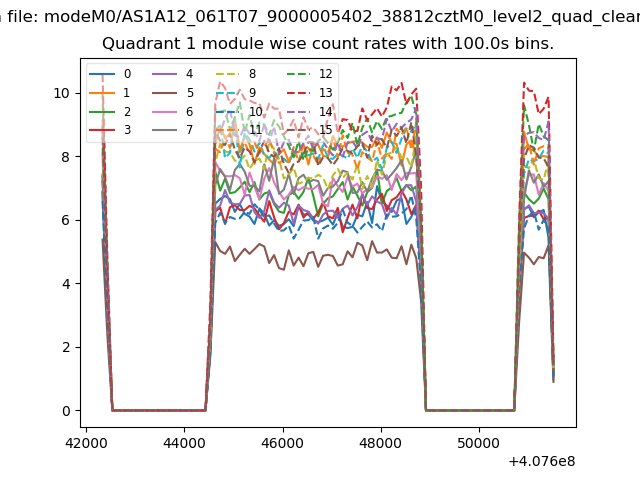
| Module-wise count rates for Quadrant A Data is divided into 100 sec bins |
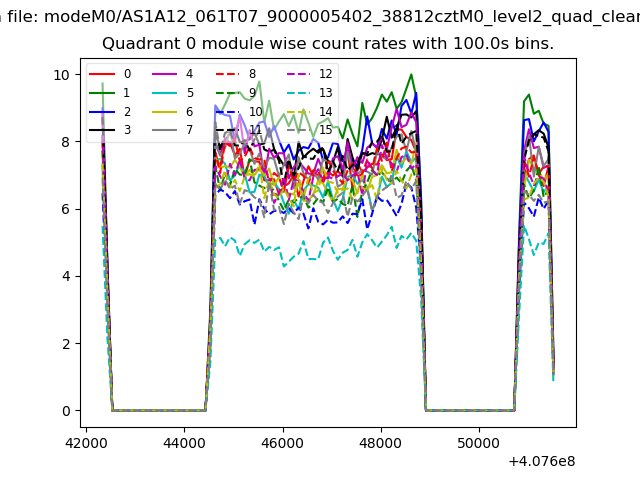 |
 |
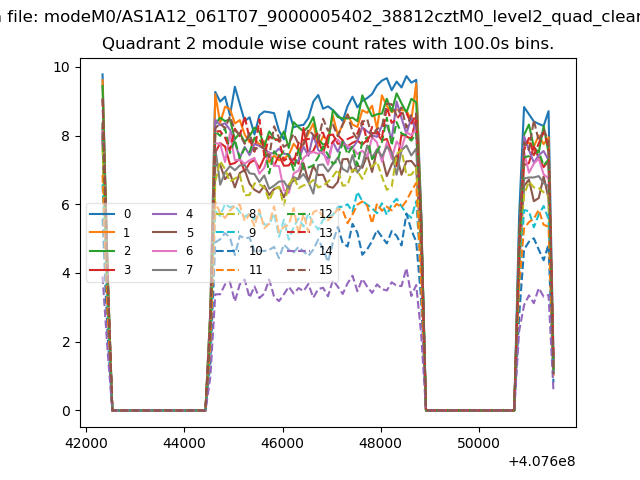
| Module-wise count rates for Quadrant B Data is divided into 100 sec bins |
 |
 |
| Module-wise count rates for Quadrant C Data is divided into 100 sec bins |
 |
 |
| Module-wise count rates for Quadrant D Data is divided into 100 sec bins |
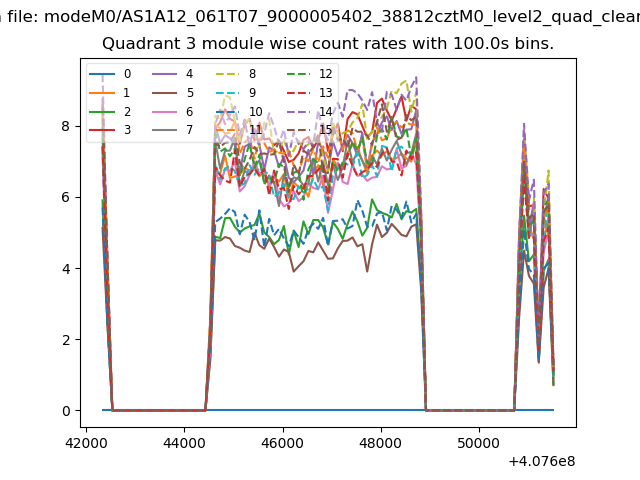 |
 |
| Parameter | Plot |
|---|---|
| CZT HV Monitor | 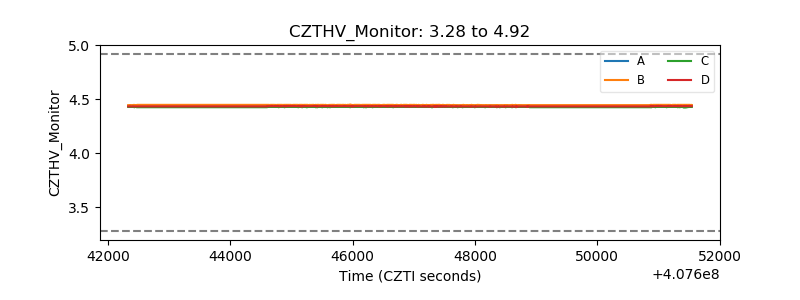 |
| D_VDD | 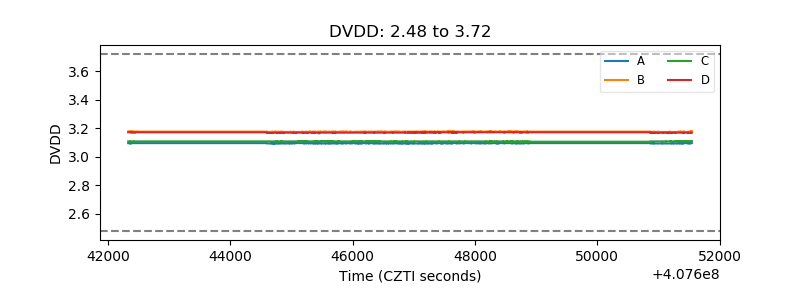 |
| Temperature 1 | 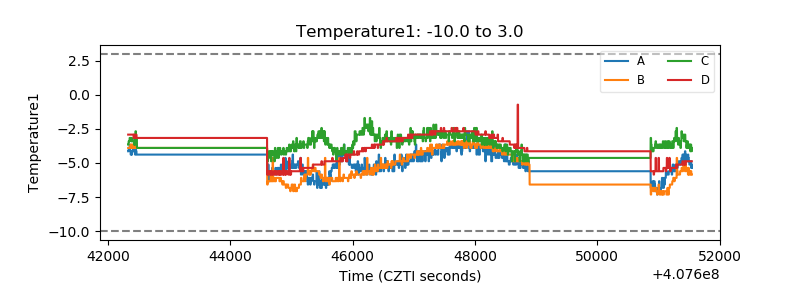 |
| Veto HV Monitor | 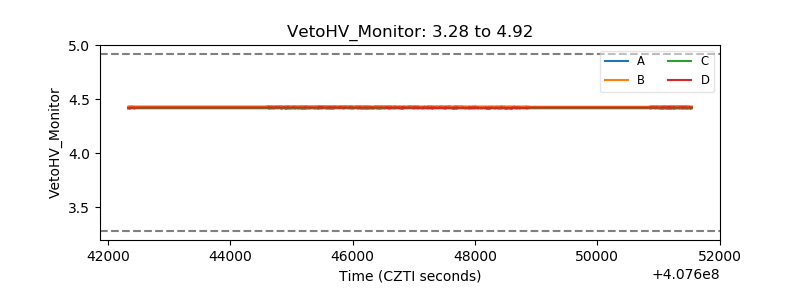 |
| Veto LLD | 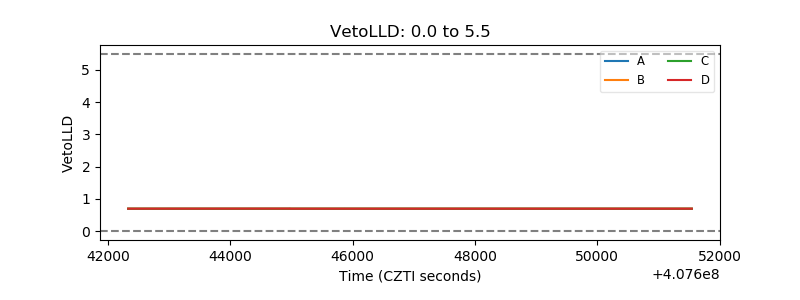 |
| Alpha Counter | 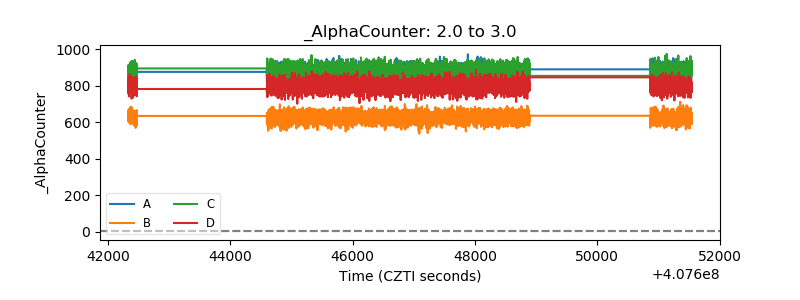 |
| _CPM_Rate | 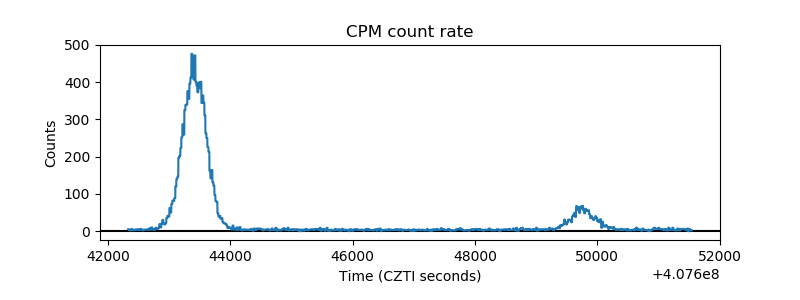 |
| CZT Counter | 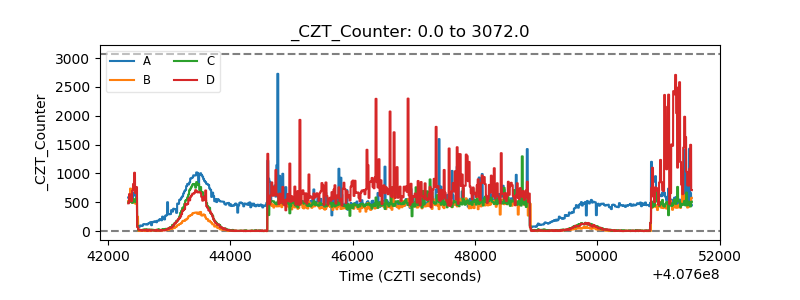 |
| +2.5 Volts monitor | 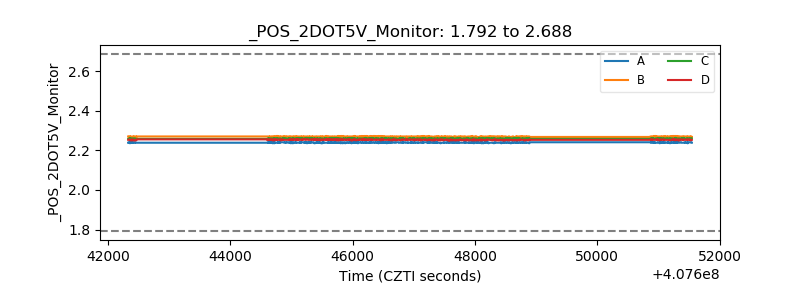 |
| +5 Volts monitor | 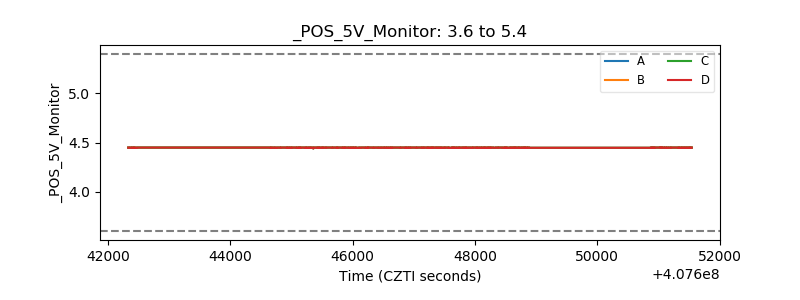 |
| _ROLL_ROT | 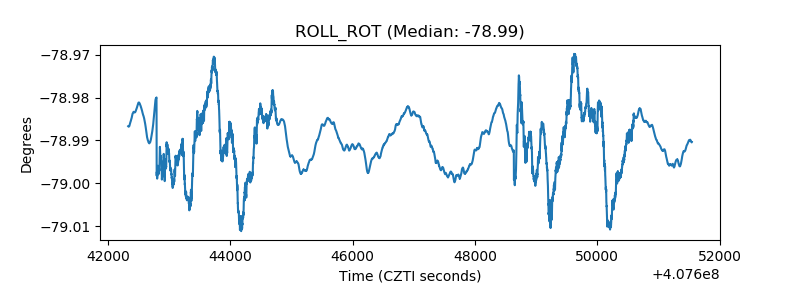 |
| _Roll_DEC | 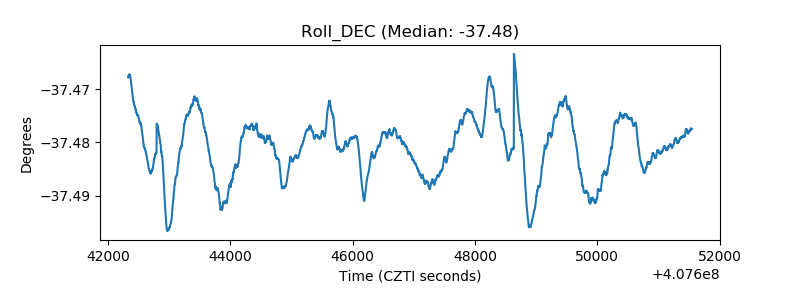 |
| _Roll_RA | 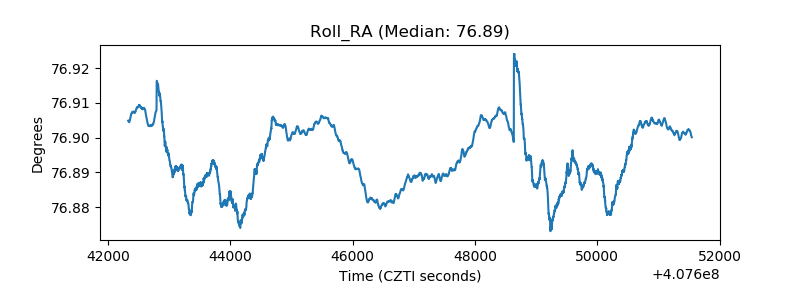 |
| Veto Counter | 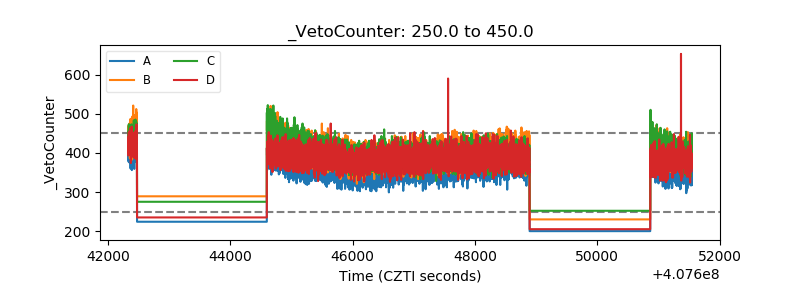 |