| Param | Original file | Final file |
|---|---|---|
| Filename | modeM0/AS1A12_061T07_9000005402_38813cztM0_level2.fits | modeM0/AS1A12_061T07_9000005402_38813cztM0_level2_quad_clean.evt |
| Size (bytes) | 348,825,600 | 90,751,680 |
| Size | 332.7 MB | 86.5 MB |
| Events in quadrant A | 2,886,250 | 613,873 |
| Events in quadrant B | 2,474,074 | 632,429 |
| Events in quadrant C | 2,643,201 | 600,009 |
| Events in quadrant D | 4,481,099 | 517,856 |
| Mode M9 | |||
|---|---|---|---|
| Quadrant | BADHDUFLAG | Total packets | Discarded packets |
| A | 0 | 23 | 0 |
| B | 0 | 23 | 0 |
| C | 0 | 23 | 0 |
| D | 0 | 24 | 0 |
| Mode SS | |||
|---|---|---|---|
| Quadrant | BADHDUFLAG | Total packets | Discarded packets |
| A | 0 | 110 | 0 |
| B | 0 | 110 | 0 |
| C | 0 | 110 | 0 |
| D | 0 | 110 | 0 |
| Mode M0 | |||
|---|---|---|---|
| Quadrant | BADHDUFLAG | Total packets | Discarded packets |
| A | 0 | 11882 | 3 |
| B | 0 | 11076 | 2 |
| C | 0 | 11146 | 2 |
| D | 0 | 17110 | 2 |
| Quadrant | Total seconds | Saturated seconds | Saturation percentage |
|---|---|---|---|
| A | 5491 | 20 | 0.364232% |
| B | 5491 | 4 | 0.072846% |
| C | 5491 | 6 | 0.109270% |
| D | 5491 | 423 | 7.703515% |
Noise dominated data is calculated using 1-second bins in cleaned event files. If a bin has >2000 counts, and if more than 50% of those come from <1% of pixels, then it is considered to be noise-dominated and hence unusable.
| Quadrant | # 1 sec bins | Bins with >0 counts | Bins with >2000 counts | High rate bins dominated by noise | Noise dominated (total time) | Noise dominated (detector-on time) | Marked lightcurve |
|---|---|---|---|---|---|---|---|
| A | 7134 | 5492 | 15 | 15 | 0.21% | 0.27% | 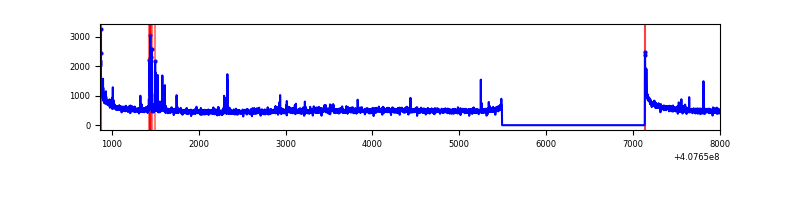 |
| B | 7134 | 5492 | 1 | 1 | 0.01% | 0.02% | 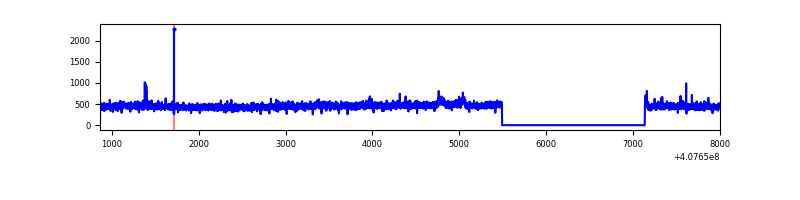 |
| C | 7134 | 5492 | 4 | 4 | 0.06% | 0.07% | 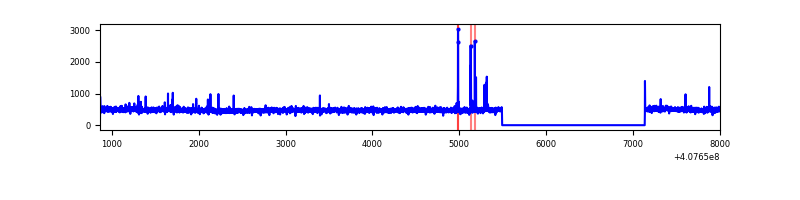 |
| D | 7134 | 5492 | 354 | 354 | 4.96% | 6.45% | 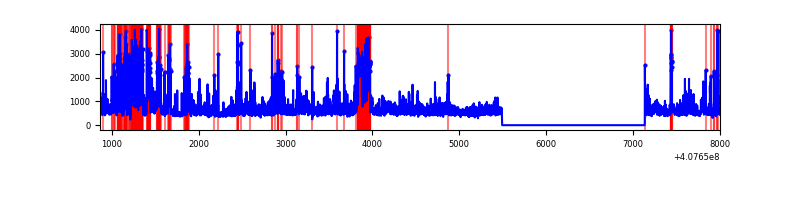 |
Top three noisy pixels from each quadrant. If the there are fewer than three noisy pixels in the level2.evt file, extra rows are filled as -1
| Pixel properties | Quadrant properties | ||||||
|---|---|---|---|---|---|---|---|
| Quadrant | DetID | PixID | Counts | Sigma | Mean | Median | Sigma |
| A | 10 | 83 | 394533 | 3195.58 | 610 | 597 | 123.3 |
| A | 13 | 248 | 94931 | 765.23 | 610 | 597 | 123.3 |
| A | 9 | 143 | 20488 | 161.35 | 610 | 597 | 123.3 |
| B | 0 | 230 | 35629 | 295.77 | 608 | 590 | 118.5 |
| B | 0 | 221 | 18096 | 147.77 | 608 | 590 | 118.5 |
| B | 12 | 111 | 15066 | 122.19 | 608 | 590 | 118.5 |
| C | 15 | 214 | 247455 | 1741.64 | 600 | 603 | 141.7 |
| C | 1 | 23 | 28751 | 198.6 | 600 | 603 | 141.7 |
| C | 0 | 239 | 21560 | 147.86 | 600 | 603 | 141.7 |
| D | 2 | 249 | 819565 | 5853.49 | 575 | 559 | 139.9 |
| D | 2 | 16 | 634898 | 4533.67 | 575 | 559 | 139.9 |
| D | 2 | 250 | 492738 | 3517.64 | 575 | 559 | 139.9 |
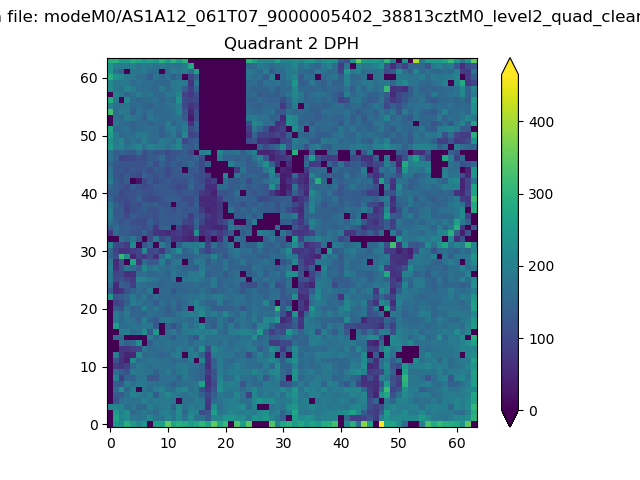
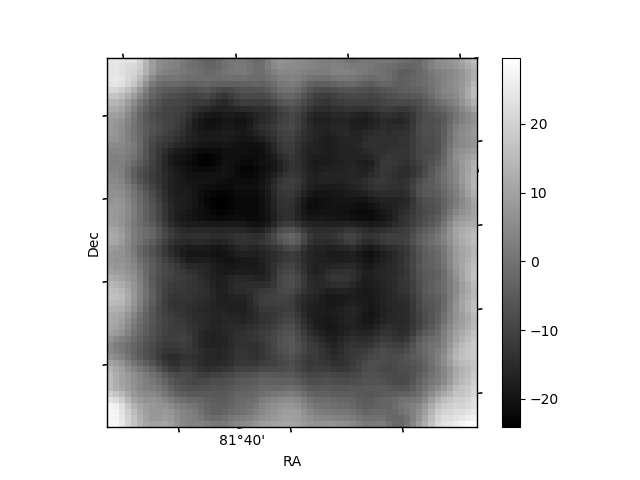
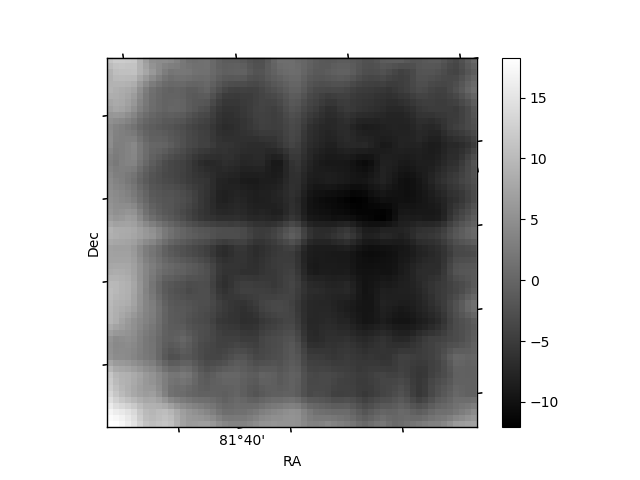
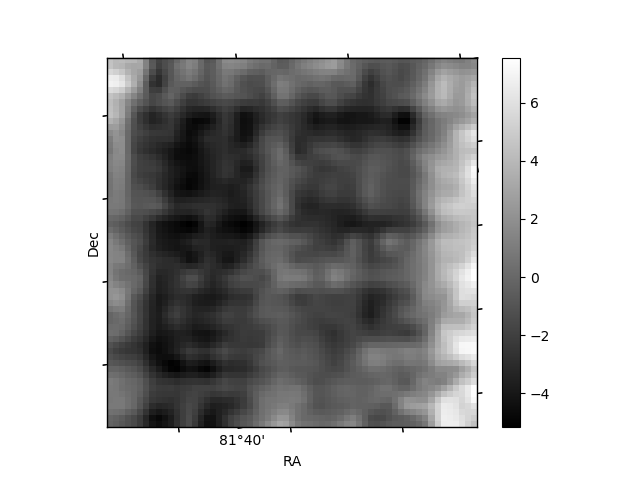
Histogram calculated using DETX and DETY for each event in the final _common_clean file
| Quadrant A | 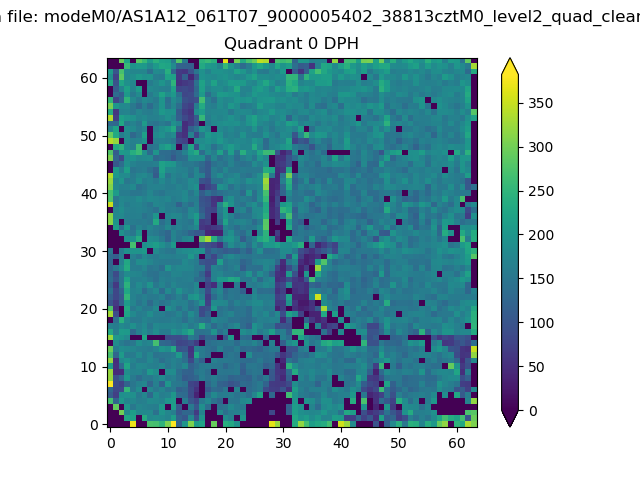 |
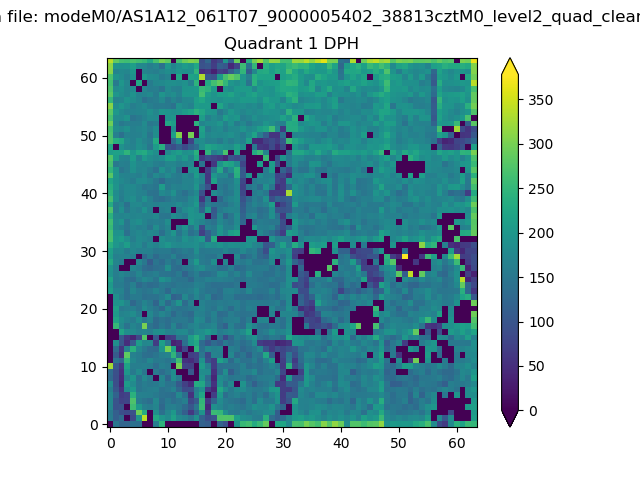 |
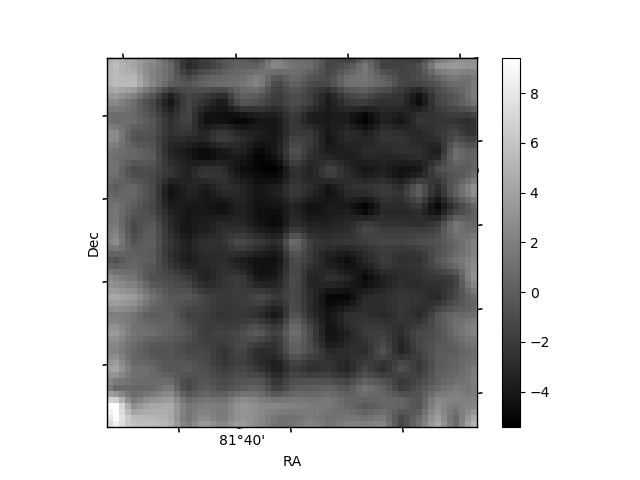
Quadrant B |
|---|---|---|---|
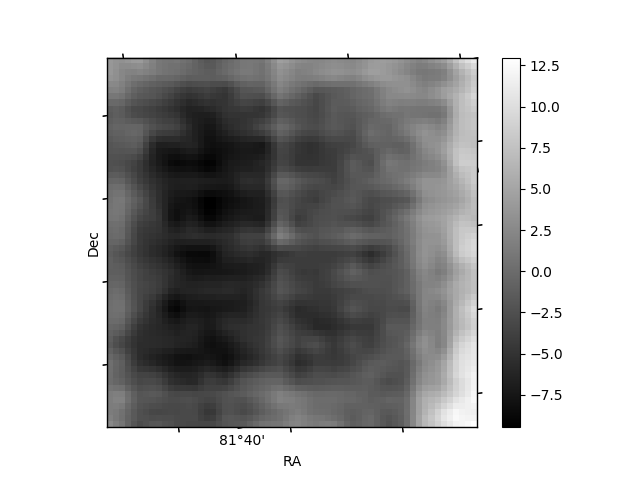
| Quadrant D | 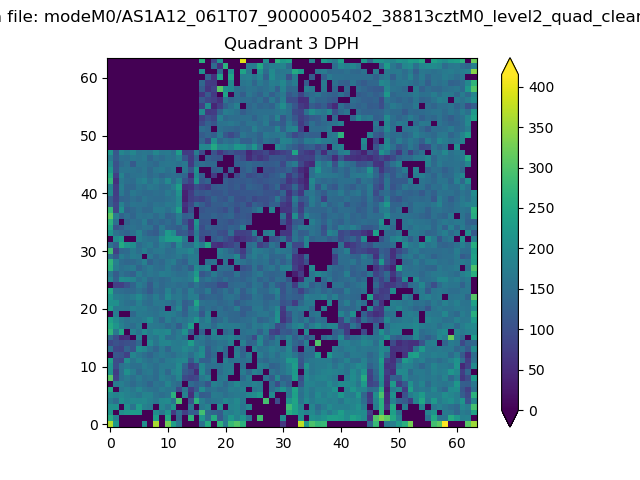 |
 |
Quadrant C |
| Plot type | Count rate plots | Images |
|---|---|---|
| Comparison with Poisson distribution Blue bars denote a histogram of data divided into 1 sec bins. Red curve is a Poisson curve with rate = median count rate of data. |
 |
 |
| Quadrant-wise count rates Data is divided into 100 sec bins |
 |
|
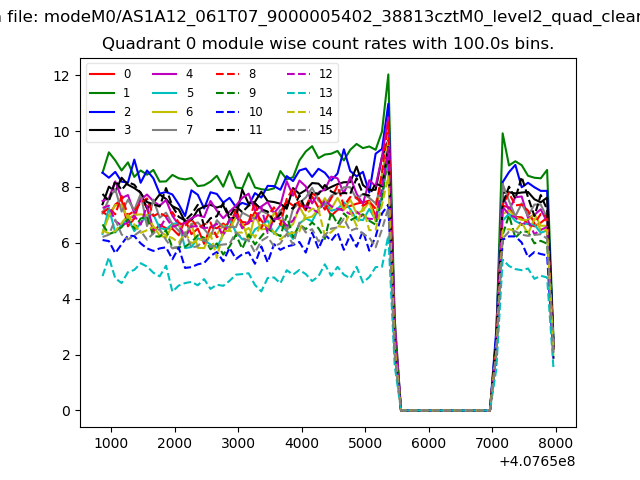
| Module-wise count rates for Quadrant A Data is divided into 100 sec bins |
 |
 |
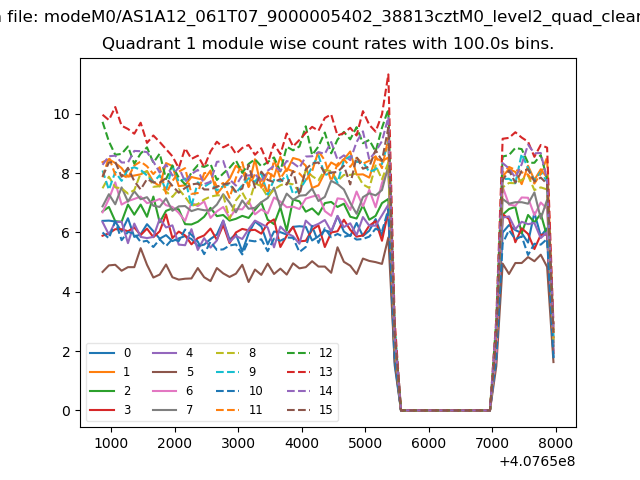
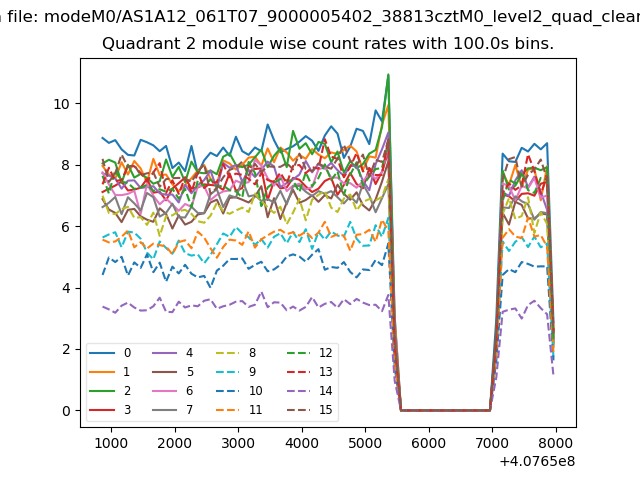
| Module-wise count rates for Quadrant B Data is divided into 100 sec bins |
 |
 |
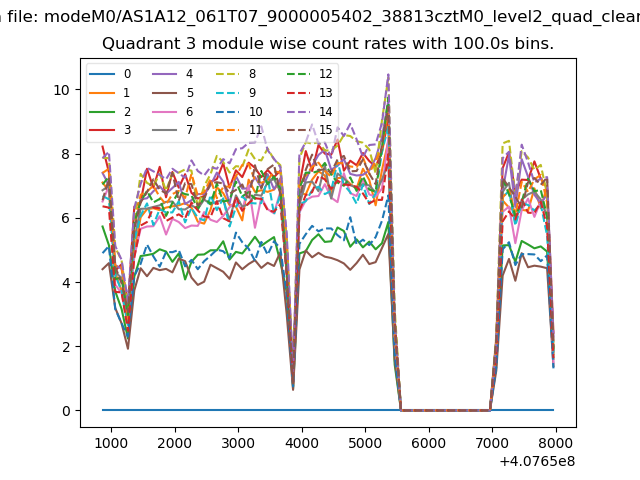
| Module-wise count rates for Quadrant C Data is divided into 100 sec bins |
 |
 |
| Module-wise count rates for Quadrant D Data is divided into 100 sec bins |
 |
 |
| Parameter | Plot |
|---|---|
| CZT HV Monitor | 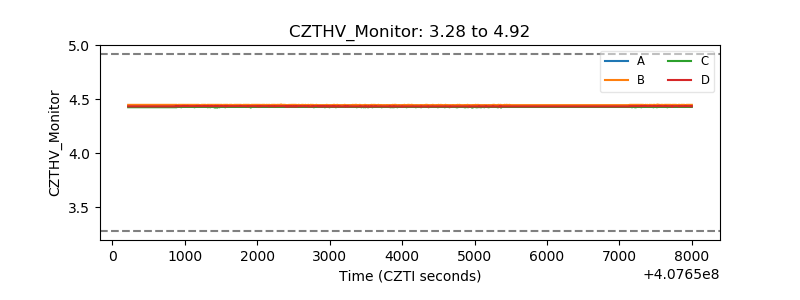 |
| D_VDD | 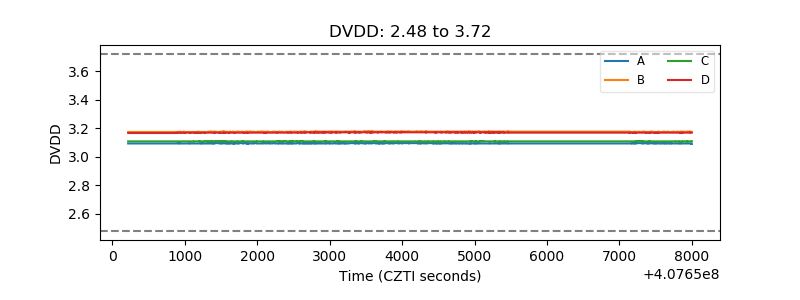 |
| Temperature 1 | 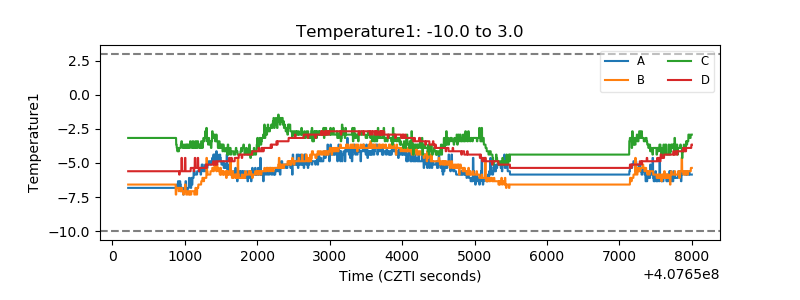 |
| Veto HV Monitor | 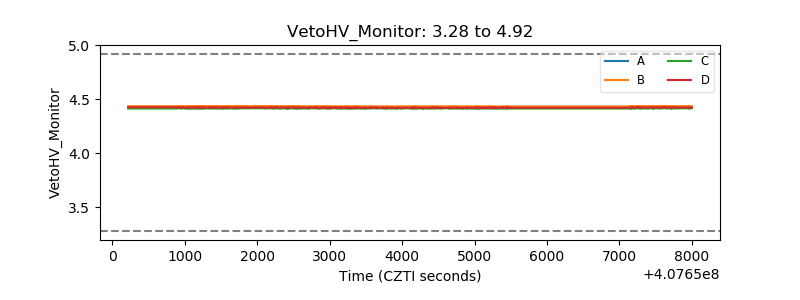 |
| Veto LLD | 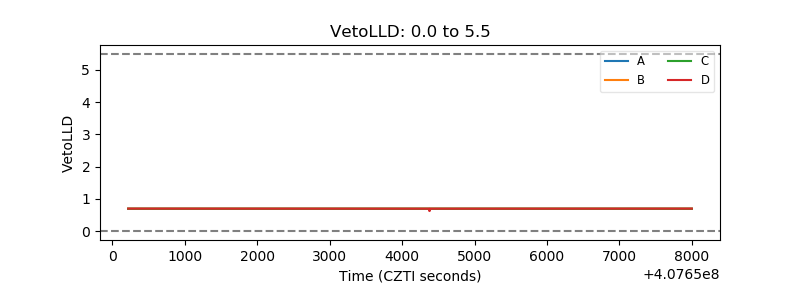 |
| Alpha Counter | 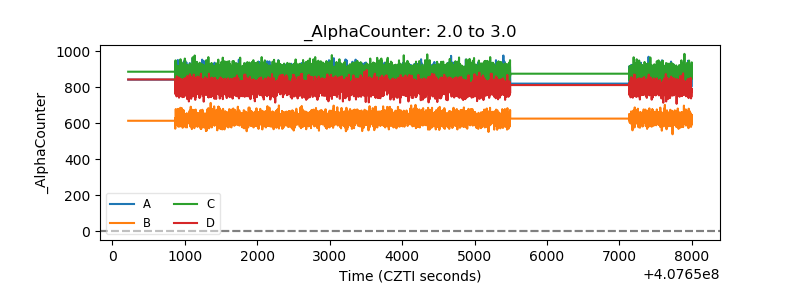 |
| _CPM_Rate |  |
| CZT Counter | 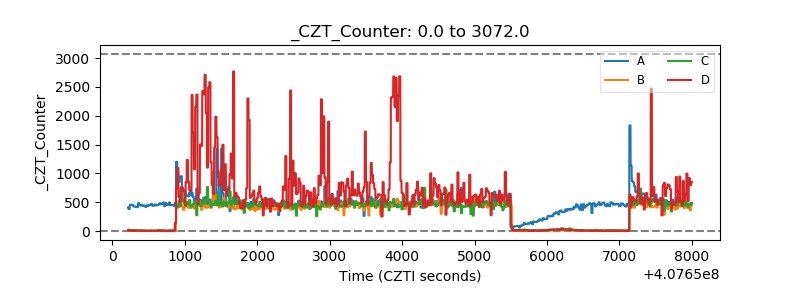 |
| +2.5 Volts monitor | 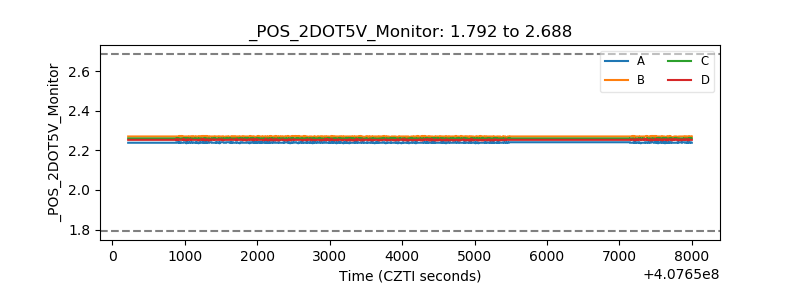 |
| +5 Volts monitor | 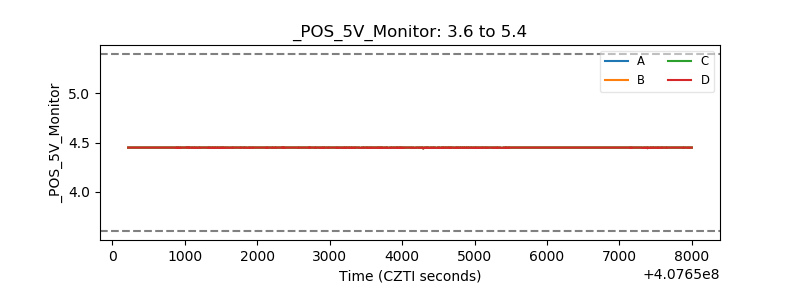 |
| _ROLL_ROT | 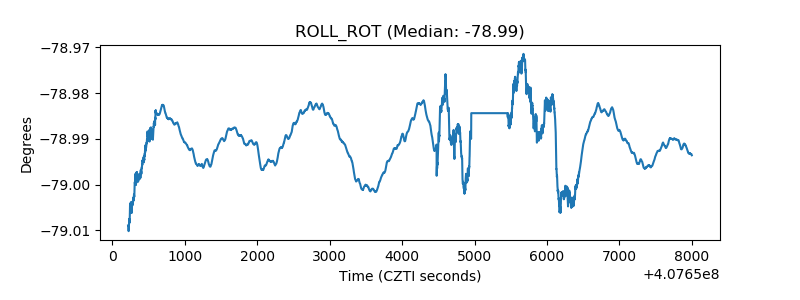 |
| _Roll_DEC | 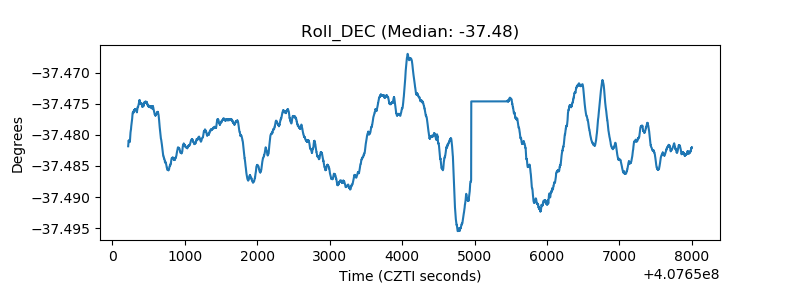 |
| _Roll_RA | 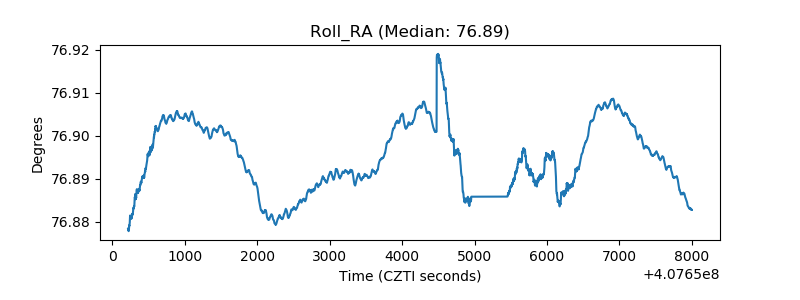 |
| Veto Counter | 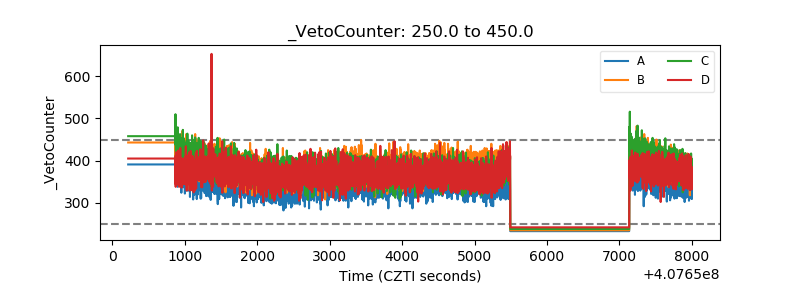 |