| Param | Original file | Final file |
|---|---|---|
| Filename | modeM0/AS1A12_061T07_9000005402_38814cztM0_level2.fits | modeM0/AS1A12_061T07_9000005402_38814cztM0_level2_quad_clean.evt |
| Size (bytes) | 339,793,920 | 94,530,240 |
| Size | 324.1 MB | 90.2 MB |
| Events in quadrant A | 2,883,440 | 630,495 |
| Events in quadrant B | 2,571,819 | 650,636 |
| Events in quadrant C | 2,780,372 | 617,474 |
| Events in quadrant D | 3,897,930 | 564,766 |
| Mode M9 | |||
|---|---|---|---|
| Quadrant | BADHDUFLAG | Total packets | Discarded packets |
| A | 0 | 30 | 0 |
| B | 0 | 30 | 0 |
| C | 0 | 30 | 0 |
| D | 0 | 30 | 0 |
| Mode SS | |||
|---|---|---|---|
| Quadrant | BADHDUFLAG | Total packets | Discarded packets |
| A | 0 | 118 | 0 |
| B | 0 | 118 | 0 |
| C | 0 | 118 | 0 |
| D | 0 | 118 | 0 |
| Mode M0 | |||
|---|---|---|---|
| Quadrant | BADHDUFLAG | Total packets | Discarded packets |
| A | 0 | 12077 | 3 |
| B | 0 | 11537 | 2 |
| C | 0 | 11786 | 2 |
| D | 0 | 15490 | 2 |
| Quadrant | Total seconds | Saturated seconds | Saturation percentage |
|---|---|---|---|
| A | 5706 | 13 | 0.227830% |
| B | 5706 | 6 | 0.105152% |
| C | 5706 | 33 | 0.578339% |
| D | 5706 | 125 | 2.190676% |
Noise dominated data is calculated using 1-second bins in cleaned event files. If a bin has >2000 counts, and if more than 50% of those come from <1% of pixels, then it is considered to be noise-dominated and hence unusable.
| Quadrant | # 1 sec bins | Bins with >0 counts | Bins with >2000 counts | High rate bins dominated by noise | Noise dominated (total time) | Noise dominated (detector-on time) | Marked lightcurve |
|---|---|---|---|---|---|---|---|
| A | 8721 | 5708 | 7 | 7 | 0.08% | 0.12% | 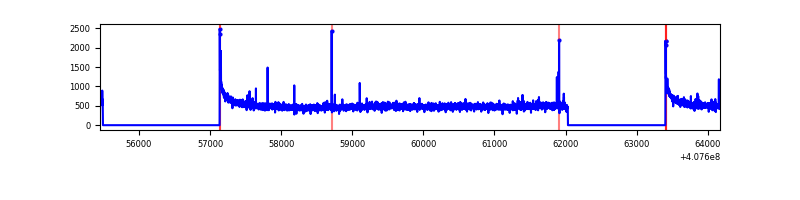 |
| B | 8721 | 5708 | 0 | 0 | 0.00% | 0.00% | 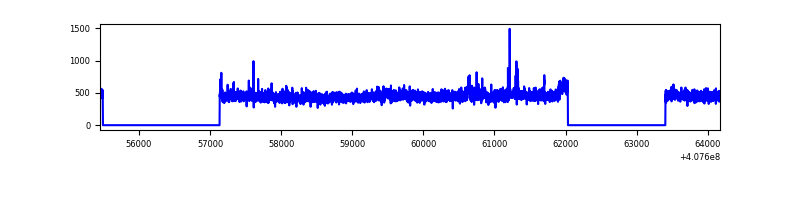 |
| C | 8721 | 5708 | 29 | 29 | 0.33% | 0.51% | 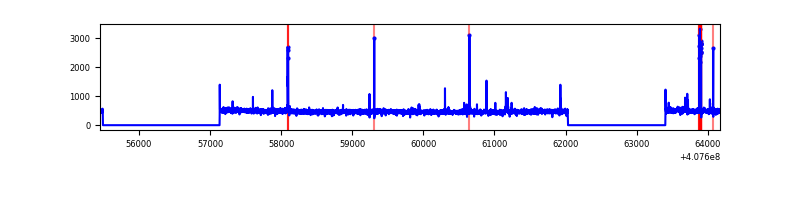 |
| D | 8721 | 5708 | 108 | 108 | 1.24% | 1.89% | 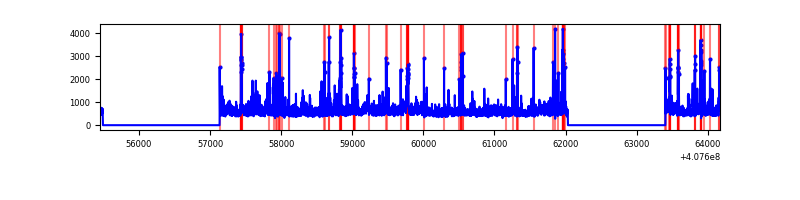 |
Top three noisy pixels from each quadrant. If the there are fewer than three noisy pixels in the level2.evt file, extra rows are filled as -1
| Pixel properties | Quadrant properties | ||||||
|---|---|---|---|---|---|---|---|
| Quadrant | DetID | PixID | Counts | Sigma | Mean | Median | Sigma |
| A | 10 | 83 | 400544 | 3119.81 | 629 | 615 | 128.2 |
| A | 9 | 143 | 23240 | 176.5 | 629 | 615 | 128.2 |
| A | 13 | 248 | 17627 | 132.71 | 629 | 615 | 128.2 |
| B | 5 | 200 | 34607 | 277.7 | 628 | 608 | 122.4 |
| B | 0 | 230 | 23552 | 187.4 | 628 | 608 | 122.4 |
| B | 4 | 170 | 20571 | 163.05 | 628 | 608 | 122.4 |
| C | 15 | 214 | 255103 | 1759.46 | 616 | 618 | 144.6 |
| C | 10 | 20 | 69423 | 475.7 | 616 | 618 | 144.6 |
| C | 1 | 23 | 42774 | 291.46 | 616 | 618 | 144.6 |
| D | 2 | 16 | 601450 | 3998.91 | 609 | 589 | 150.3 |
| D | 12 | 227 | 507916 | 3376.41 | 609 | 589 | 150.3 |
| D | 2 | 250 | 163255 | 1082.59 | 609 | 589 | 150.3 |
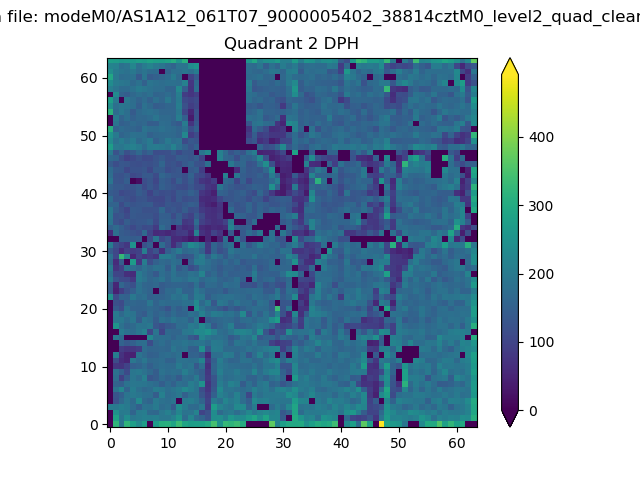
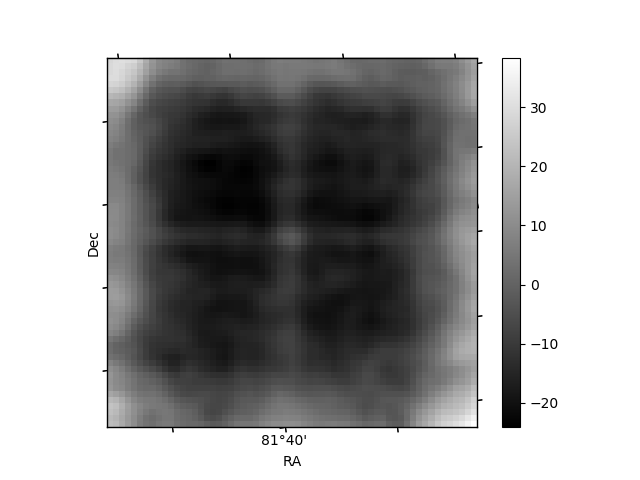
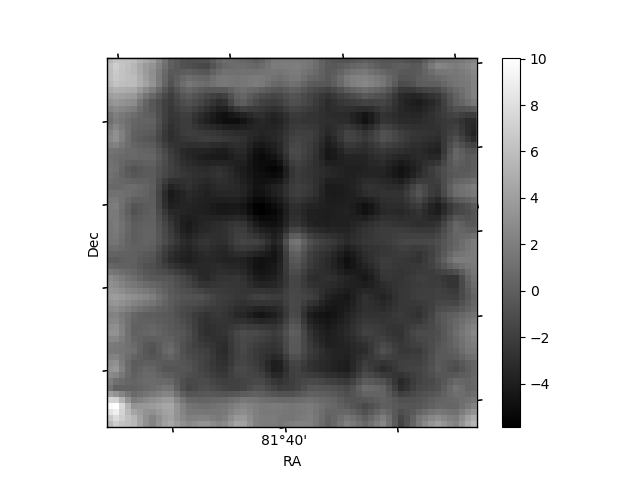
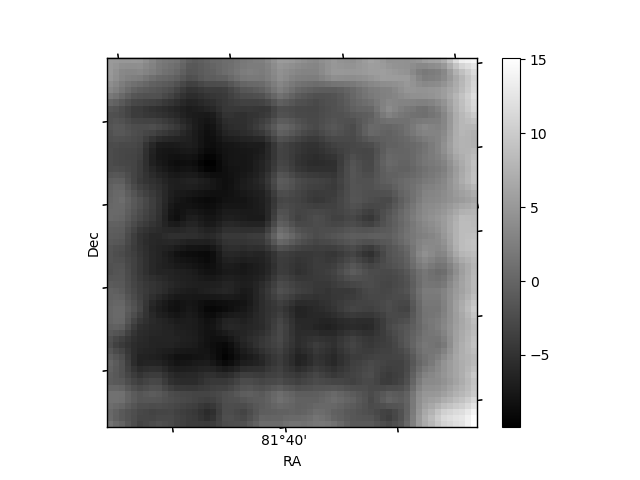
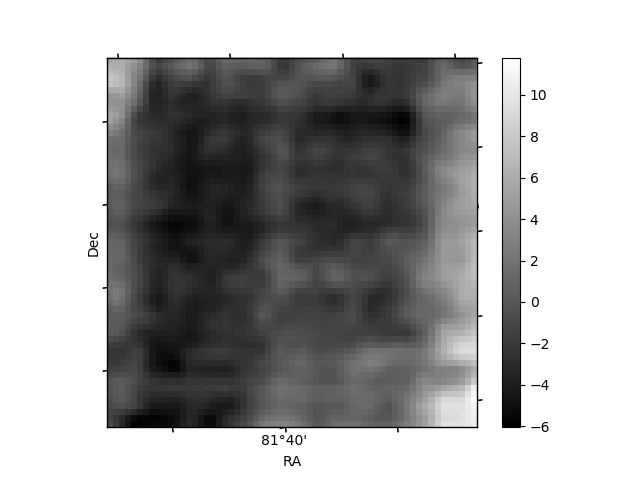
Histogram calculated using DETX and DETY for each event in the final _common_clean file
| Quadrant A | 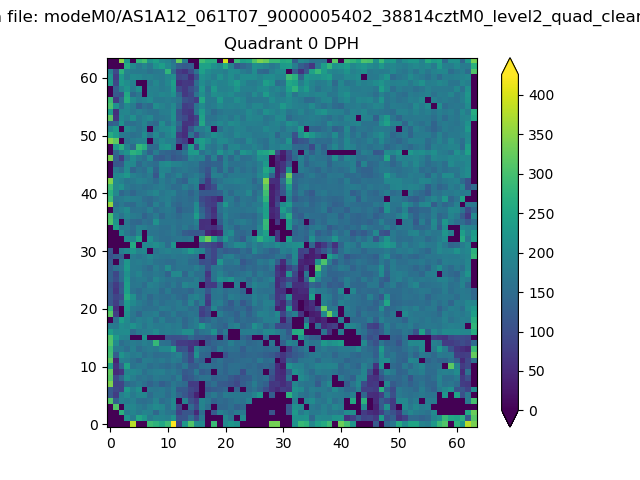 |
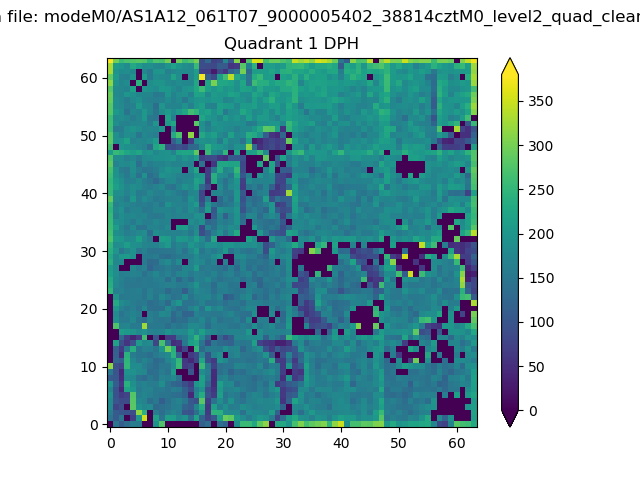 |
Quadrant B |
|---|---|---|---|
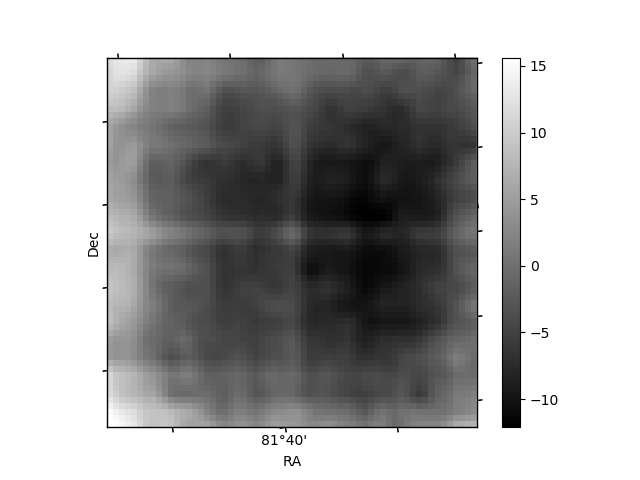
| Quadrant D | 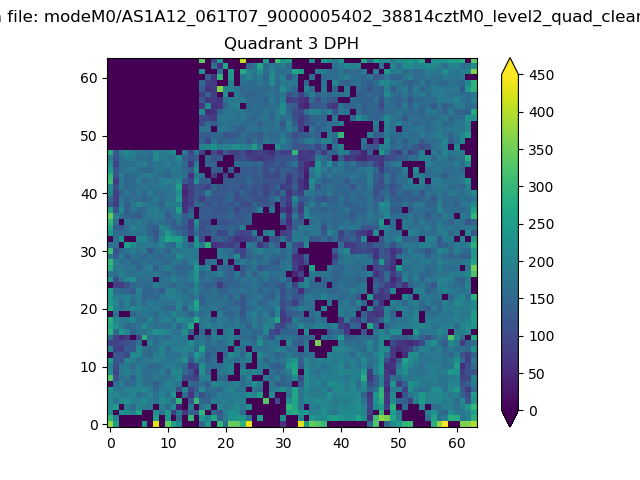 |
 |
Quadrant C |
| Plot type | Count rate plots | Images |
|---|---|---|
| Comparison with Poisson distribution Blue bars denote a histogram of data divided into 1 sec bins. Red curve is a Poisson curve with rate = median count rate of data. |
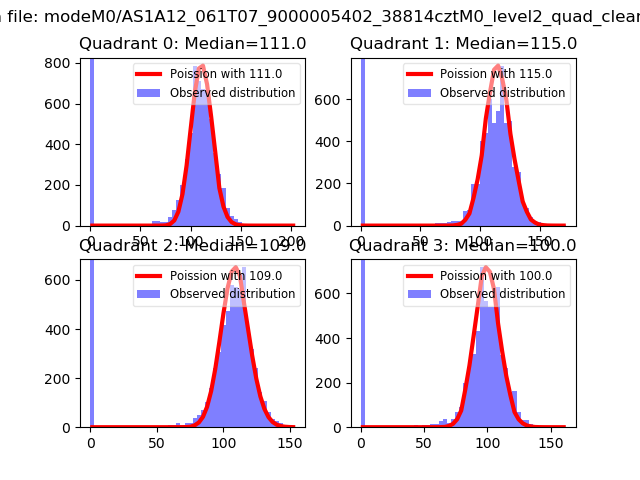 |
 |
| Quadrant-wise count rates Data is divided into 100 sec bins |
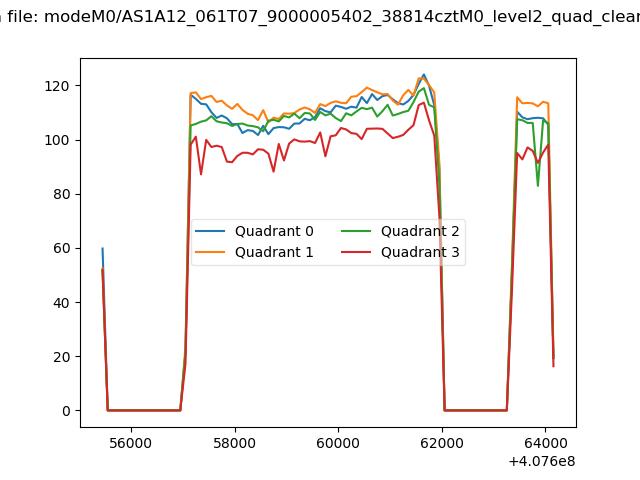 |
|
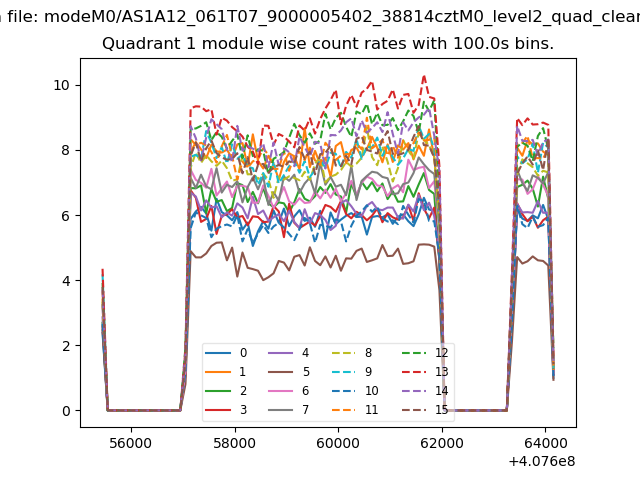
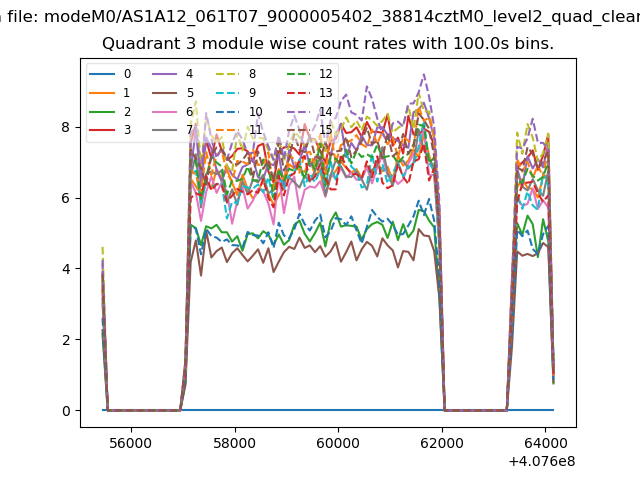
| Module-wise count rates for Quadrant A Data is divided into 100 sec bins |
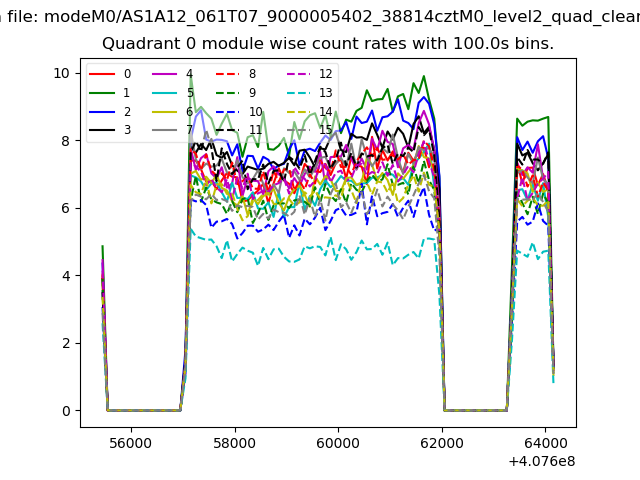 |
 |
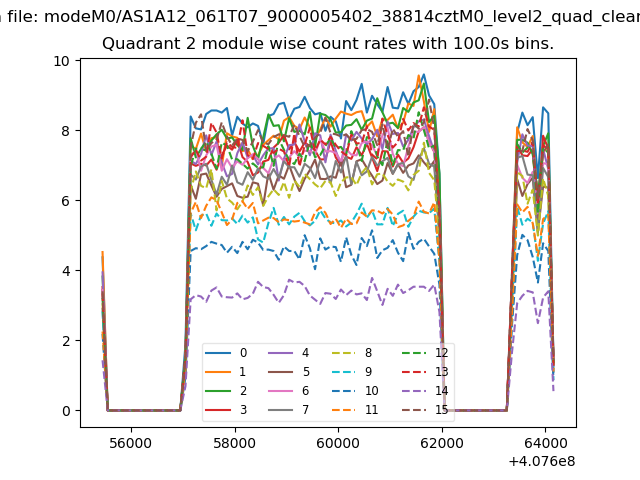
| Module-wise count rates for Quadrant B Data is divided into 100 sec bins |
 |
 |
| Module-wise count rates for Quadrant C Data is divided into 100 sec bins |
 |
 |
| Module-wise count rates for Quadrant D Data is divided into 100 sec bins |
 |
 |
| Parameter | Plot |
|---|---|
| CZT HV Monitor | 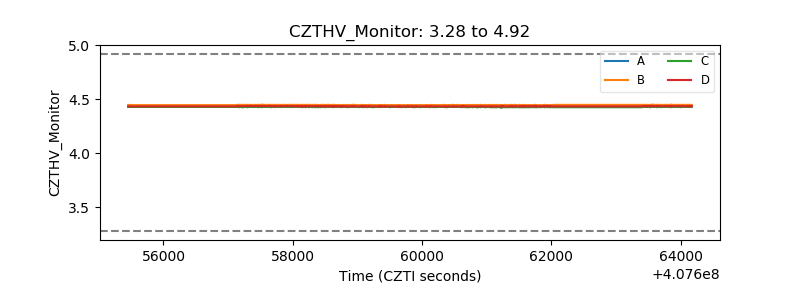 |
| D_VDD | 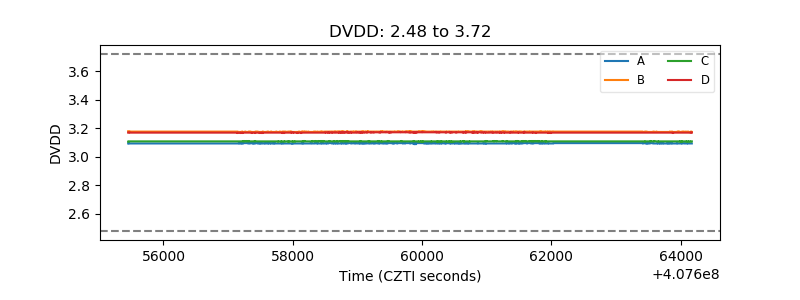 |
| Temperature 1 | 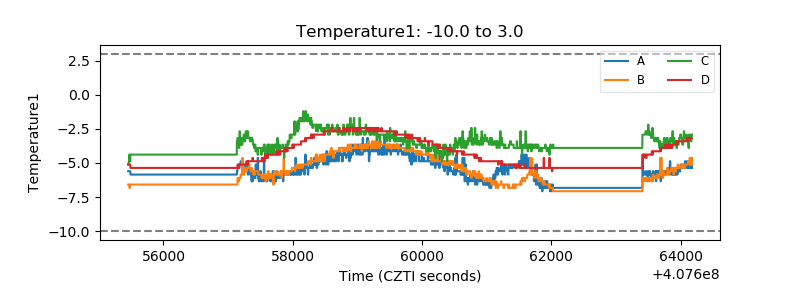 |
| Veto HV Monitor | 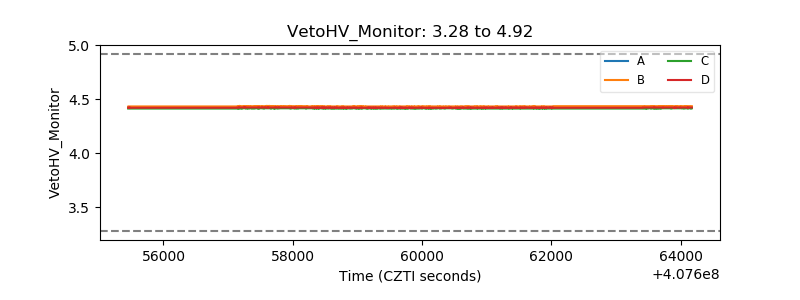 |
| Veto LLD | 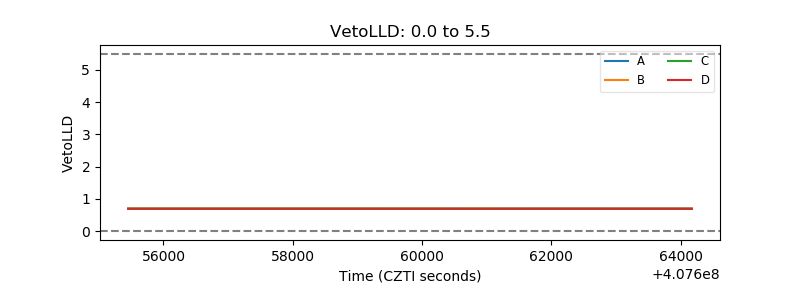 |
| Alpha Counter | 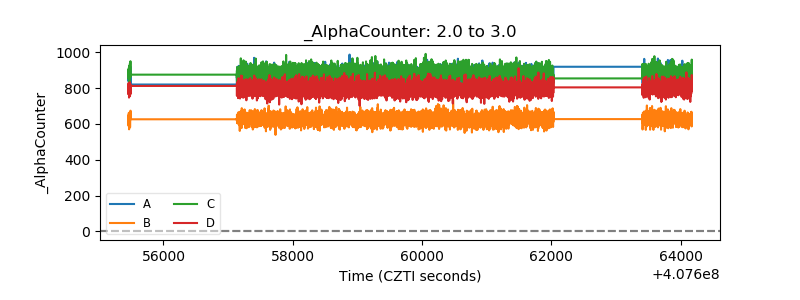 |
| _CPM_Rate |  |
| CZT Counter | 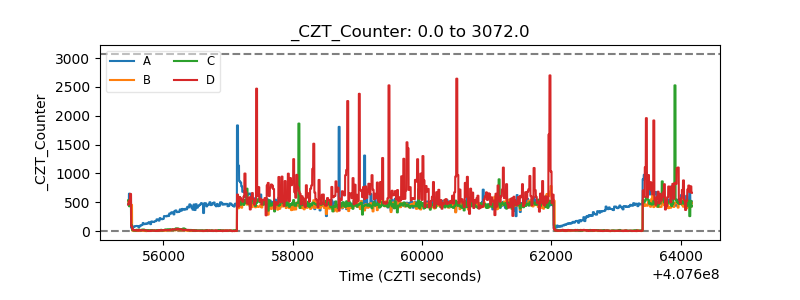 |
| +2.5 Volts monitor | 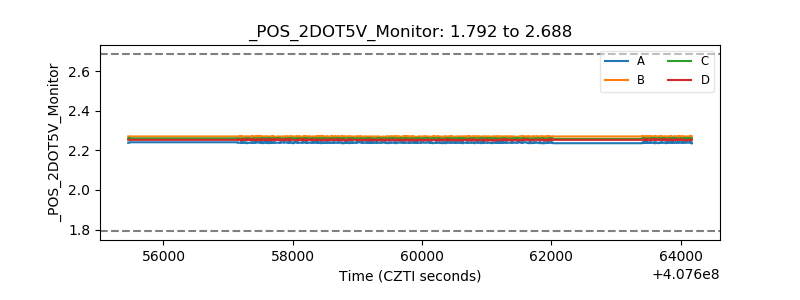 |
| +5 Volts monitor | 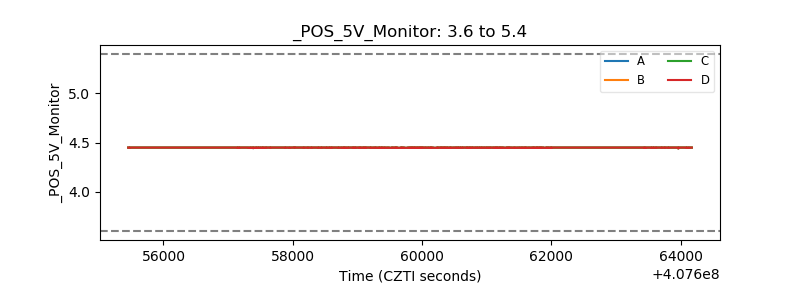 |
| _ROLL_ROT | 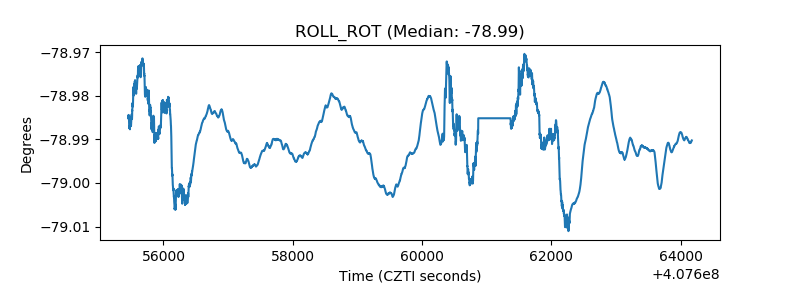 |
| _Roll_DEC | 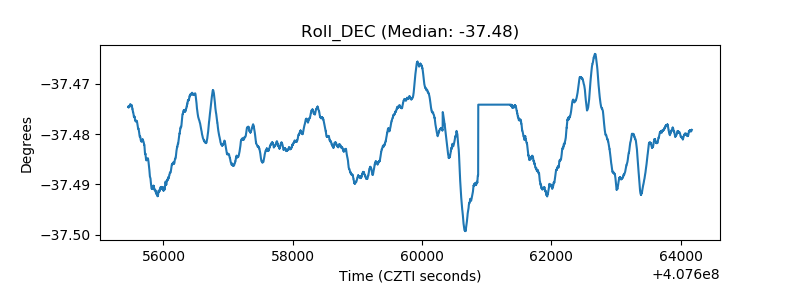 |
| _Roll_RA | 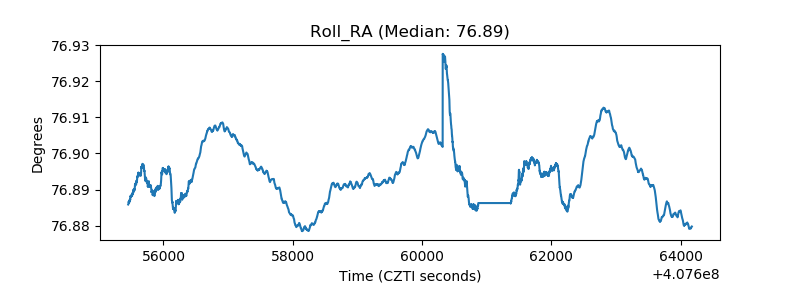 |
| Veto Counter | 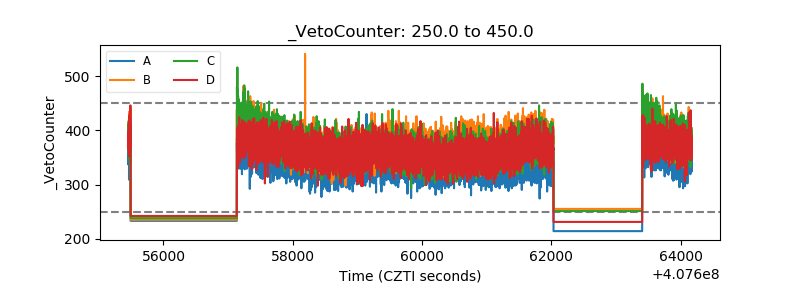 |