| Param | Original file | Final file |
|---|---|---|
| Filename | modeM0/AS1A12_061T07_9000005402_38815cztM0_level2.fits | modeM0/AS1A12_061T07_9000005402_38815cztM0_level2_quad_clean.evt |
| Size (bytes) | 405,383,040 | 109,206,720 |
| Size | 386.6 MB | 104.1 MB |
| Events in quadrant A | 3,686,406 | 727,475 |
| Events in quadrant B | 2,994,923 | 750,735 |
| Events in quadrant C | 3,481,994 | 708,132 |
| Events in quadrant D | 4,330,146 | 660,391 |
| Mode M9 | |||
|---|---|---|---|
| Quadrant | BADHDUFLAG | Total packets | Discarded packets |
| A | 0 | 26 | 0 |
| B | 0 | 26 | 0 |
| C | 0 | 26 | 0 |
| D | 0 | 26 | 0 |
| Mode SS | |||
|---|---|---|---|
| Quadrant | BADHDUFLAG | Total packets | Discarded packets |
| A | 0 | 138 | 0 |
| B | 0 | 138 | 0 |
| C | 0 | 138 | 0 |
| D | 0 | 138 | 0 |
| Mode M0 | |||
|---|---|---|---|
| Quadrant | BADHDUFLAG | Total packets | Discarded packets |
| A | 0 | 15020 | 3 |
| B | 0 | 13298 | 2 |
| C | 0 | 14446 | 2 |
| D | 0 | 17343 | 2 |
| Quadrant | Total seconds | Saturated seconds | Saturation percentage |
|---|---|---|---|
| A | 6590 | 58 | 0.880121% |
| B | 6590 | 7 | 0.106222% |
| C | 6590 | 122 | 1.851290% |
| D | 6590 | 105 | 1.593323% |
Noise dominated data is calculated using 1-second bins in cleaned event files. If a bin has >2000 counts, and if more than 50% of those come from <1% of pixels, then it is considered to be noise-dominated and hence unusable.
| Quadrant | # 1 sec bins | Bins with >0 counts | Bins with >2000 counts | High rate bins dominated by noise | Noise dominated (total time) | Noise dominated (detector-on time) | Marked lightcurve |
|---|---|---|---|---|---|---|---|
| A | 9274 | 6592 | 32 | 32 | 0.35% | 0.49% | 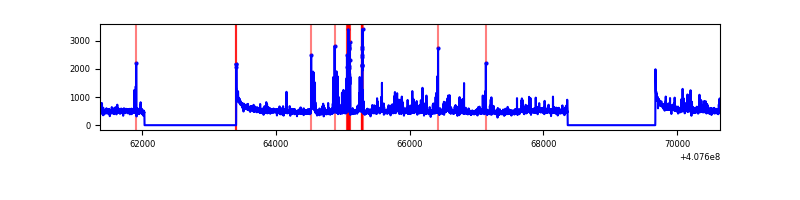 |
| B | 9274 | 6592 | 0 | 0 | 0.00% | 0.00% | 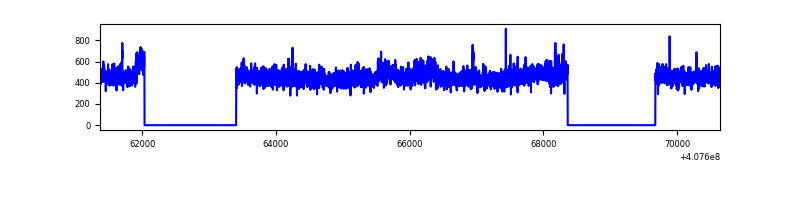 |
| C | 9274 | 6592 | 122 | 122 | 1.32% | 1.85% | 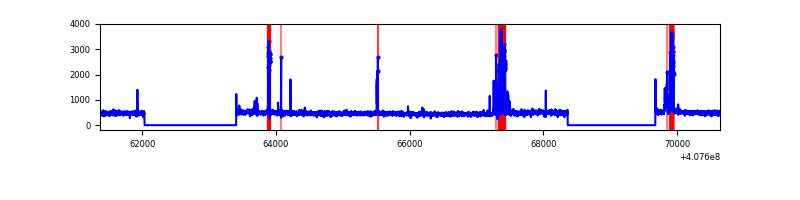 |
| D | 9274 | 6592 | 108 | 108 | 1.16% | 1.64% | 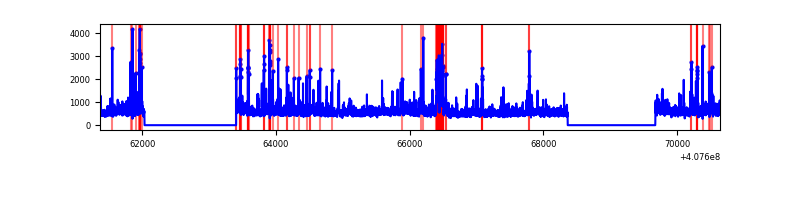 |
Top three noisy pixels from each quadrant. If the there are fewer than three noisy pixels in the level2.evt file, extra rows are filled as -1
| Pixel properties | Quadrant properties | ||||||
|---|---|---|---|---|---|---|---|
| Quadrant | DetID | PixID | Counts | Sigma | Mean | Median | Sigma |
| A | 10 | 83 | 444123 | 2995.33 | 726 | 710 | 148.0 |
| A | 13 | 248 | 273202 | 1840.73 | 726 | 710 | 148.0 |
| A | 12 | 16 | 94837 | 635.84 | 726 | 710 | 148.0 |
| B | 0 | 230 | 70168 | 490.46 | 726 | 703 | 141.6 |
| B | 5 | 200 | 34148 | 236.14 | 726 | 703 | 141.6 |
| B | 12 | 111 | 18478 | 125.5 | 726 | 703 | 141.6 |
| C | 10 | 20 | 380095 | 2292.79 | 710 | 714 | 165.5 |
| C | 15 | 214 | 292656 | 1764.35 | 710 | 714 | 165.5 |
| C | 1 | 23 | 37291 | 221.05 | 710 | 714 | 165.5 |
| D | 2 | 16 | 708805 | 4055.29 | 707 | 684 | 174.6 |
| D | 12 | 227 | 500893 | 2864.62 | 707 | 684 | 174.6 |
| D | 10 | 118 | 144402 | 823.05 | 707 | 684 | 174.6 |
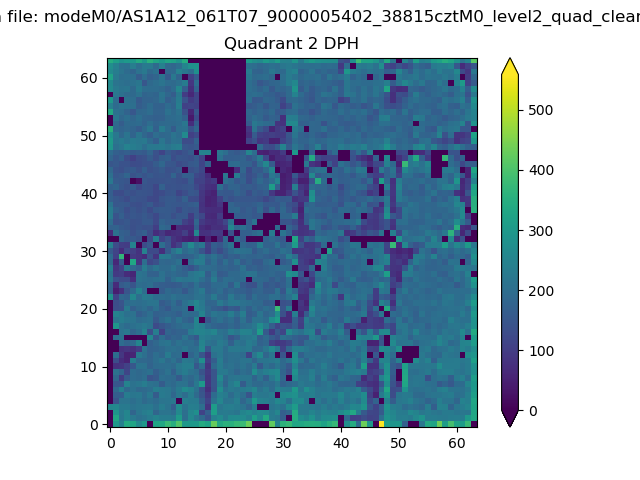
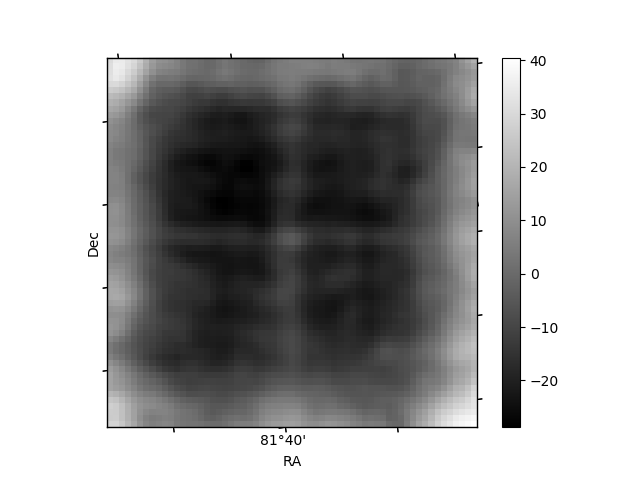
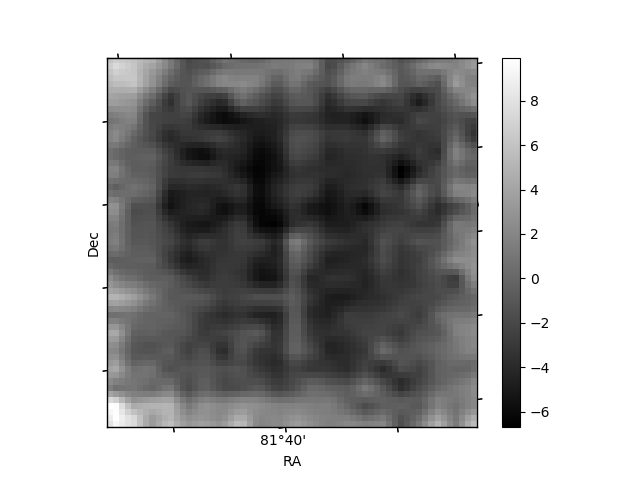
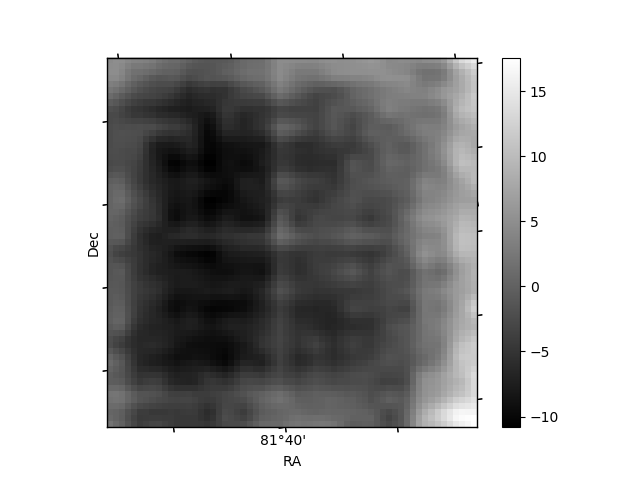
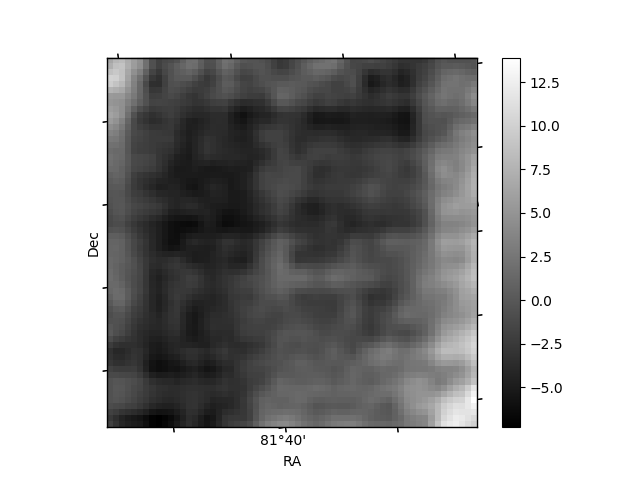
Histogram calculated using DETX and DETY for each event in the final _common_clean file
| Quadrant A | 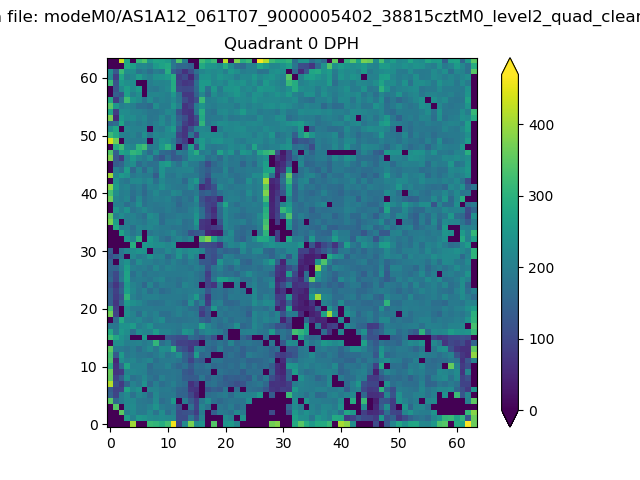 |
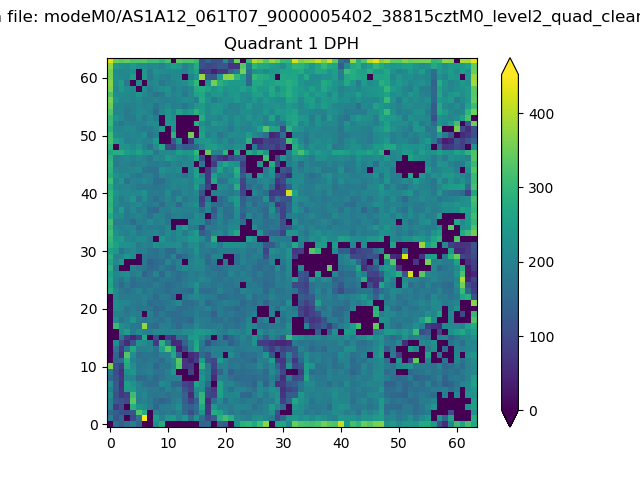 |
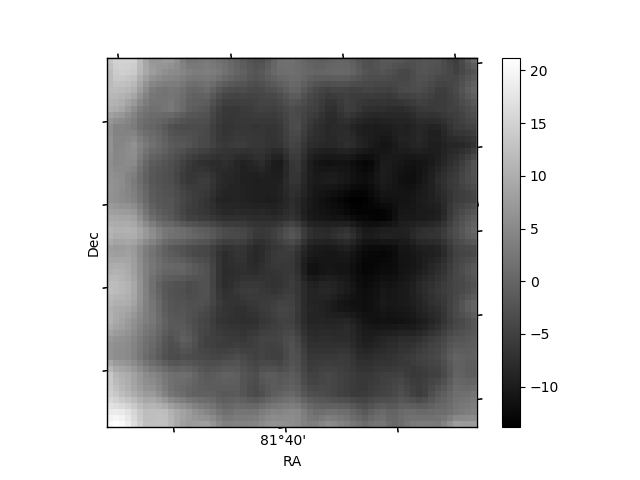
Quadrant B |
|---|---|---|---|
| Quadrant D | 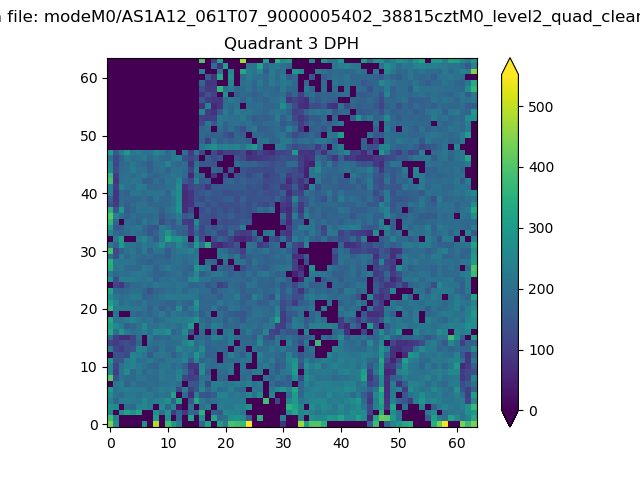 |
 |
Quadrant C |
| Plot type | Count rate plots | Images |
|---|---|---|
| Comparison with Poisson distribution Blue bars denote a histogram of data divided into 1 sec bins. Red curve is a Poisson curve with rate = median count rate of data. |
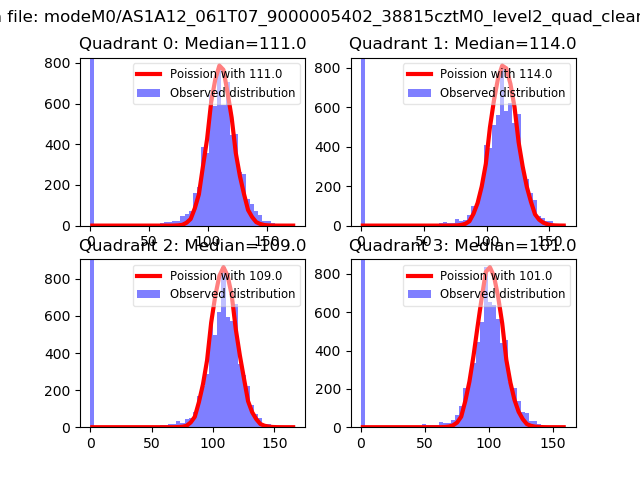 |
 |
| Quadrant-wise count rates Data is divided into 100 sec bins |
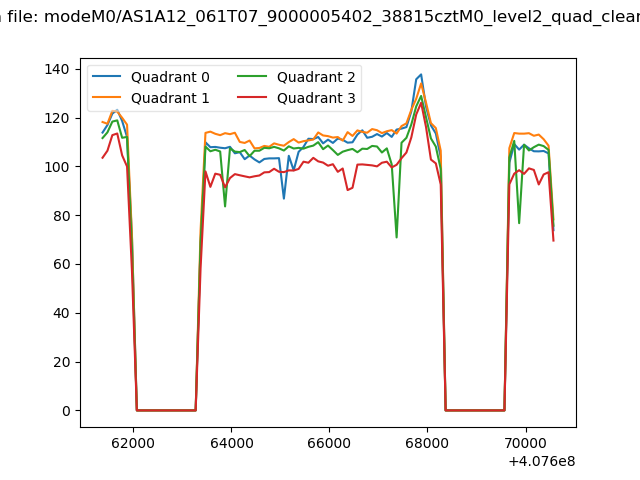 |
|
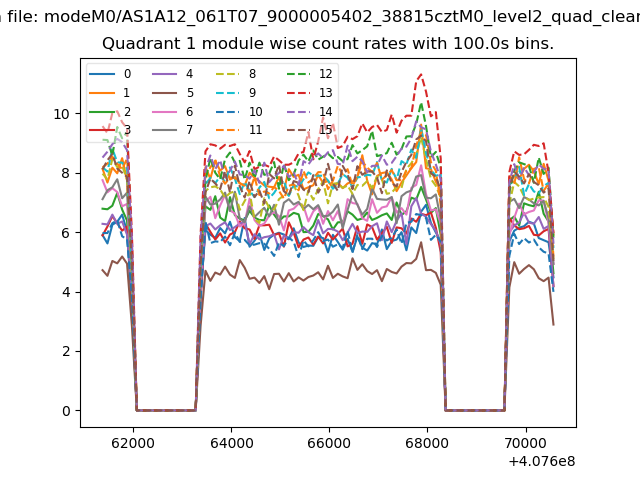
| Module-wise count rates for Quadrant A Data is divided into 100 sec bins |
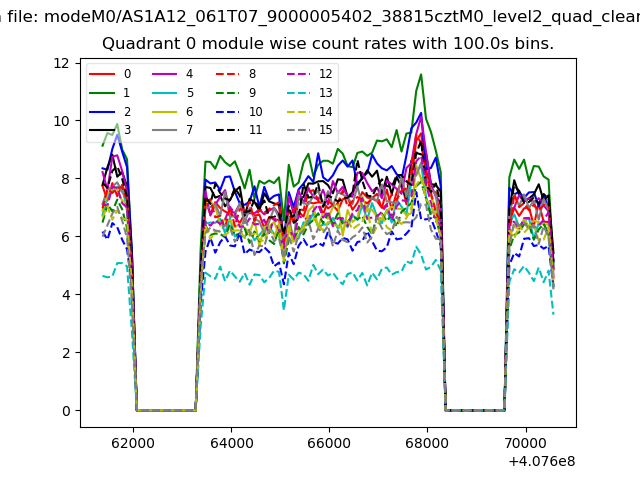 |
 |
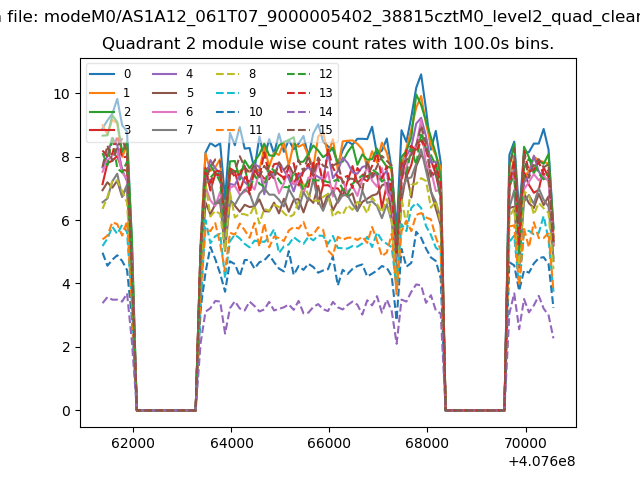
| Module-wise count rates for Quadrant B Data is divided into 100 sec bins |
 |
 |
| Module-wise count rates for Quadrant C Data is divided into 100 sec bins |
 |
 |
| Module-wise count rates for Quadrant D Data is divided into 100 sec bins |
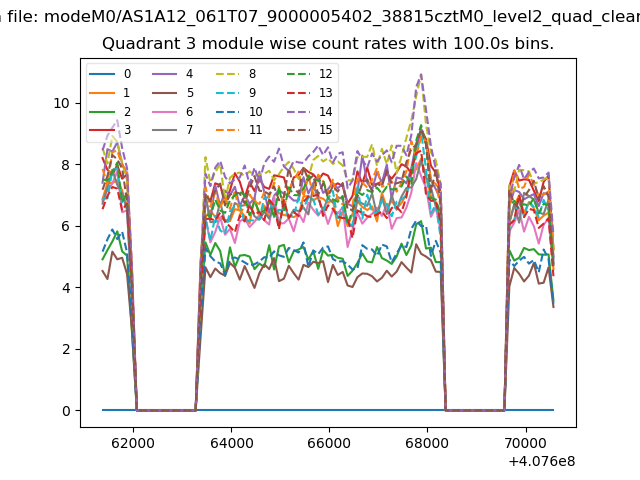 |
 |
| Parameter | Plot |
|---|---|
| CZT HV Monitor |  |
| D_VDD | 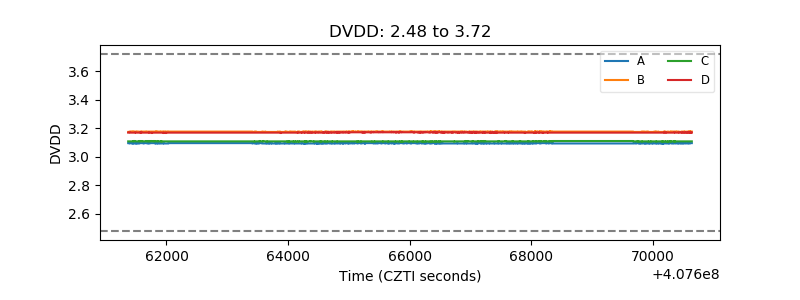 |
| Temperature 1 | 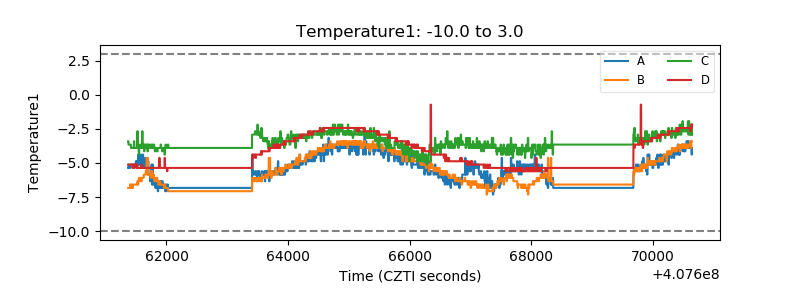 |
| Veto HV Monitor | 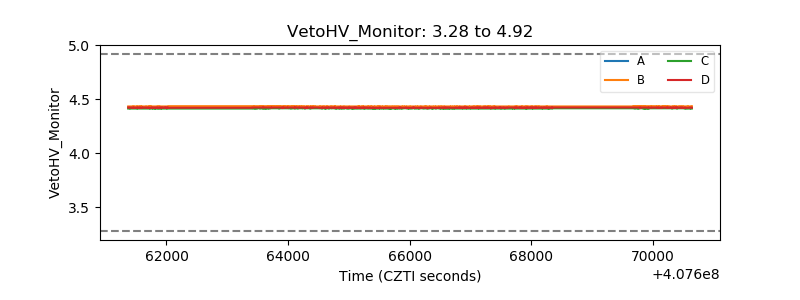 |
| Veto LLD | 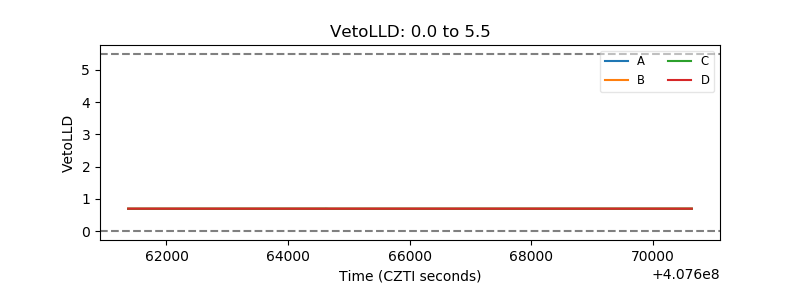 |
| Alpha Counter | 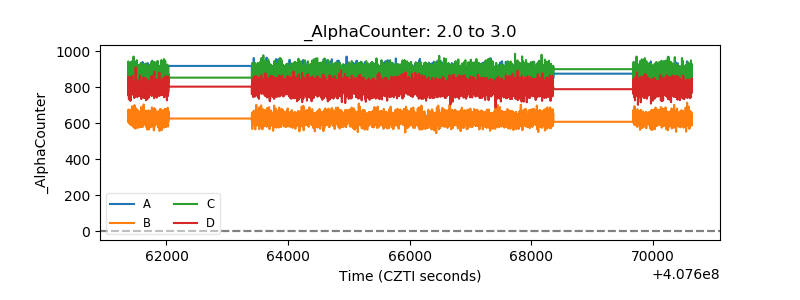 |
| _CPM_Rate | 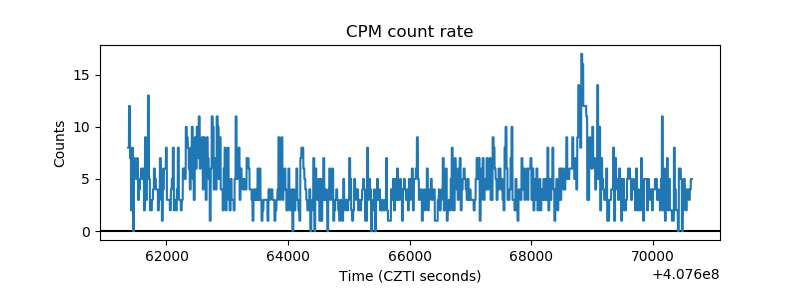 |
| CZT Counter | 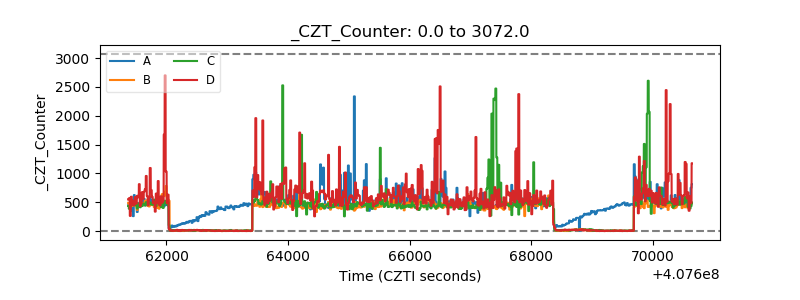 |
| +2.5 Volts monitor | 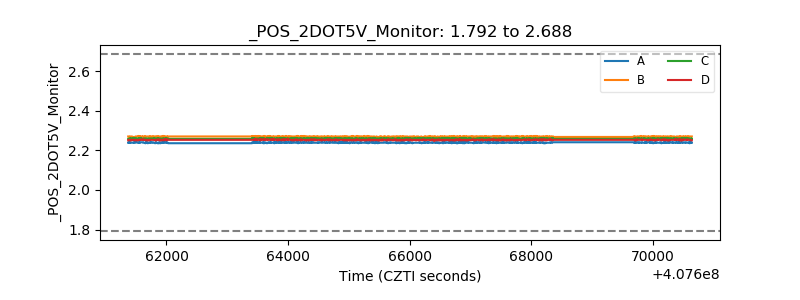 |
| +5 Volts monitor | 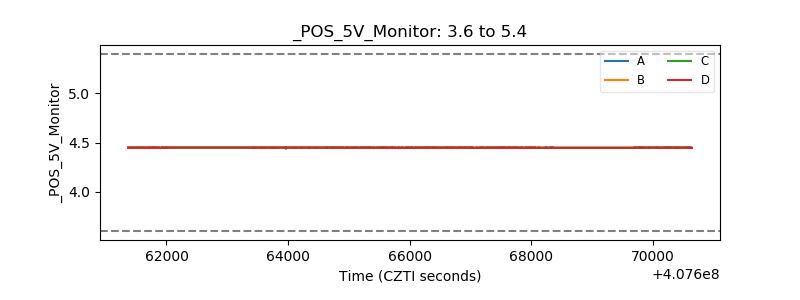 |
| _ROLL_ROT | 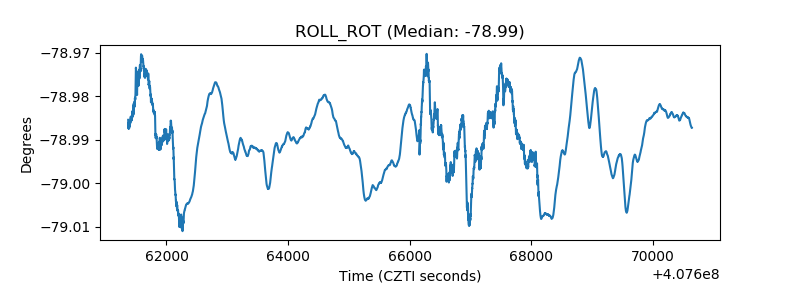 |
| _Roll_DEC | 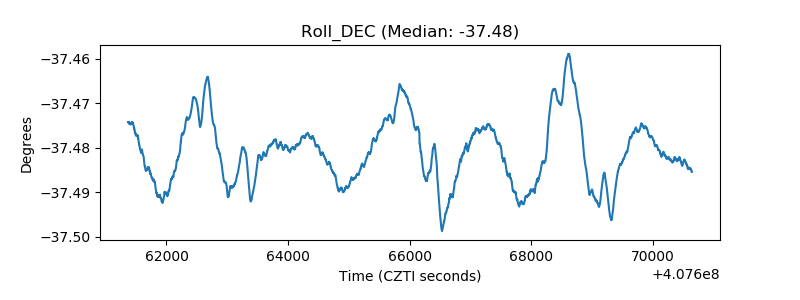 |
| _Roll_RA | 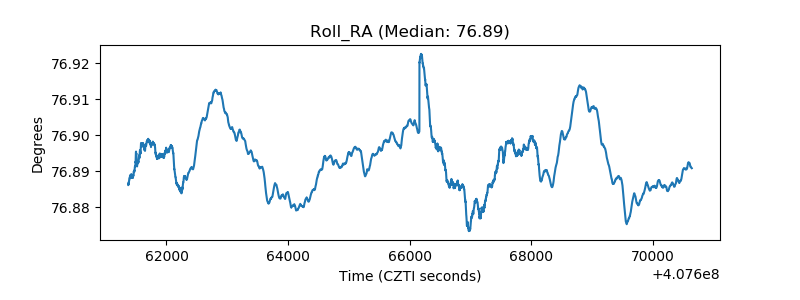 |
| Veto Counter | 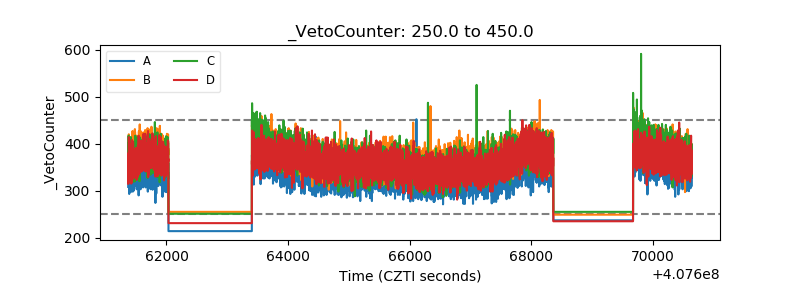 |