| Param | Original file | Final file |
|---|---|---|
| Filename | modeM0/AS1A12_061T07_9000005402_38819cztM0_level2.fits | modeM0/AS1A12_061T07_9000005402_38819cztM0_level2_quad_clean.evt |
| Size (bytes) | 371,381,760 | 102,597,120 |
| Size | 354.2 MB | 97.8 MB |
| Events in quadrant A | 3,457,226 | 680,667 |
| Events in quadrant B | 2,820,258 | 700,715 |
| Events in quadrant C | 3,066,785 | 672,897 |
| Events in quadrant D | 3,915,968 | 615,586 |
| Mode M9 | |||
|---|---|---|---|
| Quadrant | BADHDUFLAG | Total packets | Discarded packets |
| A | 0 | 24 | 0 |
| B | 0 | 24 | 0 |
| C | 0 | 24 | 0 |
| D | 0 | 25 | 0 |
| Mode SS | |||
|---|---|---|---|
| Quadrant | BADHDUFLAG | Total packets | Discarded packets |
| A | 0 | 126 | 0 |
| B | 0 | 126 | 0 |
| C | 0 | 126 | 0 |
| D | 0 | 126 | 0 |
| Mode M0 | |||
|---|---|---|---|
| Quadrant | BADHDUFLAG | Total packets | Discarded packets |
| A | 0 | 14178 | 3 |
| B | 0 | 12653 | 2 |
| C | 0 | 13020 | 2 |
| D | 0 | 15854 | 2 |
| Quadrant | Total seconds | Saturated seconds | Saturation percentage |
|---|---|---|---|
| A | 6259 | 47 | 0.750919% |
| B | 6259 | 15 | 0.239655% |
| C | 6259 | 44 | 0.702988% |
| D | 6259 | 95 | 1.517814% |
Noise dominated data is calculated using 1-second bins in cleaned event files. If a bin has >2000 counts, and if more than 50% of those come from <1% of pixels, then it is considered to be noise-dominated and hence unusable.
| Quadrant | # 1 sec bins | Bins with >0 counts | Bins with >2000 counts | High rate bins dominated by noise | Noise dominated (total time) | Noise dominated (detector-on time) | Marked lightcurve |
|---|---|---|---|---|---|---|---|
| A | 7601 | 6260 | 25 | 25 | 0.33% | 0.40% | 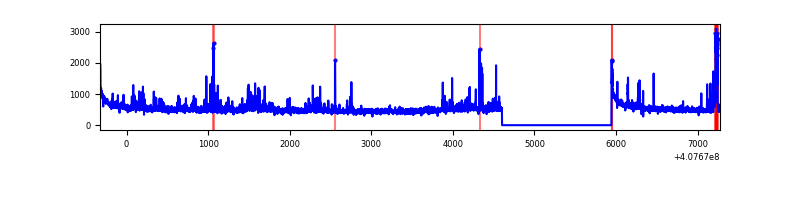 |
| B | 7601 | 6260 | 1 | 1 | 0.01% | 0.02% | 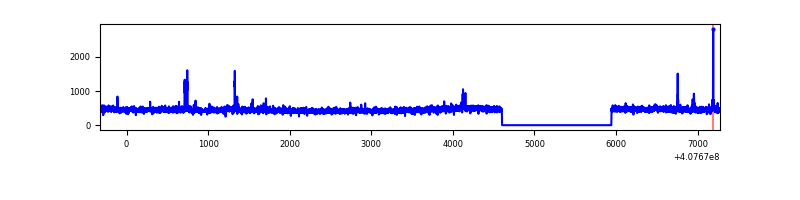 |
| C | 7601 | 6260 | 34 | 34 | 0.45% | 0.54% | 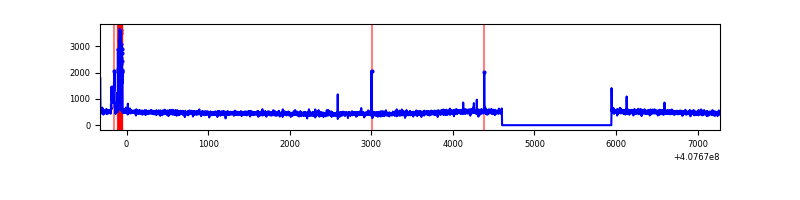 |
| D | 7601 | 6260 | 69 | 69 | 0.91% | 1.10% | 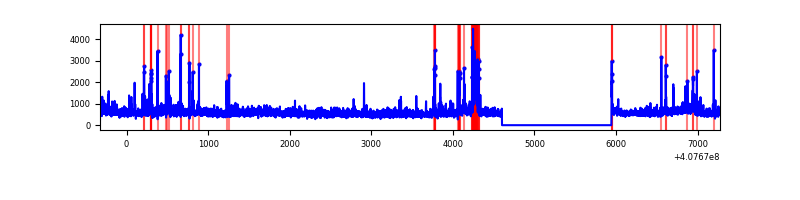 |
Top three noisy pixels from each quadrant. If the there are fewer than three noisy pixels in the level2.evt file, extra rows are filled as -1
| Pixel properties | Quadrant properties | ||||||
|---|---|---|---|---|---|---|---|
| Quadrant | DetID | PixID | Counts | Sigma | Mean | Median | Sigma |
| A | 10 | 83 | 434859 | 3103.38 | 691 | 677 | 139.9 |
| A | 13 | 248 | 216767 | 1544.54 | 691 | 677 | 139.9 |
| A | 12 | 16 | 79651 | 564.48 | 691 | 677 | 139.9 |
| B | 0 | 230 | 36755 | 266.87 | 691 | 670 | 135.2 |
| B | 5 | 172 | 35342 | 256.42 | 691 | 670 | 135.2 |
| B | 12 | 111 | 17473 | 124.27 | 691 | 670 | 135.2 |
| C | 15 | 214 | 279097 | 1755.96 | 678 | 680 | 158.6 |
| C | 10 | 20 | 131962 | 827.99 | 678 | 680 | 158.6 |
| C | 0 | 10 | 6088 | 34.11 | 678 | 680 | 158.6 |
| D | 2 | 16 | 679416 | 4087.88 | 673 | 654 | 166.0 |
| D | 10 | 118 | 231274 | 1388.92 | 673 | 654 | 166.0 |
| D | 12 | 235 | 171294 | 1027.69 | 673 | 654 | 166.0 |
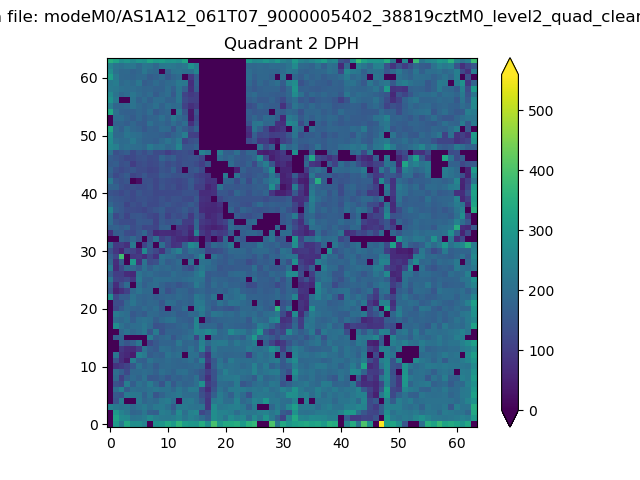
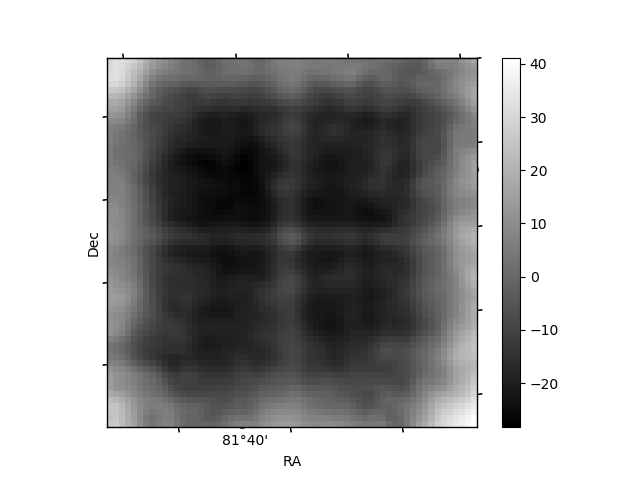
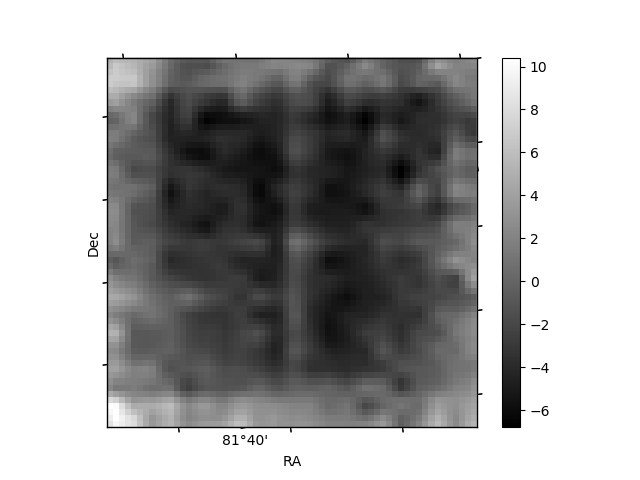
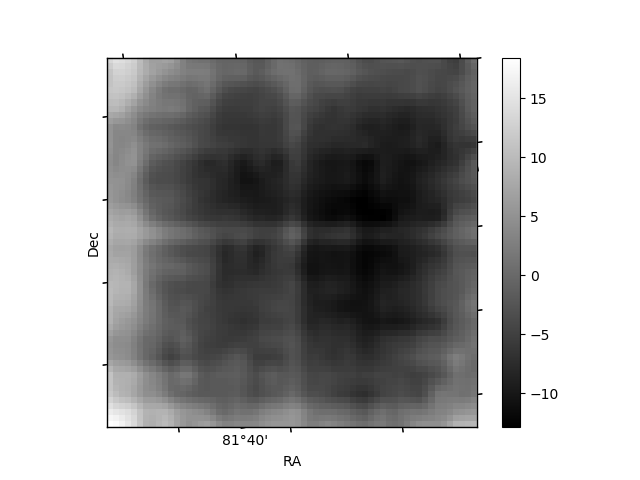
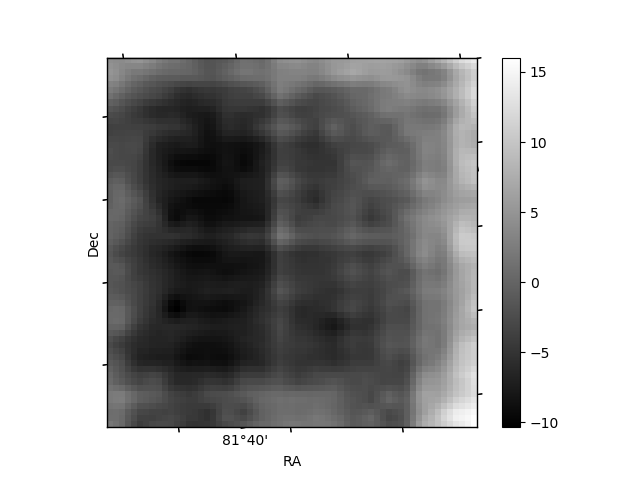
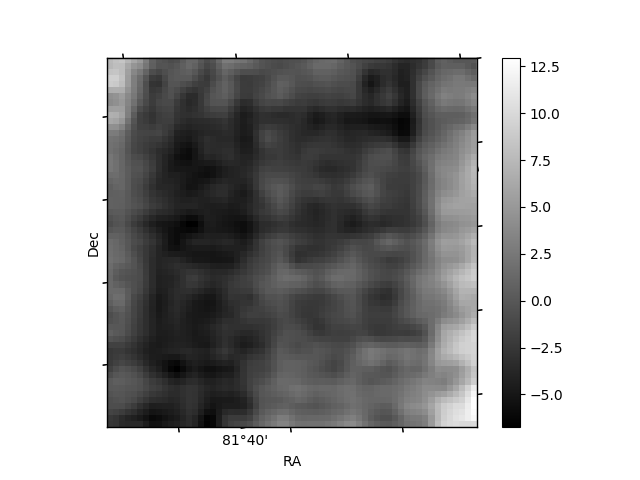
Histogram calculated using DETX and DETY for each event in the final _common_clean file
| Quadrant A | 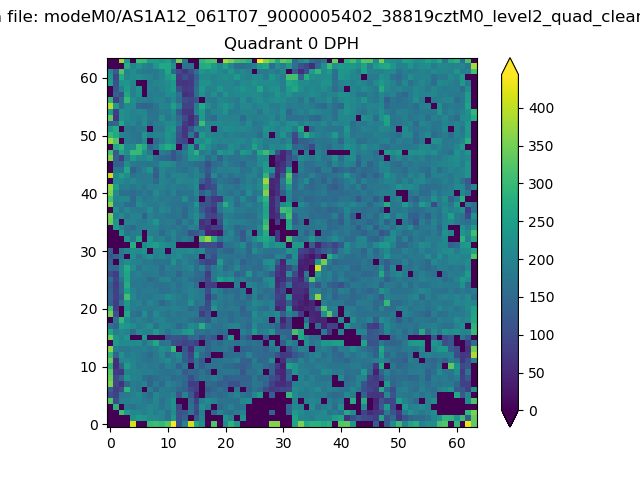 |
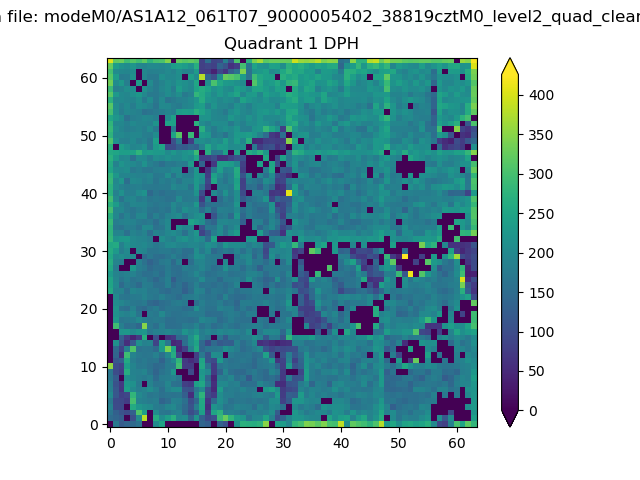 |
Quadrant B |
|---|---|---|---|
| Quadrant D | 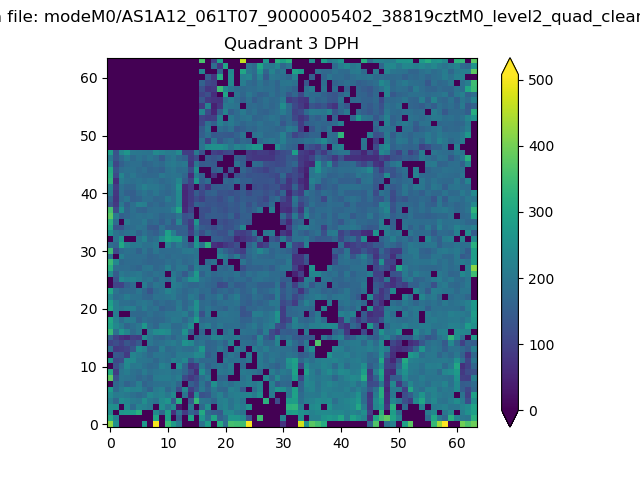 |
 |
Quadrant C |
| Plot type | Count rate plots | Images |
|---|---|---|
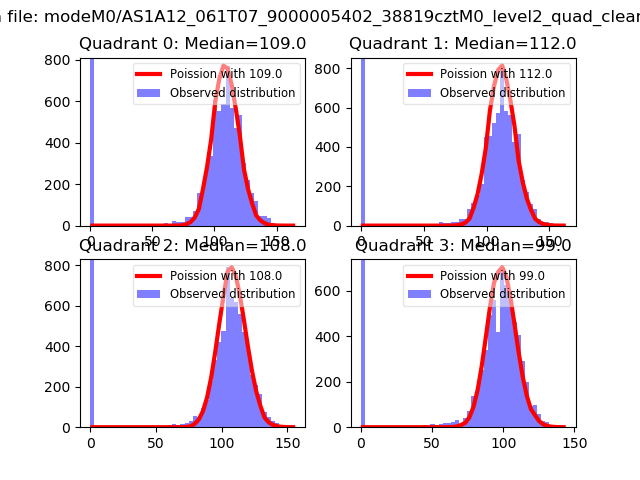
| Comparison with Poisson distribution Blue bars denote a histogram of data divided into 1 sec bins. Red curve is a Poisson curve with rate = median count rate of data. |
 |
 |
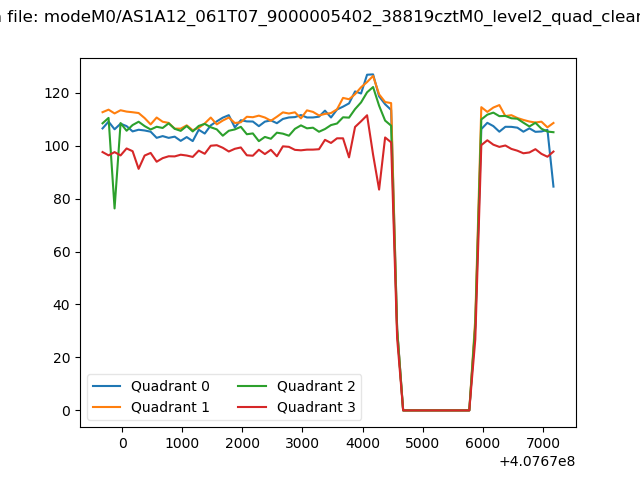
| Quadrant-wise count rates Data is divided into 100 sec bins |
 |
|
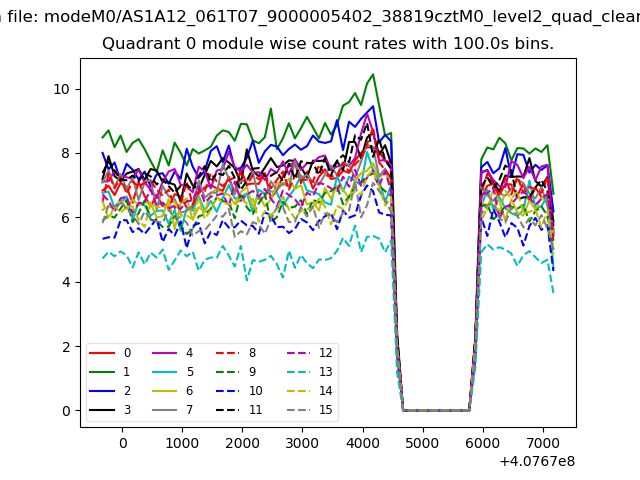
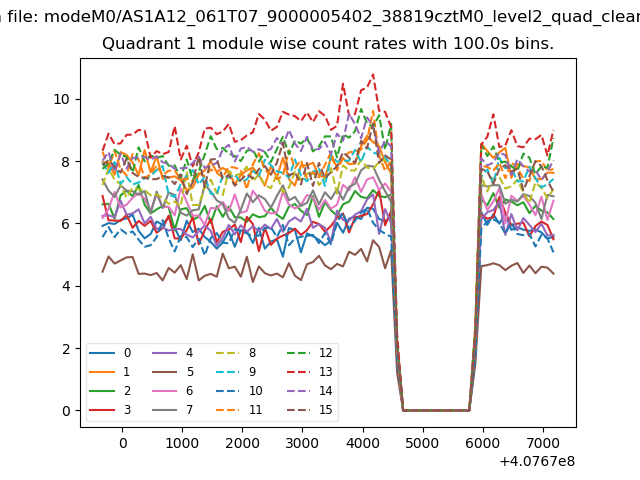
| Module-wise count rates for Quadrant A Data is divided into 100 sec bins |
 |
 |
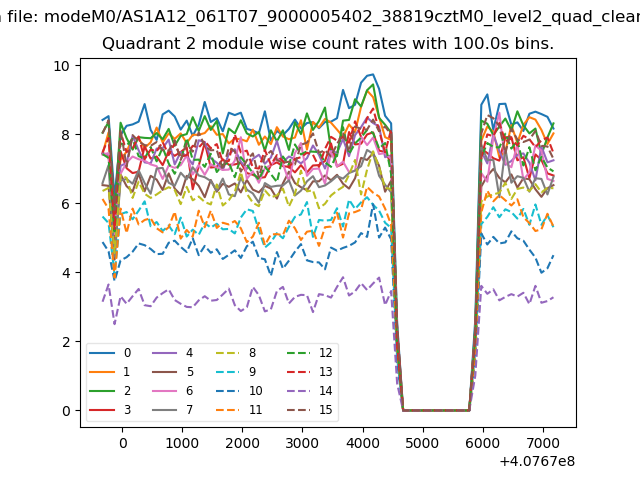
| Module-wise count rates for Quadrant B Data is divided into 100 sec bins |
 |
 |
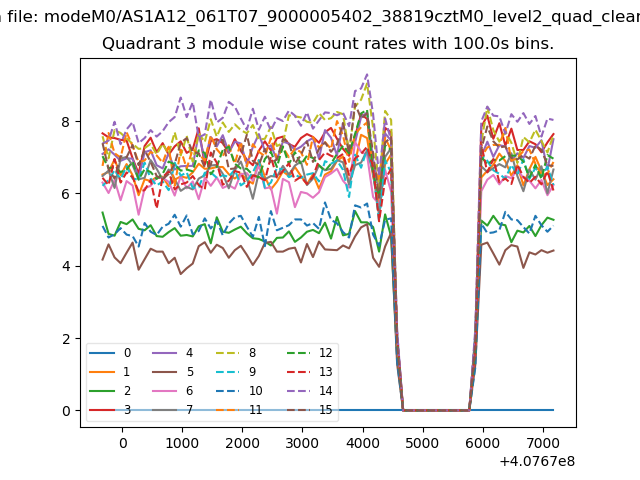
| Module-wise count rates for Quadrant C Data is divided into 100 sec bins |
 |
 |
| Module-wise count rates for Quadrant D Data is divided into 100 sec bins |
 |
 |
| Parameter | Plot |
|---|---|
| CZT HV Monitor | 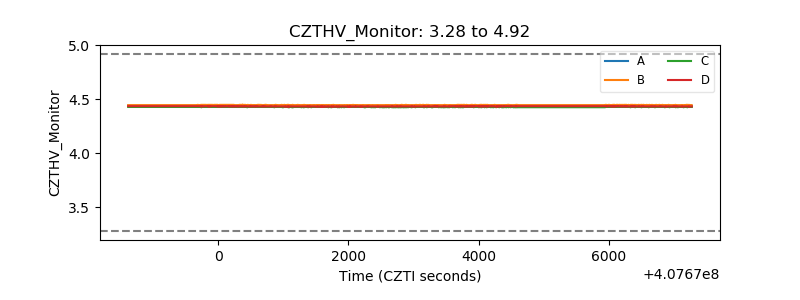 |
| D_VDD | 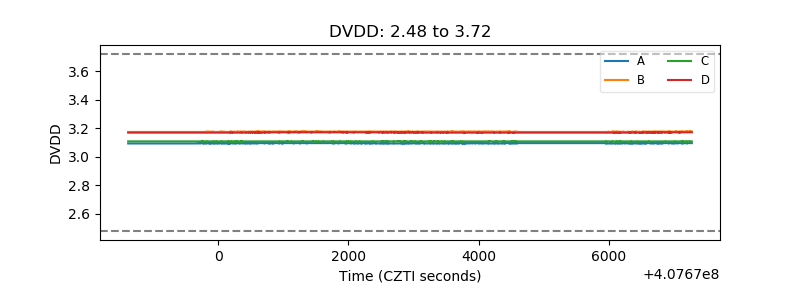 |
| Temperature 1 | 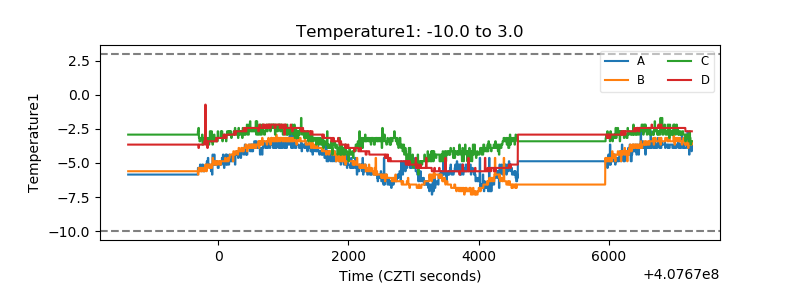 |
| Veto HV Monitor |  |
| Veto LLD | 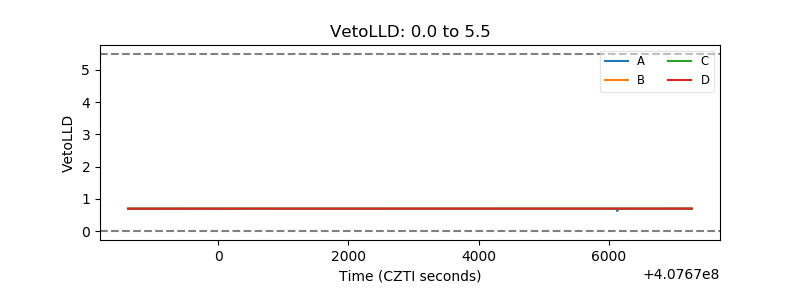 |
| Alpha Counter | 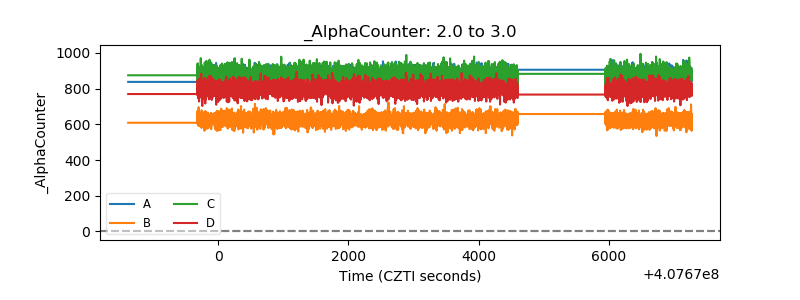 |
| _CPM_Rate | 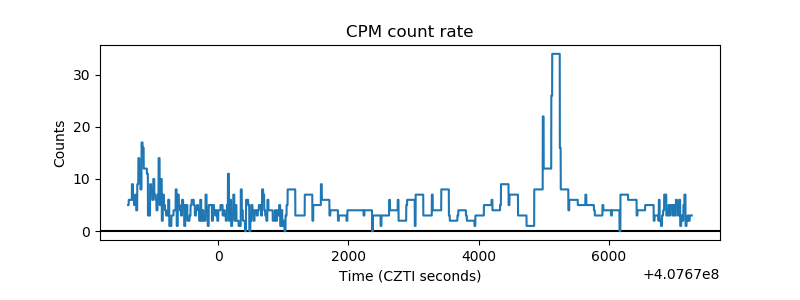 |
| CZT Counter | 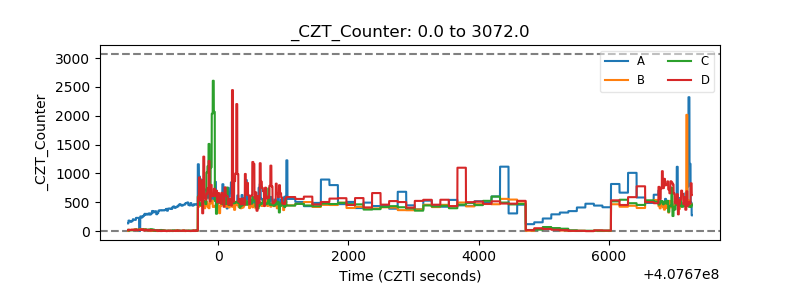 |
| +2.5 Volts monitor | 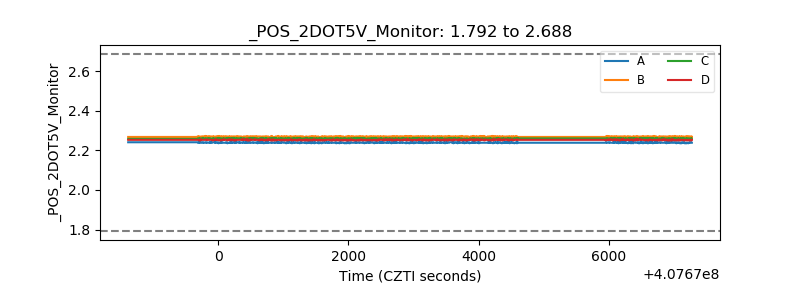 |
| +5 Volts monitor | 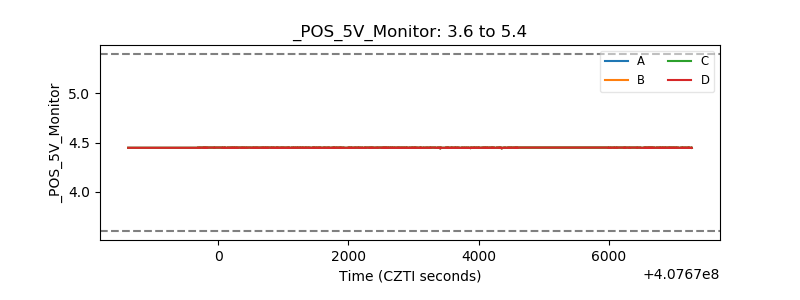 |
| _ROLL_ROT | 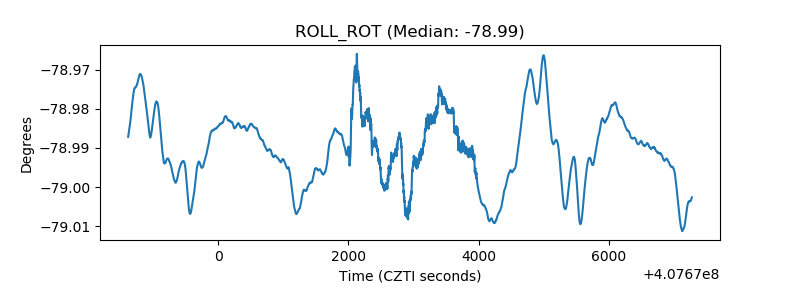 |
| _Roll_DEC | 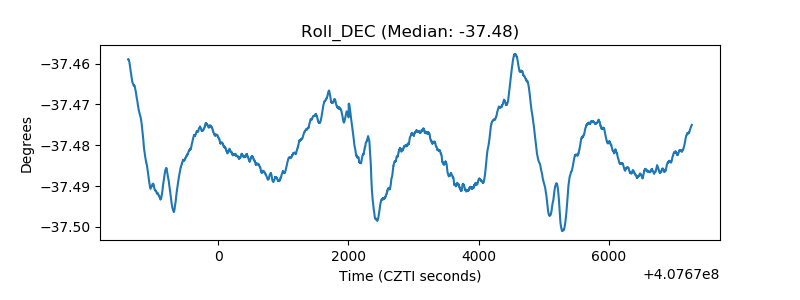 |
| _Roll_RA | 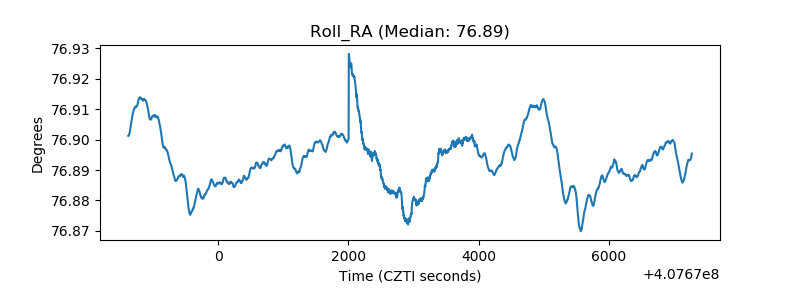 |
| Veto Counter | 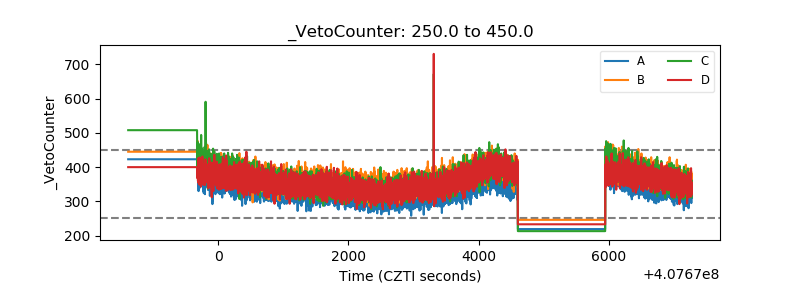 |