| Param | Original file | Final file |
|---|---|---|
| Filename | modeM0/AS1A12_061T07_9000005402_38821cztM0_level2.fits | modeM0/AS1A12_061T07_9000005402_38821cztM0_level2_quad_clean.evt |
| Size (bytes) | 1,088,184,960 | 308,180,160 |
| Size | 1.0 GB | 293.9 MB |
| Events in quadrant A | 10,041,230 | 2,092,717 |
| Events in quadrant B | 8,288,011 | 2,124,269 |
| Events in quadrant C | 9,120,649 | 1,988,804 |
| Events in quadrant D | 11,402,895 | 1,854,602 |
| Mode M9 | |||
|---|---|---|---|
| Quadrant | BADHDUFLAG | Total packets | Discarded packets |
| A | 0 | 64 | 0 |
| B | 0 | 64 | 0 |
| C | 0 | 64 | 0 |
| D | 0 | 64 | 0 |
| Mode SS | |||
|---|---|---|---|
| Quadrant | BADHDUFLAG | Total packets | Discarded packets |
| A | 0 | 376 | 0 |
| B | 0 | 376 | 0 |
| C | 0 | 376 | 0 |
| D | 0 | 376 | 0 |
| Mode M0 | |||
|---|---|---|---|
| Quadrant | BADHDUFLAG | Total packets | Discarded packets |
| A | 0 | 41828 | 5 |
| B | 0 | 37295 | 4 |
| C | 0 | 38912 | 4 |
| D | 0 | 46457 | 4 |
| Quadrant | Total seconds | Saturated seconds | Saturation percentage |
|---|---|---|---|
| A | 18446 | 109 | 0.590914% |
| B | 18446 | 20 | 0.108425% |
| C | 18446 | 82 | 0.444541% |
| D | 18446 | 167 | 0.905345% |
Noise dominated data is calculated using 1-second bins in cleaned event files. If a bin has >2000 counts, and if more than 50% of those come from <1% of pixels, then it is considered to be noise-dominated and hence unusable.
| Quadrant | # 1 sec bins | Bins with >0 counts | Bins with >2000 counts | High rate bins dominated by noise | Noise dominated (total time) | Noise dominated (detector-on time) | Marked lightcurve |
|---|---|---|---|---|---|---|---|
| A | 24868 | 18450 | 98 | 98 | 0.39% | 0.53% | 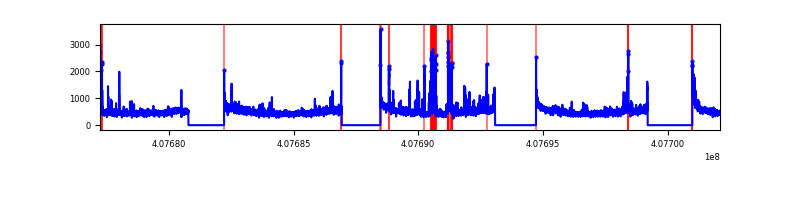 |
| B | 24868 | 18450 | 3 | 3 | 0.01% | 0.02% | 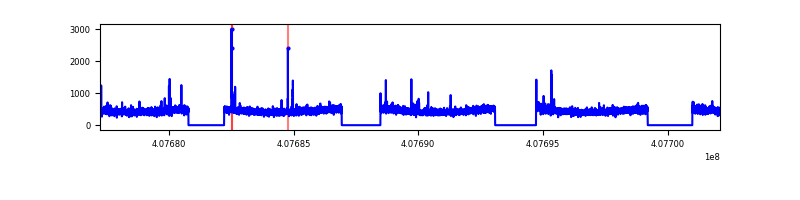 |
| C | 24868 | 18450 | 68 | 68 | 0.27% | 0.37% | 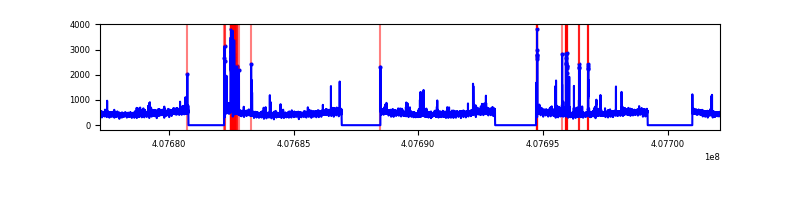 |
| D | 24868 | 18450 | 161 | 161 | 0.65% | 0.87% | 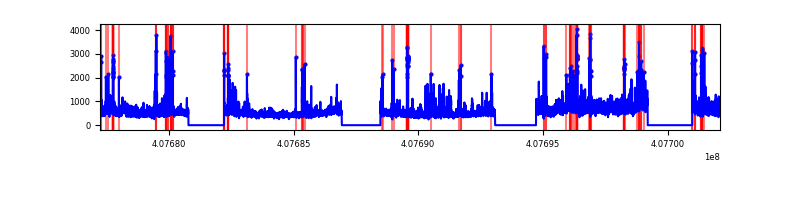 |
Top three noisy pixels from each quadrant. If the there are fewer than three noisy pixels in the level2.evt file, extra rows are filled as -1
| Pixel properties | Quadrant properties | ||||||
|---|---|---|---|---|---|---|---|
| Quadrant | DetID | PixID | Counts | Sigma | Mean | Median | Sigma |
| A | 10 | 83 | 1129224 | 2752.22 | 2033 | 1997 | 409.6 |
| A | 13 | 248 | 978738 | 2384.8 | 2033 | 1997 | 409.6 |
| A | 9 | 143 | 35274 | 81.25 | 2033 | 1997 | 409.6 |
| B | 0 | 230 | 94191 | 237.42 | 2030 | 1977 | 388.4 |
| B | 4 | 251 | 53291 | 132.12 | 2030 | 1977 | 388.4 |
| B | 12 | 111 | 50345 | 124.53 | 2030 | 1977 | 388.4 |
| C | 15 | 214 | 802112 | 1748.78 | 1975 | 1985 | 457.5 |
| C | 1 | 23 | 354404 | 770.25 | 1975 | 1985 | 457.5 |
| C | 14 | 254 | 113942 | 244.7 | 1975 | 1985 | 457.5 |
| D | 12 | 235 | 1188723 | 2510.69 | 1960 | 1912 | 472.7 |
| D | 2 | 16 | 1065846 | 2250.75 | 1960 | 1912 | 472.7 |
| D | 5 | 222 | 562017 | 1184.9 | 1960 | 1912 | 472.7 |
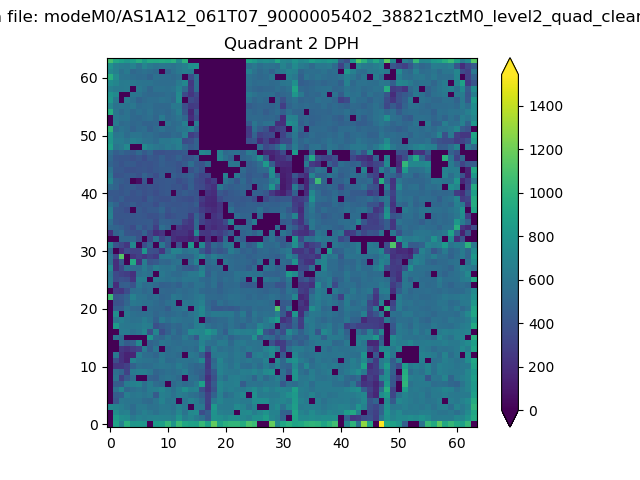
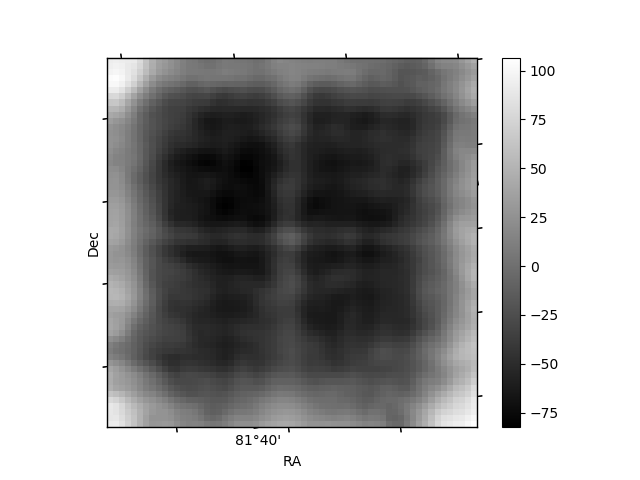
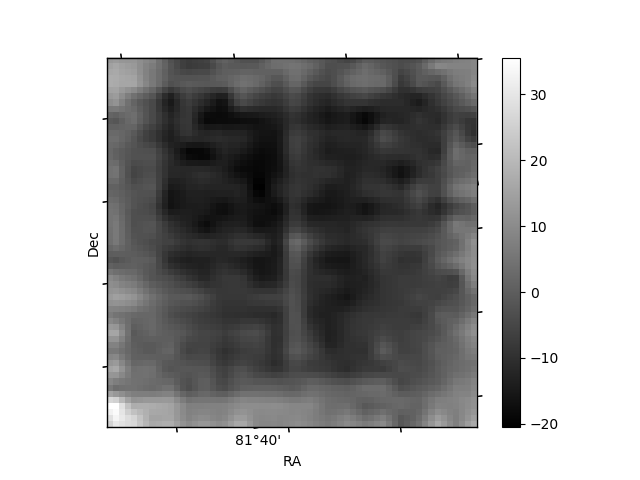
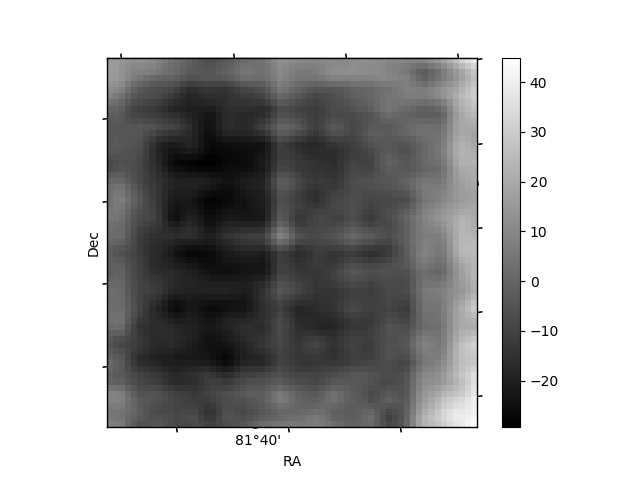
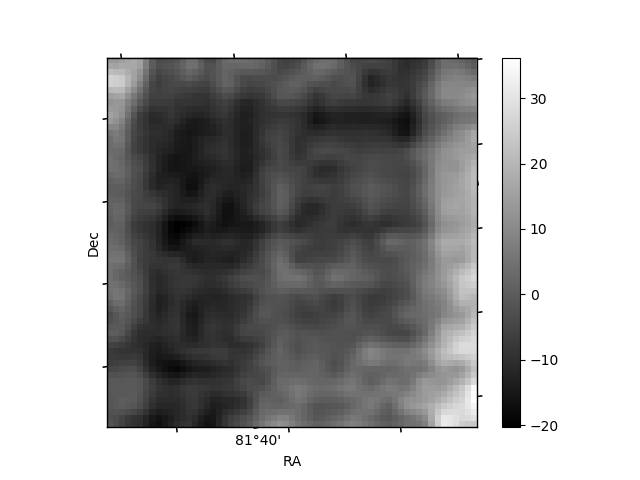
Histogram calculated using DETX and DETY for each event in the final _common_clean file
| Quadrant A | 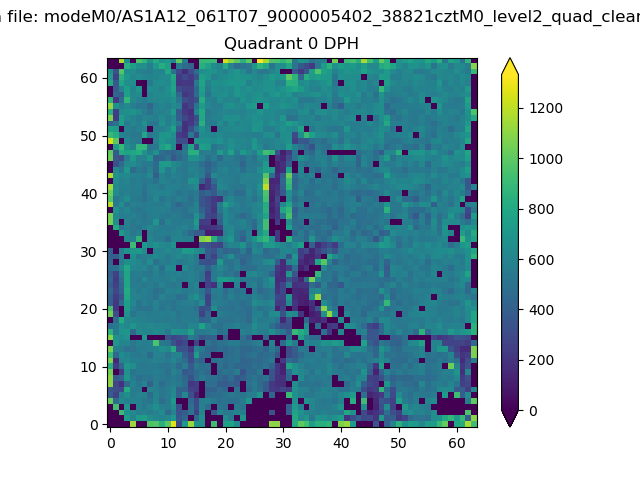 |
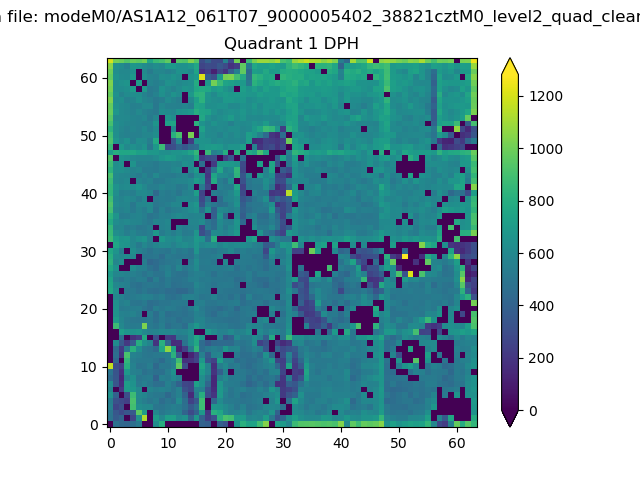 |
Quadrant B |
|---|---|---|---|
| Quadrant D | 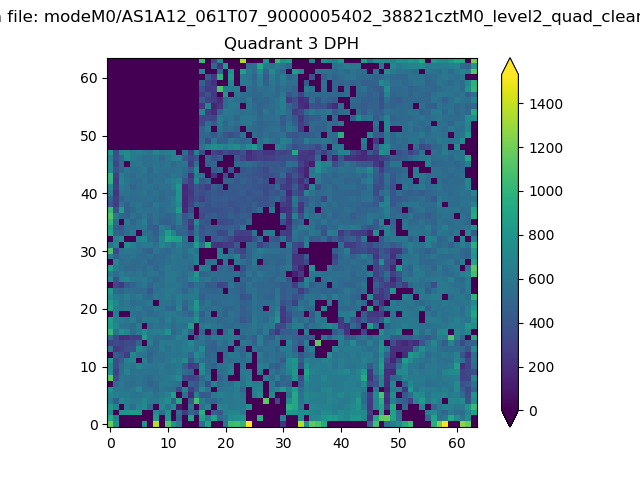 |
 |
Quadrant C |
| Plot type | Count rate plots | Images |
|---|---|---|
| Comparison with Poisson distribution Blue bars denote a histogram of data divided into 1 sec bins. Red curve is a Poisson curve with rate = median count rate of data. |
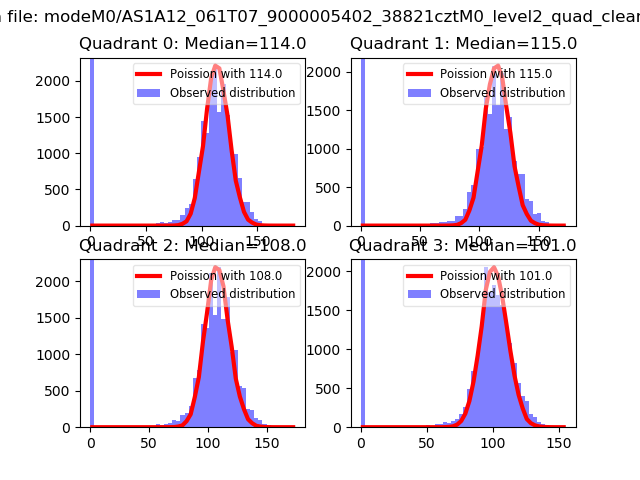 |
 |
| Quadrant-wise count rates Data is divided into 100 sec bins |
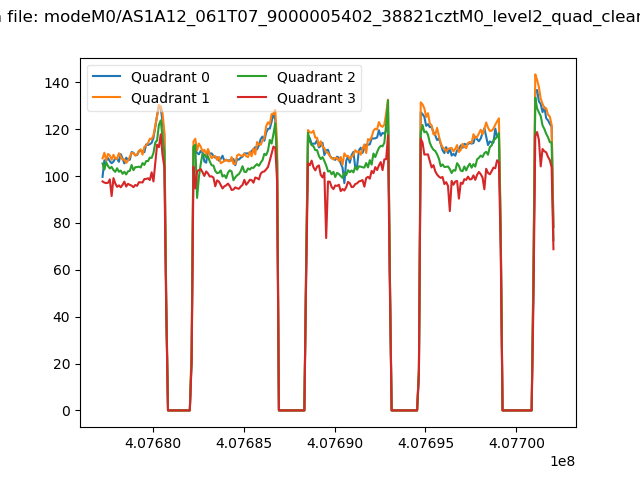 |
|
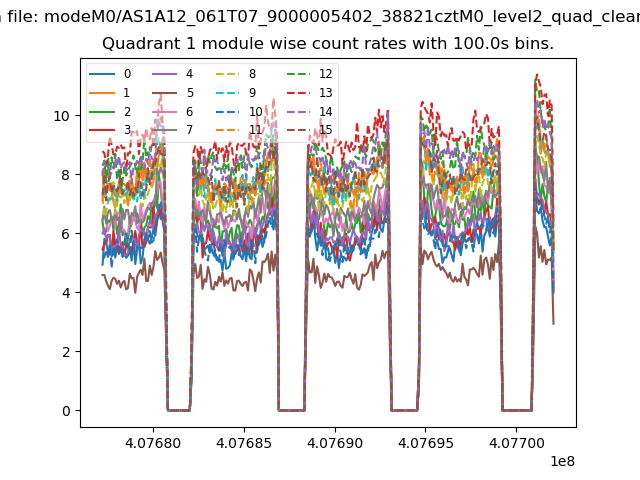
| Module-wise count rates for Quadrant A Data is divided into 100 sec bins |
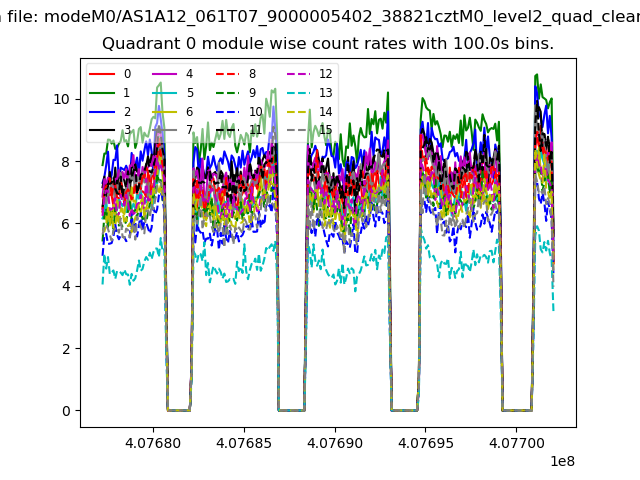 |
 |
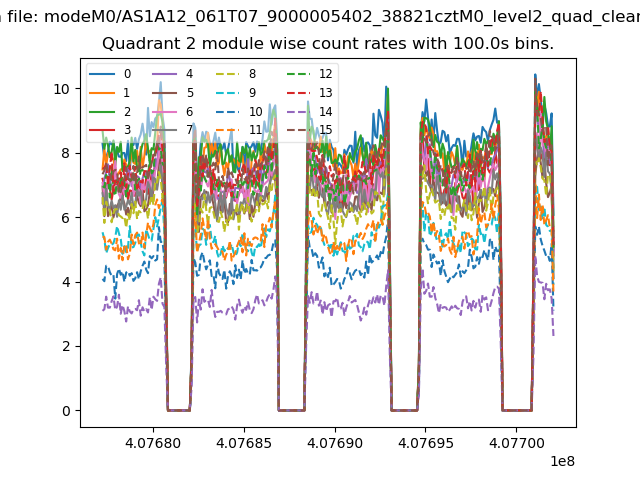
| Module-wise count rates for Quadrant B Data is divided into 100 sec bins |
 |
 |
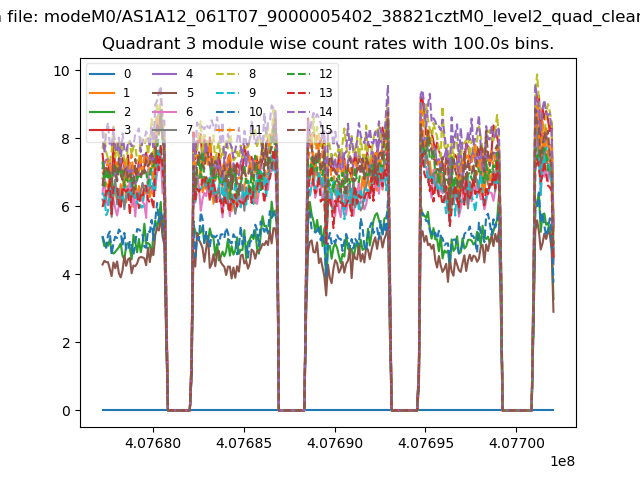
| Module-wise count rates for Quadrant C Data is divided into 100 sec bins |
 |
 |
| Module-wise count rates for Quadrant D Data is divided into 100 sec bins |
 |
 |
| Parameter | Plot |
|---|---|
| CZT HV Monitor | 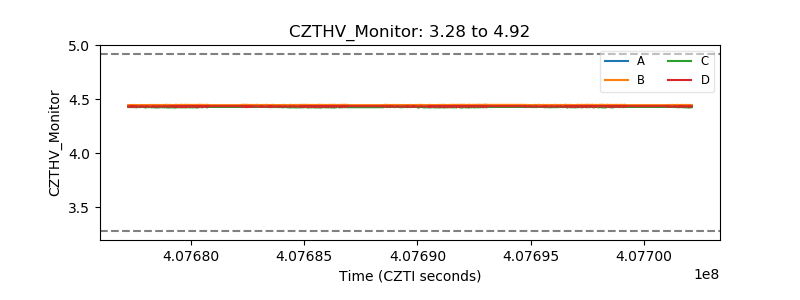 |
| D_VDD | 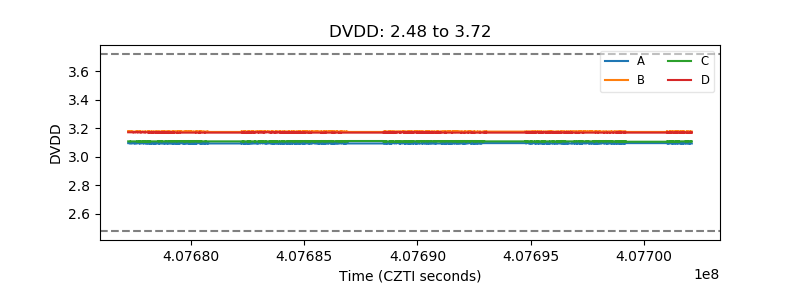 |
| Temperature 1 | 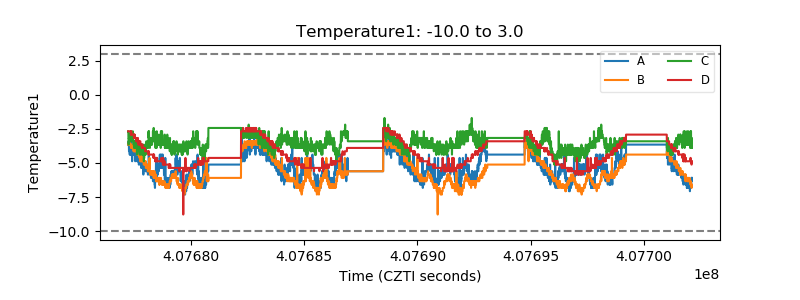 |
| Veto HV Monitor | 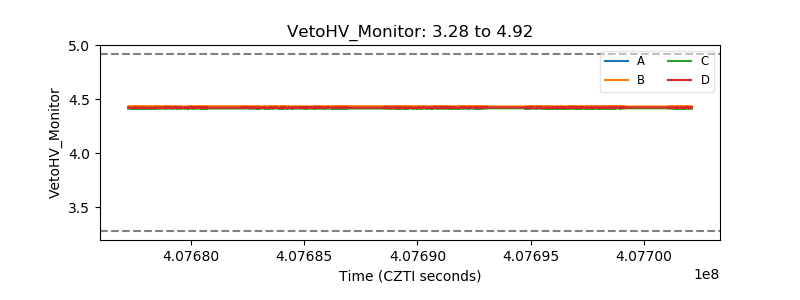 |
| Veto LLD | 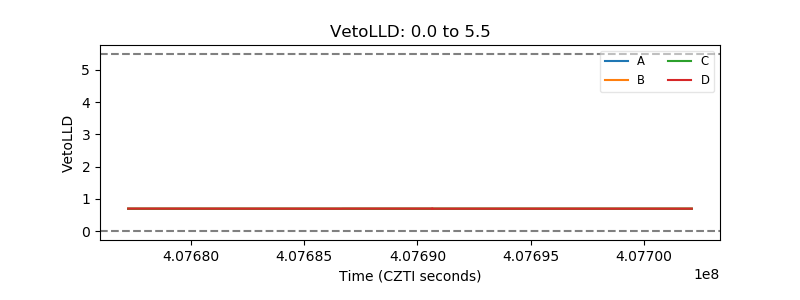 |
| Alpha Counter | 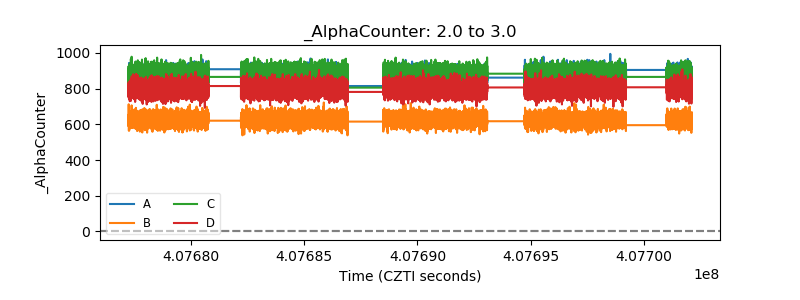 |
| _CPM_Rate | 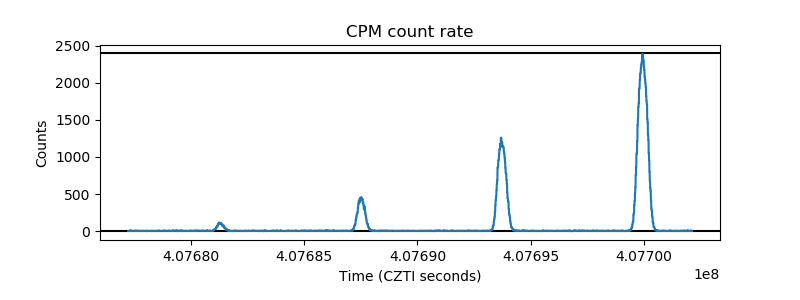 |
| CZT Counter | 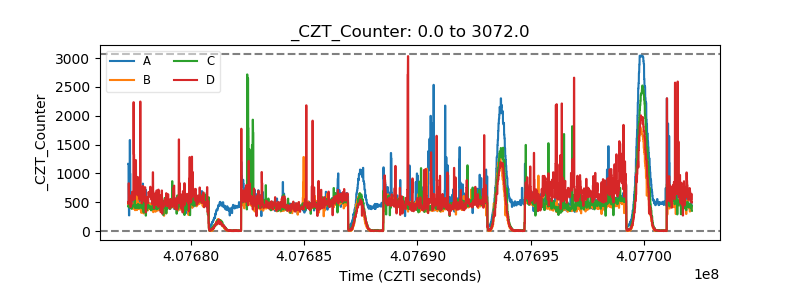 |
| +2.5 Volts monitor | 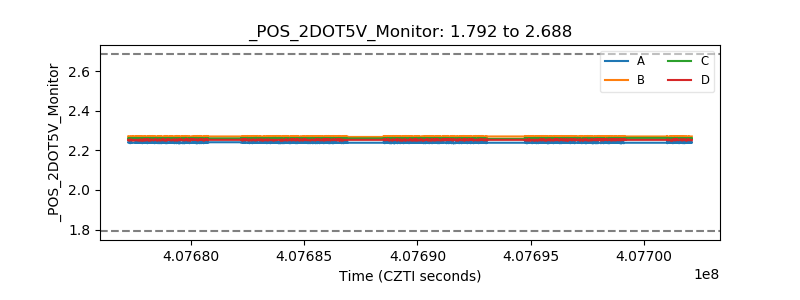 |
| +5 Volts monitor | 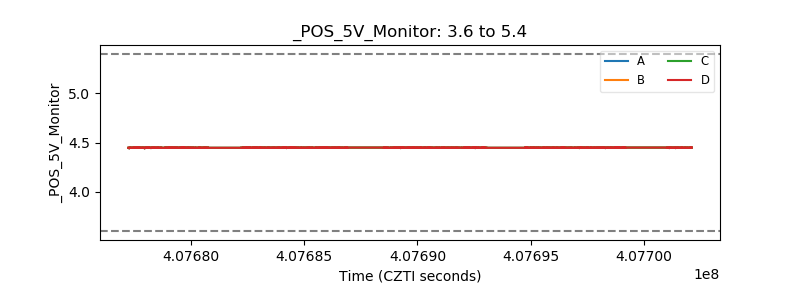 |
| _ROLL_ROT | 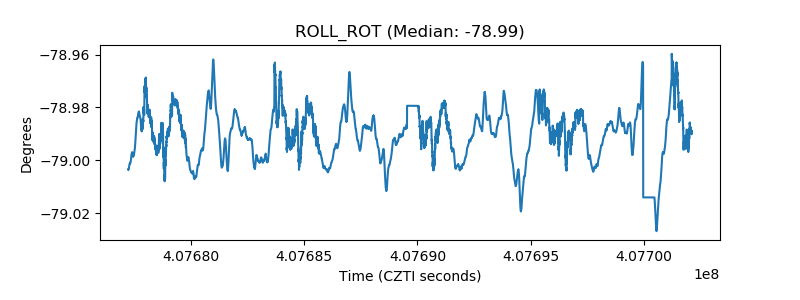 |
| _Roll_DEC | 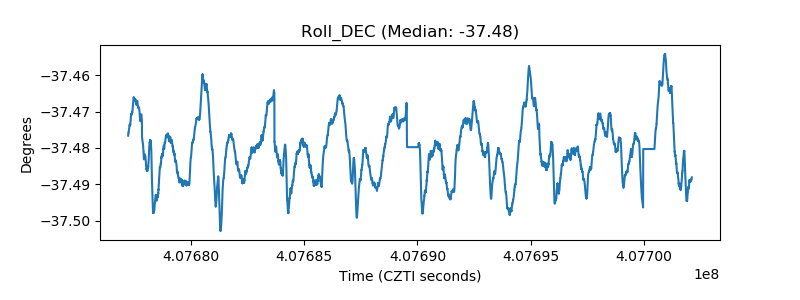 |
| _Roll_RA | 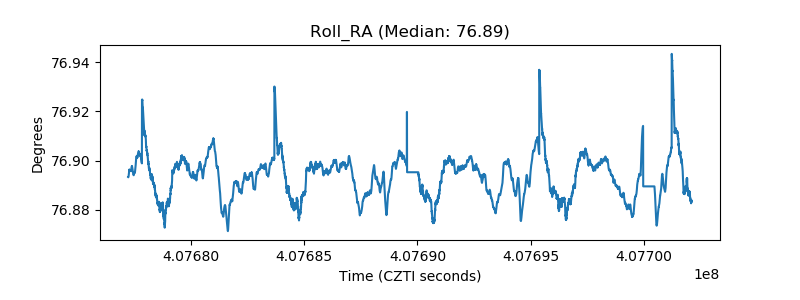 |
| Veto Counter | 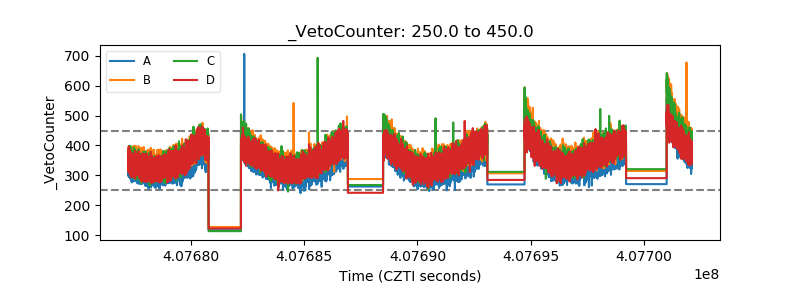 |