| Param | Original file | Final file |
|---|---|---|
| Filename | modeM0/AS1A12_061T07_9000005402_38822cztM0_level2.fits | modeM0/AS1A12_061T07_9000005402_38822cztM0_level2_quad_clean.evt |
| Size (bytes) | 327,896,640 | 96,756,480 |
| Size | 312.7 MB | 92.3 MB |
| Events in quadrant A | 3,012,200 | 661,497 |
| Events in quadrant B | 2,481,612 | 683,484 |
| Events in quadrant C | 2,647,629 | 632,380 |
| Events in quadrant D | 3,579,337 | 577,816 |
| Mode M9 | |||
|---|---|---|---|
| Quadrant | BADHDUFLAG | Total packets | Discarded packets |
| A | 0 | 23 | 0 |
| B | 0 | 23 | 0 |
| C | 0 | 23 | 0 |
| D | 0 | 24 | 0 |
| Mode SS | |||
|---|---|---|---|
| Quadrant | BADHDUFLAG | Total packets | Discarded packets |
| A | 0 | 110 | 0 |
| B | 0 | 110 | 0 |
| C | 0 | 110 | 0 |
| D | 0 | 110 | 0 |
| Mode M0 | |||
|---|---|---|---|
| Quadrant | BADHDUFLAG | Total packets | Discarded packets |
| A | 0 | 12259 | 3 |
| B | 0 | 10851 | 2 |
| C | 0 | 11084 | 2 |
| D | 0 | 14472 | 2 |
| Quadrant | Total seconds | Saturated seconds | Saturation percentage |
|---|---|---|---|
| A | 5352 | 25 | 0.467115% |
| B | 5352 | 5 | 0.093423% |
| C | 5352 | 7 | 0.130792% |
| D | 5352 | 30 | 0.560538% |
Noise dominated data is calculated using 1-second bins in cleaned event files. If a bin has >2000 counts, and if more than 50% of those come from <1% of pixels, then it is considered to be noise-dominated and hence unusable.
| Quadrant | # 1 sec bins | Bins with >0 counts | Bins with >2000 counts | High rate bins dominated by noise | Noise dominated (total time) | Noise dominated (detector-on time) | Marked lightcurve |
|---|---|---|---|---|---|---|---|
| A | 7263 | 5353 | 7 | 7 | 0.10% | 0.13% | 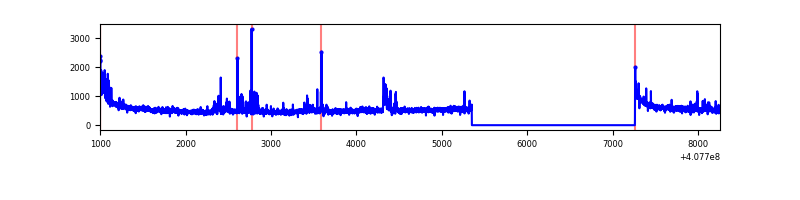 |
| B | 7263 | 5353 | 0 | 0 | 0.00% | 0.00% | 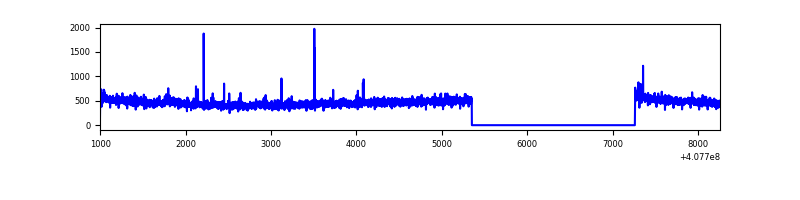 |
| C | 7263 | 5353 | 6 | 6 | 0.08% | 0.11% | 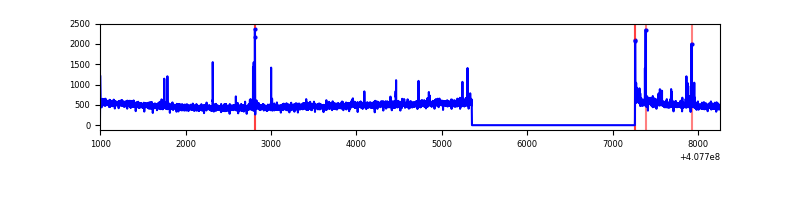 |
| D | 7263 | 5353 | 23 | 23 | 0.32% | 0.43% | 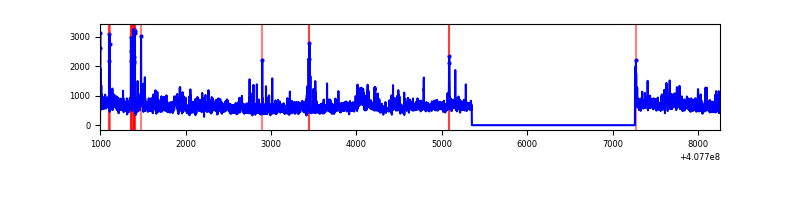 |
Top three noisy pixels from each quadrant. If the there are fewer than three noisy pixels in the level2.evt file, extra rows are filled as -1
| Pixel properties | Quadrant properties | ||||||
|---|---|---|---|---|---|---|---|
| Quadrant | DetID | PixID | Counts | Sigma | Mean | Median | Sigma |
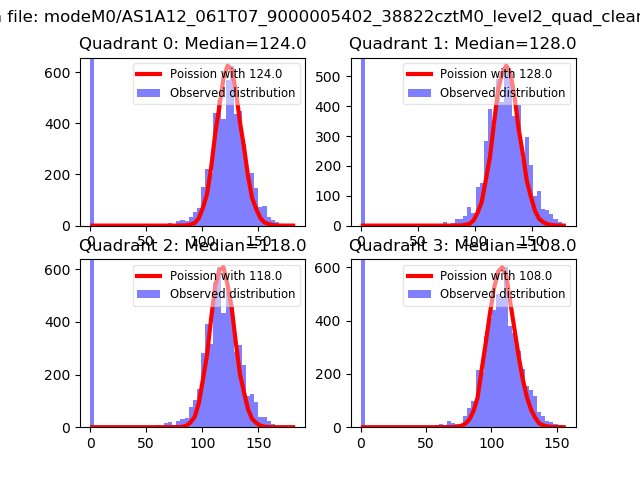
| A | 10 | 83 | 386592 | 3114.42 | 612 | 601 | 123.9 |
| A | 13 | 248 | 197982 | 1592.59 | 612 | 601 | 123.9 |
| A | 9 | 143 | 47753 | 380.45 | 612 | 601 | 123.9 |
| B | 0 | 230 | 35252 | 291.08 | 616 | 599 | 119.0 |
| B | 12 | 111 | 14688 | 118.35 | 616 | 599 | 119.0 |
| B | 11 | 111 | 13537 | 108.68 | 616 | 599 | 119.0 |
| C | 15 | 214 | 238404 | 1731.75 | 595 | 602 | 137.3 |
| C | 1 | 23 | 31615 | 225.85 | 595 | 602 | 137.3 |
| C | 15 | 208 | 24101 | 171.13 | 595 | 602 | 137.3 |
| D | 2 | 16 | 573210 | 4034.08 | 587 | 573 | 141.9 |
| D | 12 | 235 | 381363 | 2682.57 | 587 | 573 | 141.9 |
| D | 12 | 227 | 202543 | 1422.83 | 587 | 573 | 141.9 |
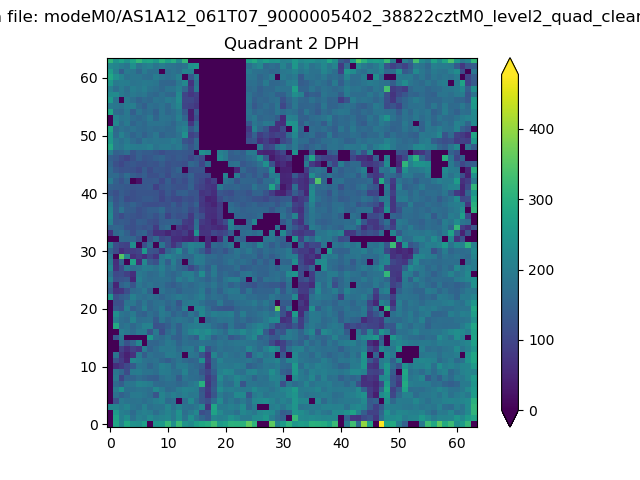
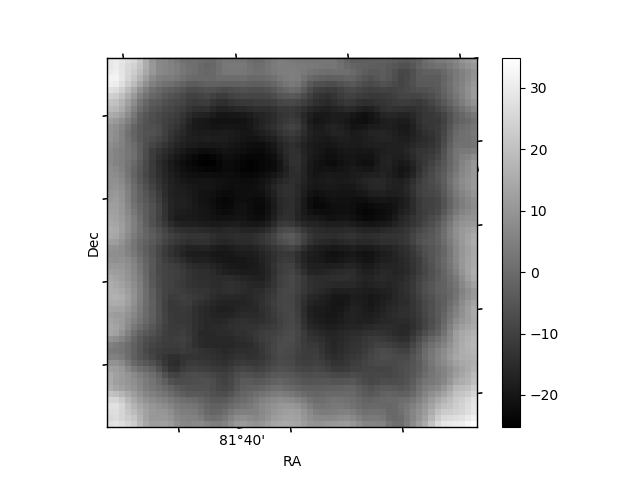
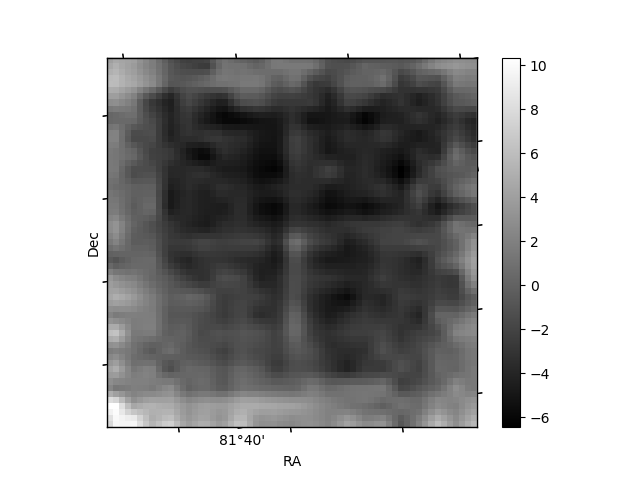
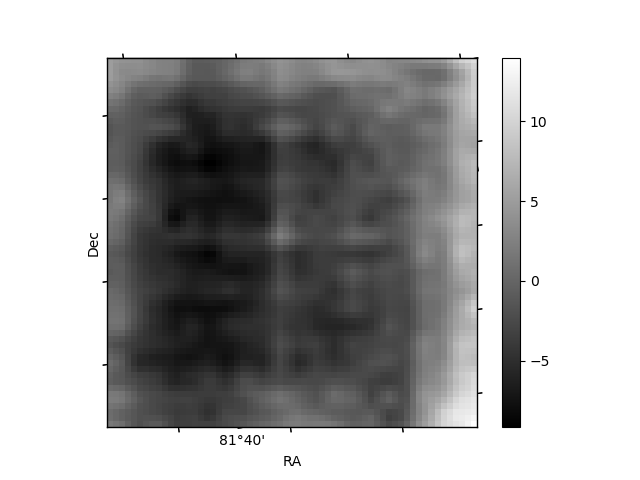
Histogram calculated using DETX and DETY for each event in the final _common_clean file
| Quadrant A | 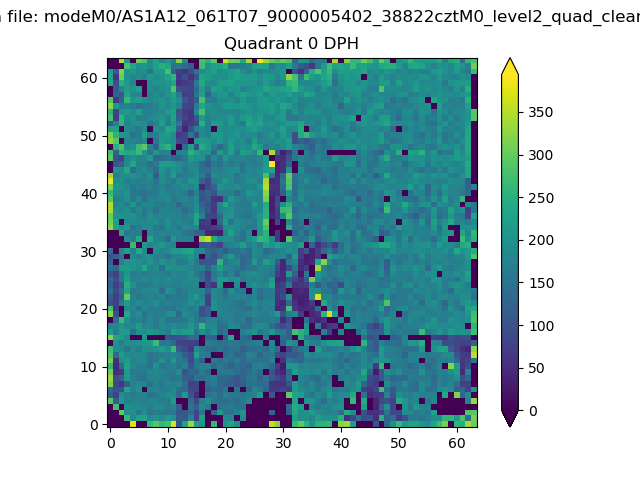 |
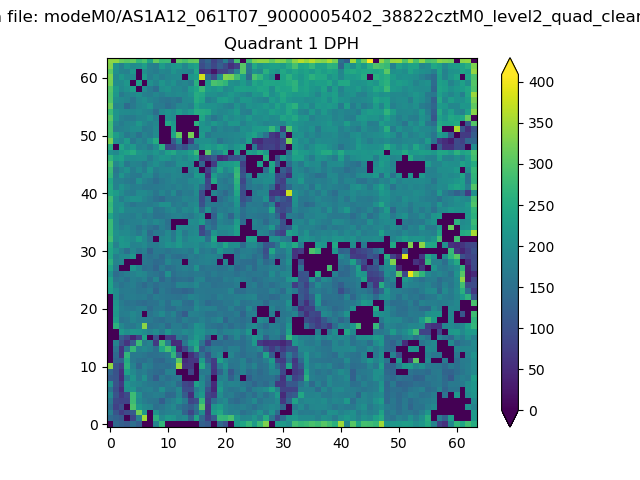 |
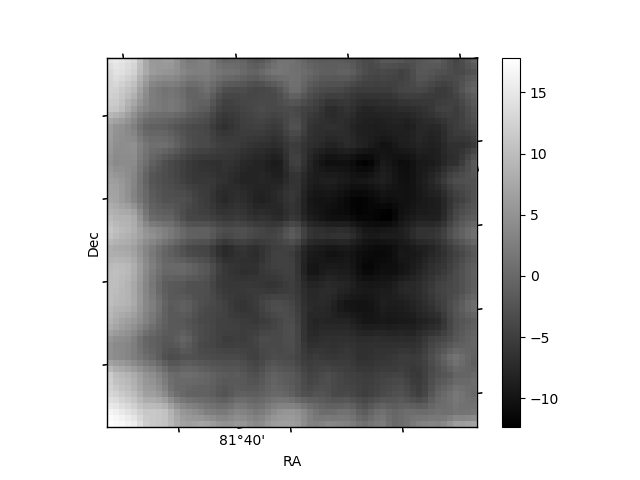
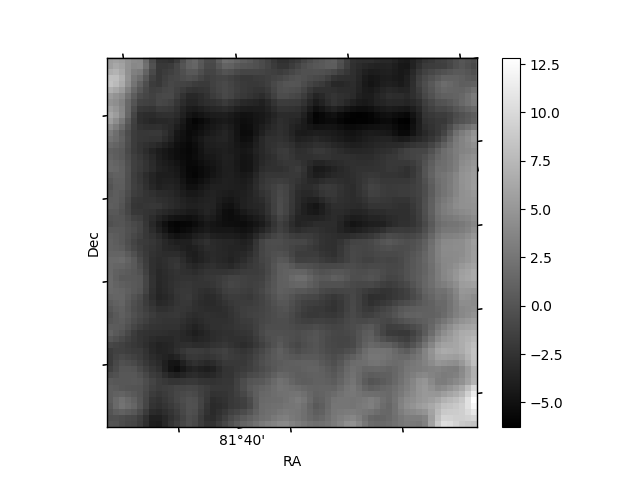
Quadrant B |
|---|---|---|---|
| Quadrant D | 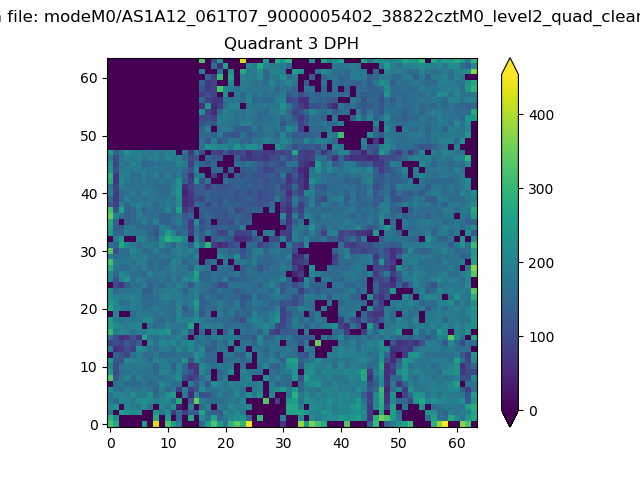 |
 |
Quadrant C |
| Plot type | Count rate plots | Images |
|---|---|---|
| Comparison with Poisson distribution Blue bars denote a histogram of data divided into 1 sec bins. Red curve is a Poisson curve with rate = median count rate of data. |
 |
 |
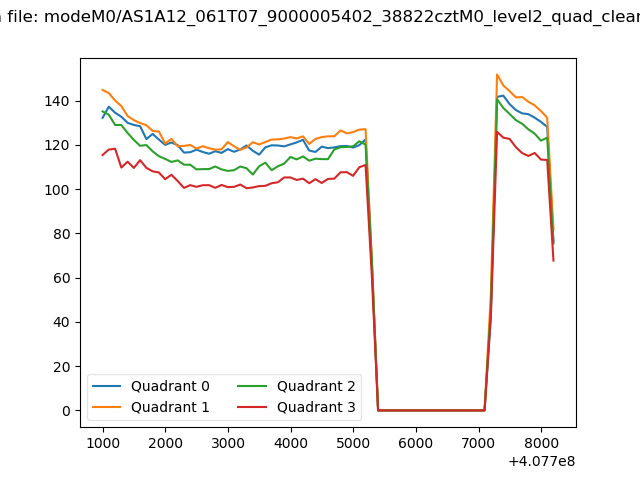
| Quadrant-wise count rates Data is divided into 100 sec bins |
 |
|
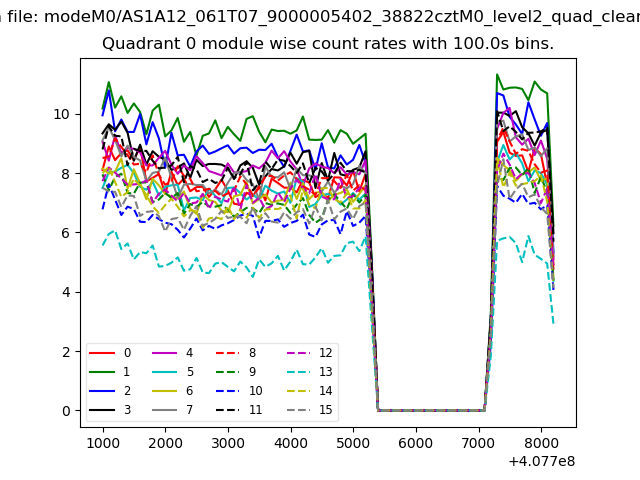
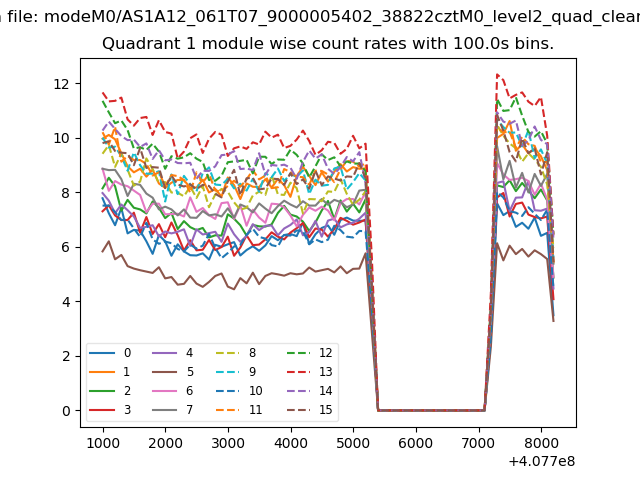
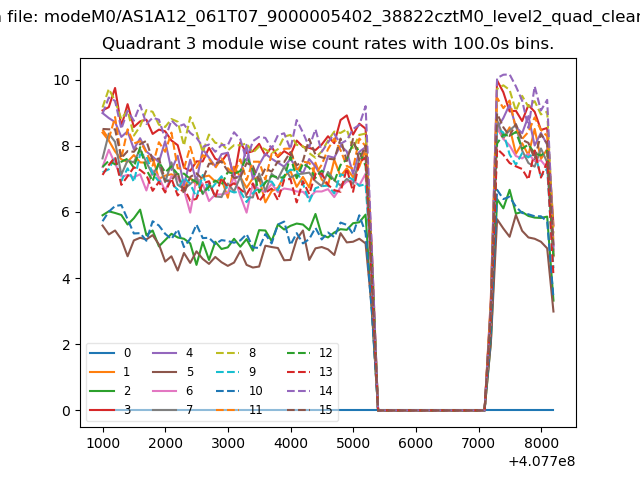
| Module-wise count rates for Quadrant A Data is divided into 100 sec bins |
 |
 |
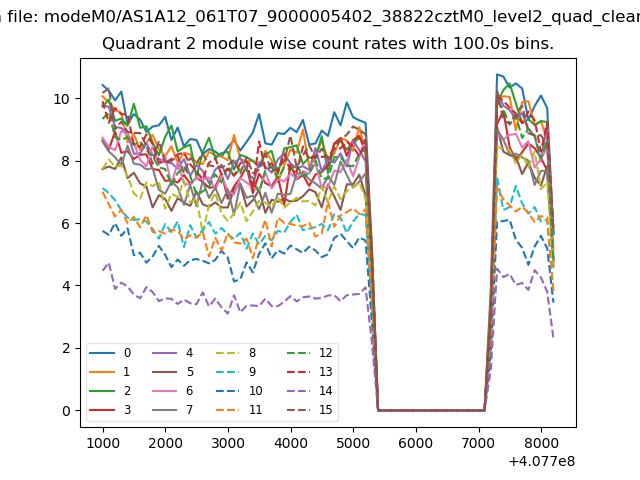
| Module-wise count rates for Quadrant B Data is divided into 100 sec bins |
 |
 |
| Module-wise count rates for Quadrant C Data is divided into 100 sec bins |
 |
 |
| Module-wise count rates for Quadrant D Data is divided into 100 sec bins |
 |
 |
| Parameter | Plot |
|---|---|
| CZT HV Monitor |  |
| D_VDD | 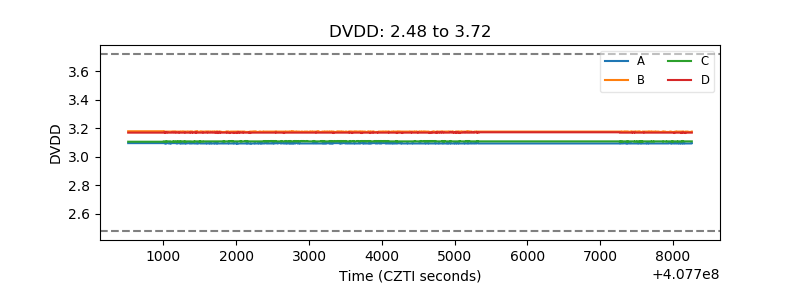 |
| Temperature 1 | 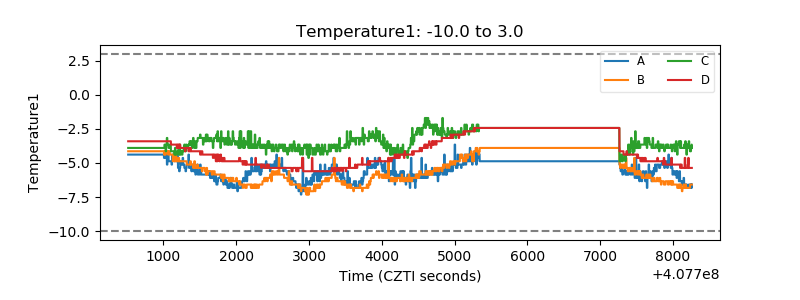 |
| Veto HV Monitor | 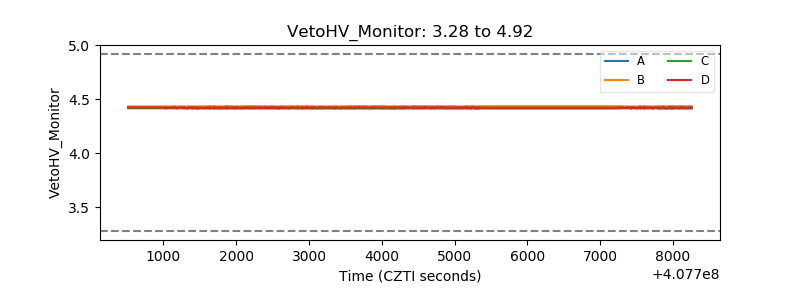 |
| Veto LLD | 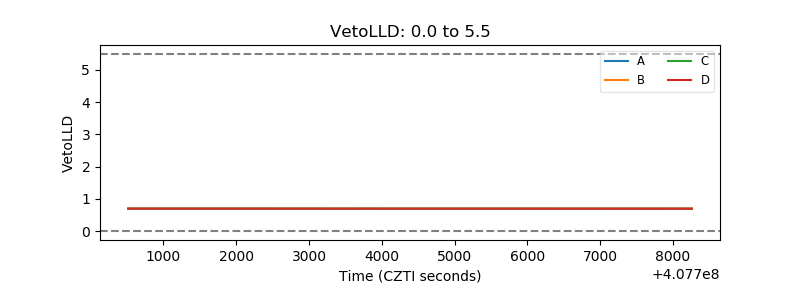 |
| Alpha Counter | 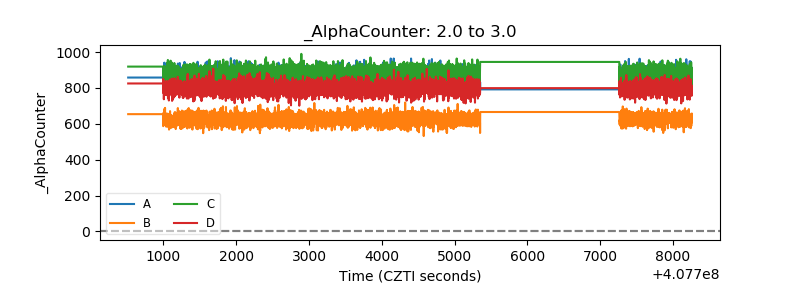 |
| _CPM_Rate | 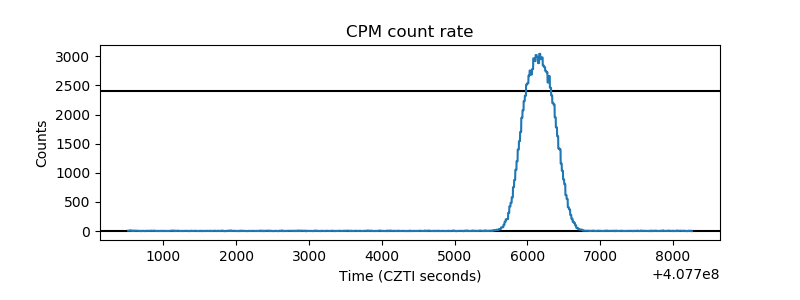 |
| CZT Counter | 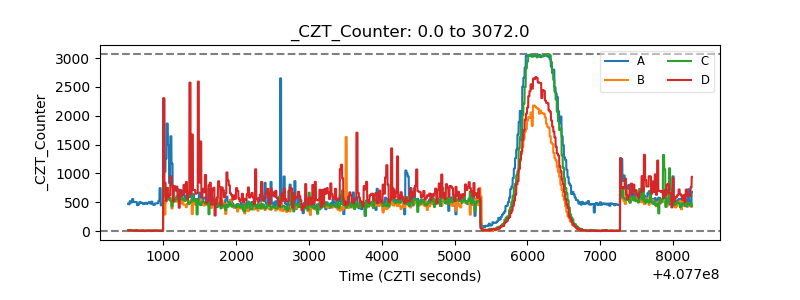 |
| +2.5 Volts monitor | 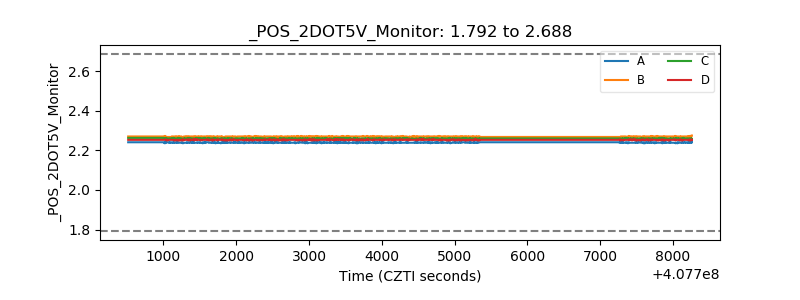 |
| +5 Volts monitor | 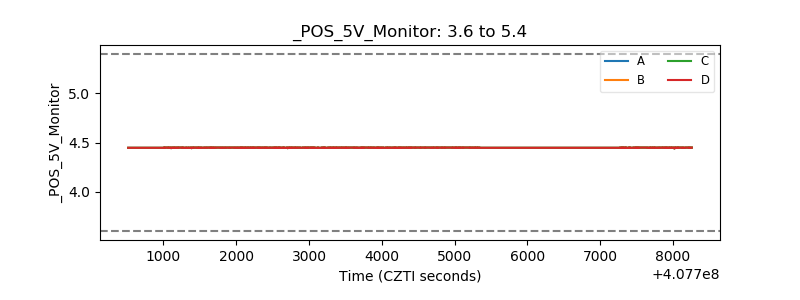 |
| _ROLL_ROT | 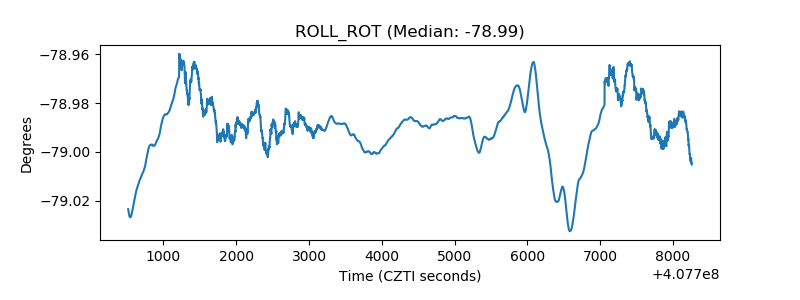 |
| _Roll_DEC | 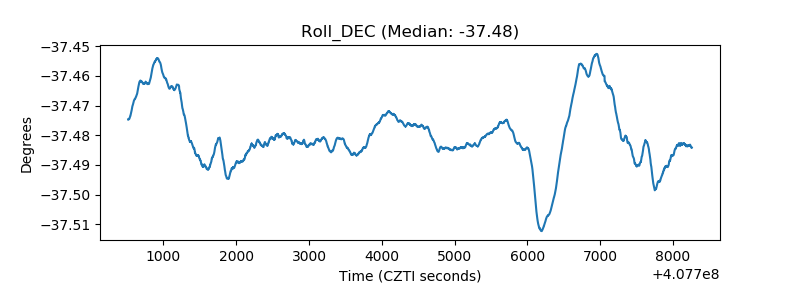 |
| _Roll_RA | 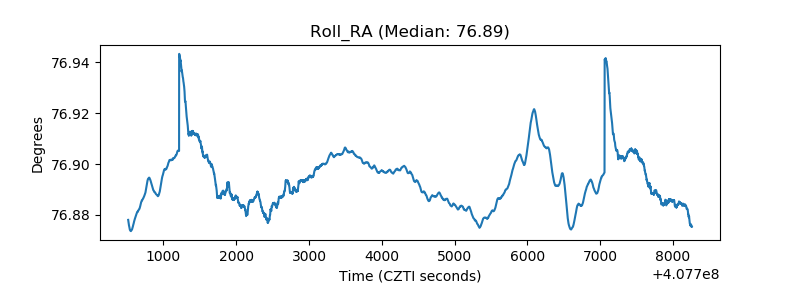 |
| Veto Counter | 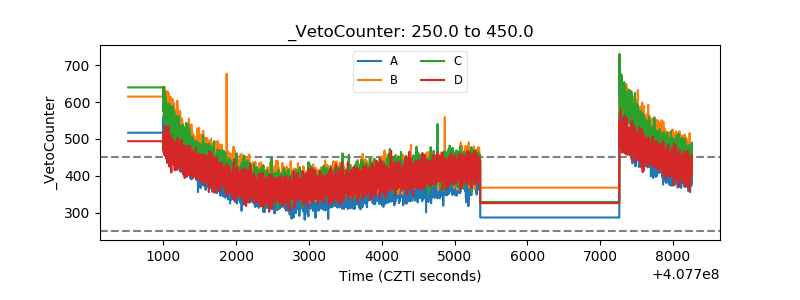 |