| Param | Original file | Final file |
|---|---|---|
| Filename | modeM0/AS1A12_061T07_9000005402_38823cztM0_level2.fits | modeM0/AS1A12_061T07_9000005402_38823cztM0_level2_quad_clean.evt |
| Size (bytes) | 92,090,880 | 27,947,520 |
| Size | 87.8 MB | 26.7 MB |
| Events in quadrant A | 838,786 | 190,443 |
| Events in quadrant B | 695,928 | 199,203 |
| Events in quadrant C | 739,405 | 182,731 |
| Events in quadrant D | 1,019,019 | 166,667 |
| Mode M9 | |||
|---|---|---|---|
| Quadrant | BADHDUFLAG | Total packets | Discarded packets |
| A | 0 | 9 | 0 |
| B | 0 | 9 | 0 |
| C | 0 | 9 | 0 |
| D | 0 | 10 | 0 |
| Mode SS | |||
|---|---|---|---|
| Quadrant | BADHDUFLAG | Total packets | Discarded packets |
| A | 0 | 28 | 0 |
| B | 0 | 28 | 0 |
| C | 0 | 28 | 0 |
| D | 0 | 28 | 0 |
| Mode M0 | |||
|---|---|---|---|
| Quadrant | BADHDUFLAG | Total packets | Discarded packets |
| A | 0 | 3429 | 1 |
| B | 0 | 2975 | 1 |
| C | 0 | 3098 | 1 |
| D | 0 | 4087 | 1 |
| Quadrant | Total seconds | Saturated seconds | Saturation percentage |
|---|---|---|---|
| A | 1450 | 4 | 0.275862% |
| B | 1450 | 2 | 0.137931% |
| C | 1450 | 4 | 0.275862% |
| D | 1450 | 2 | 0.137931% |
Noise dominated data is calculated using 1-second bins in cleaned event files. If a bin has >2000 counts, and if more than 50% of those come from <1% of pixels, then it is considered to be noise-dominated and hence unusable.
| Quadrant | # 1 sec bins | Bins with >0 counts | Bins with >2000 counts | High rate bins dominated by noise | Noise dominated (total time) | Noise dominated (detector-on time) | Marked lightcurve |
|---|---|---|---|---|---|---|---|
| A | 1450 | 1450 | 2 | 2 | 0.14% | 0.14% | 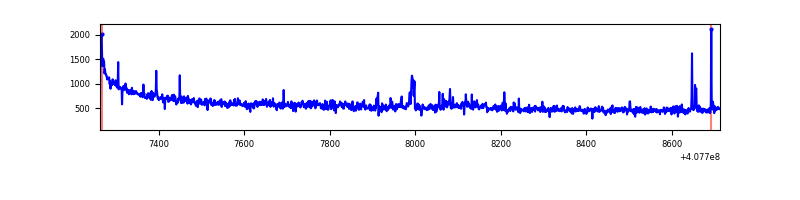 |
| B | 1450 | 1450 | 0 | 0 | 0.00% | 0.00% | 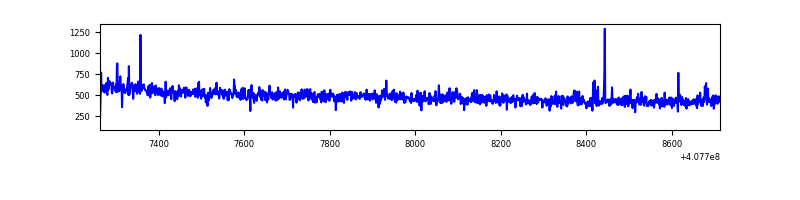 |
| C | 1450 | 1450 | 5 | 5 | 0.34% | 0.34% | 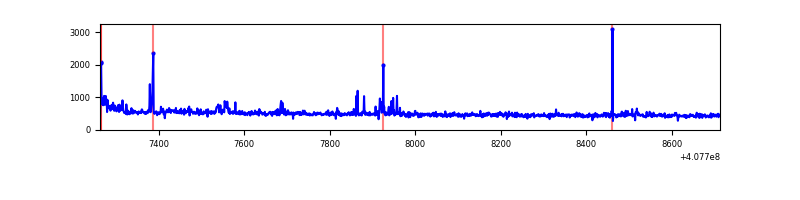 |
| D | 1450 | 1450 | 1 | 1 | 0.07% | 0.07% | 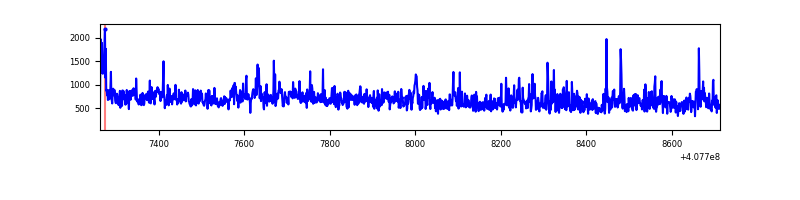 |
Top three noisy pixels from each quadrant. If the there are fewer than three noisy pixels in the level2.evt file, extra rows are filled as -1
| Pixel properties | Quadrant properties | ||||||
|---|---|---|---|---|---|---|---|
| Quadrant | DetID | PixID | Counts | Sigma | Mean | Median | Sigma |
| A | 10 | 83 | 142801 | 4061.05 | 166 | 164 | 35.1 |
| A | 13 | 248 | 25263 | 714.6 | 166 | 164 | 35.1 |
| A | 9 | 143 | 18644 | 526.15 | 166 | 164 | 35.1 |
| B | 0 | 230 | 14396 | 409.21 | 169 | 165 | 34.8 |
| B | 4 | 81 | 6928 | 194.47 | 169 | 165 | 34.8 |
| B | 12 | 111 | 3888 | 107.05 | 169 | 165 | 34.8 |
| C | 15 | 214 | 66409 | 1716.98 | 160 | 161 | 38.6 |
| C | 1 | 23 | 31951 | 823.91 | 160 | 161 | 38.6 |
| C | 15 | 208 | 10085 | 257.2 | 160 | 161 | 38.6 |
| D | 2 | 16 | 201664 | 5136.73 | 156 | 151 | 39.2 |
| D | 12 | 235 | 130716 | 3328.21 | 156 | 151 | 39.2 |
| D | 12 | 227 | 34287 | 870.15 | 156 | 151 | 39.2 |
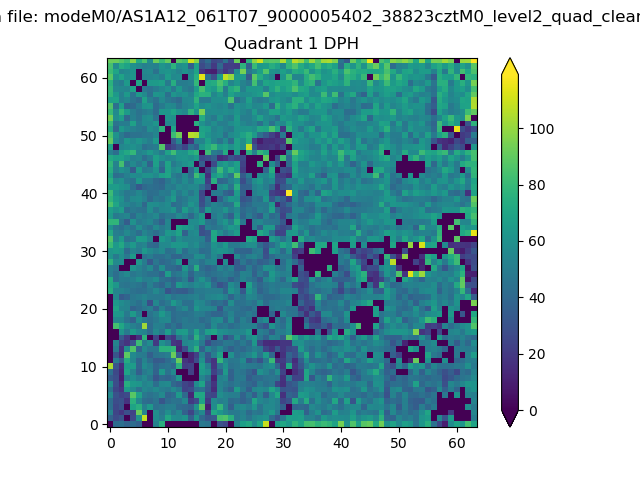
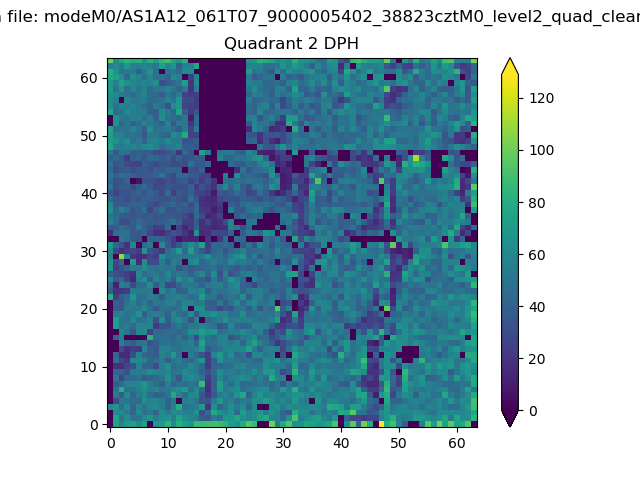
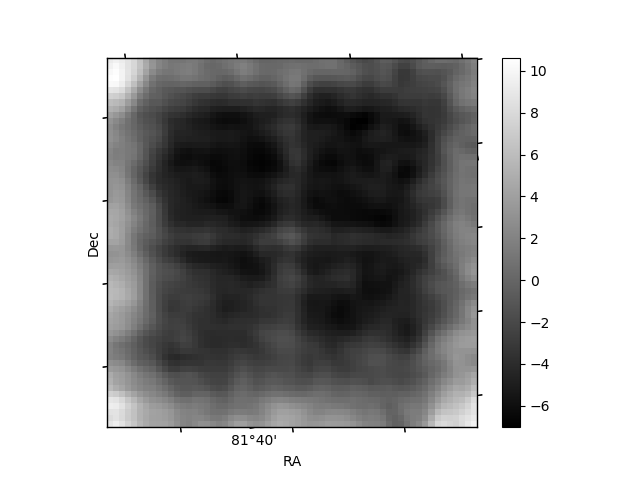
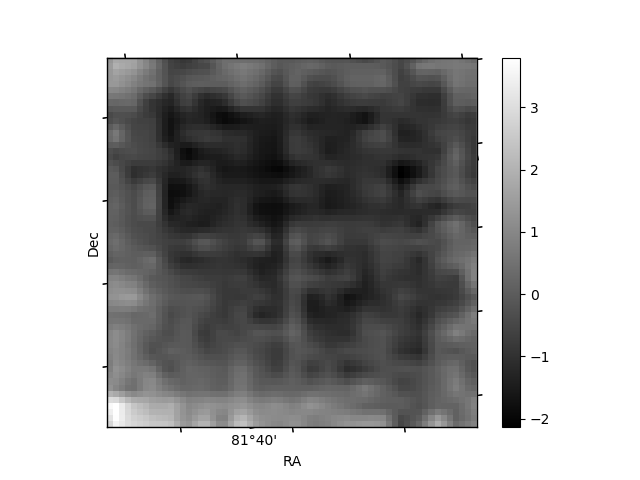
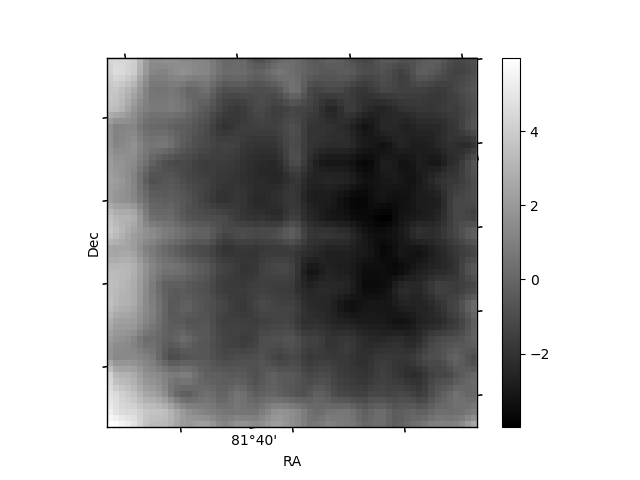
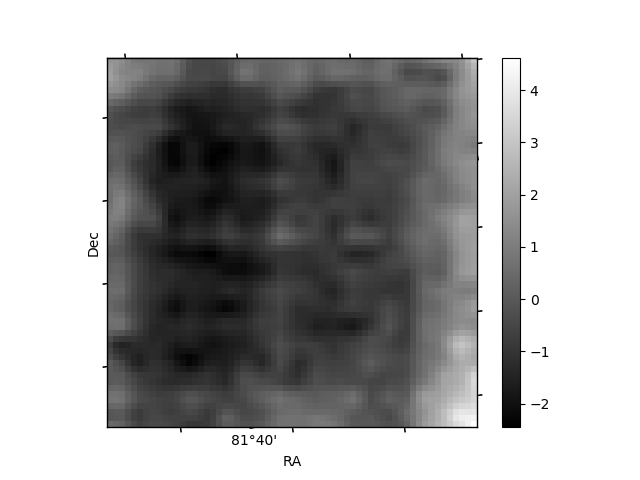
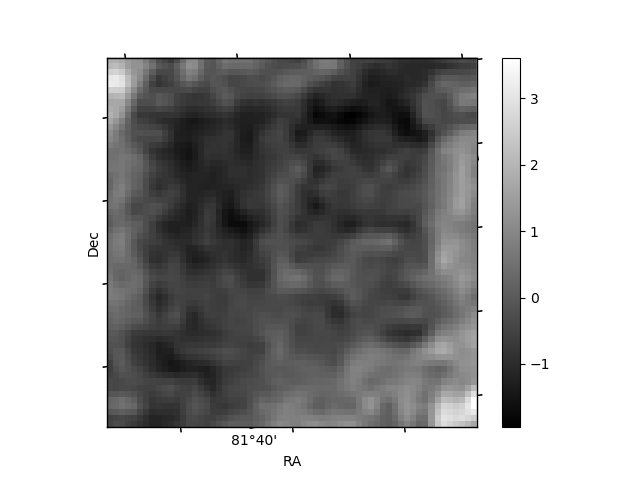
Histogram calculated using DETX and DETY for each event in the final _common_clean file
| Quadrant A |  |
 |
Quadrant B |
|---|---|---|---|
| Quadrant D | 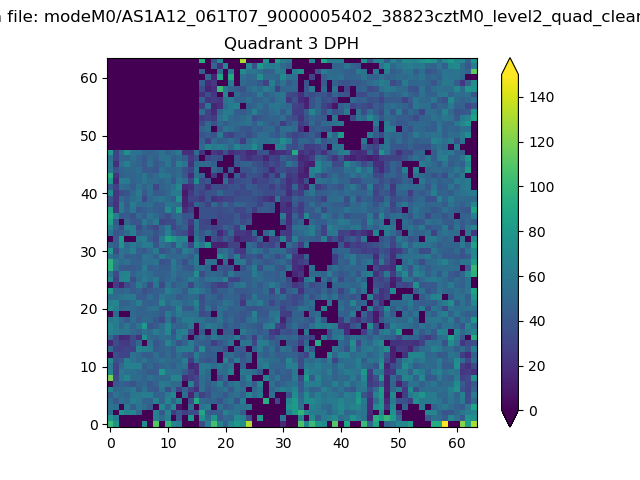 |
 |
Quadrant C |
| Plot type | Count rate plots | Images |
|---|---|---|
| Comparison with Poisson distribution Blue bars denote a histogram of data divided into 1 sec bins. Red curve is a Poisson curve with rate = median count rate of data. |
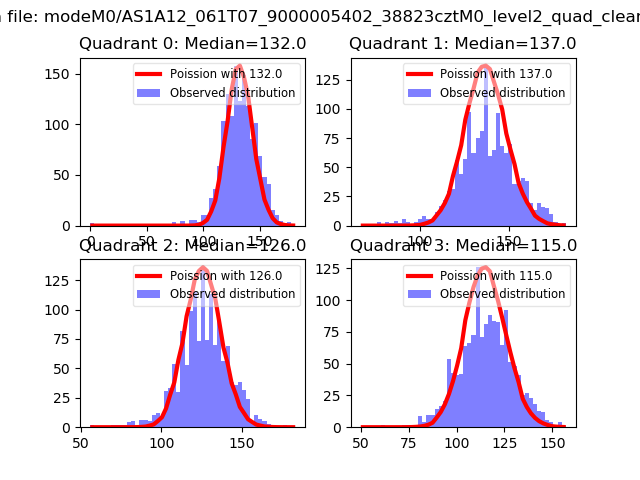 |
 |
| Quadrant-wise count rates Data is divided into 100 sec bins |
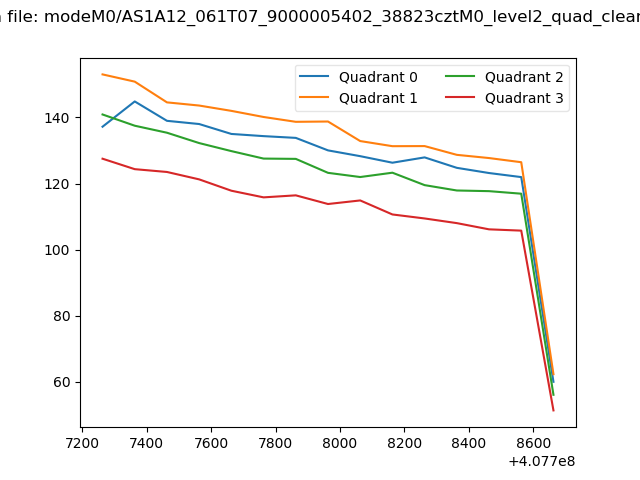 |
|
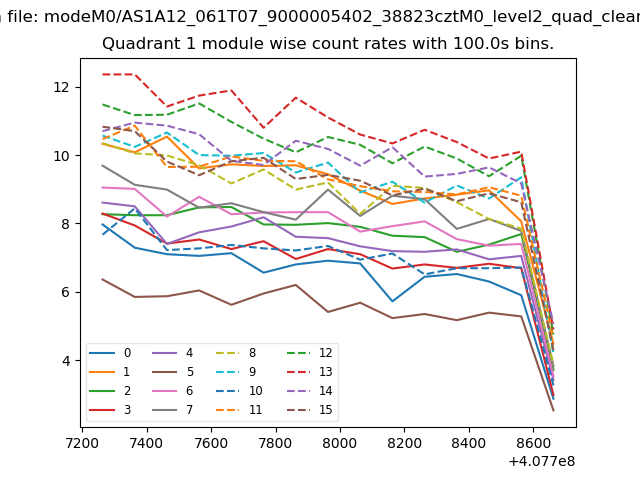
| Module-wise count rates for Quadrant A Data is divided into 100 sec bins |
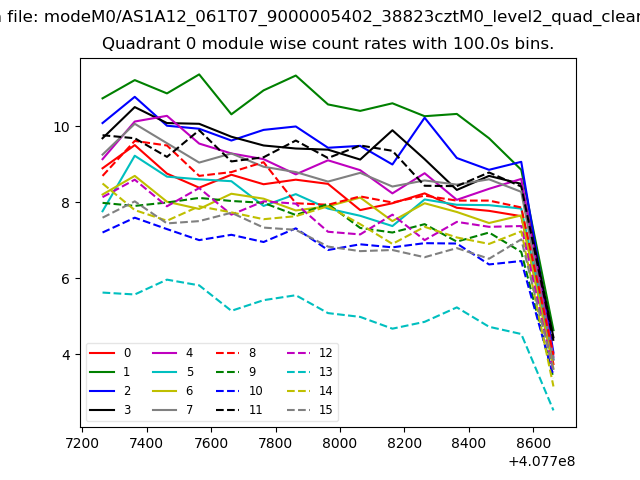 |
 |
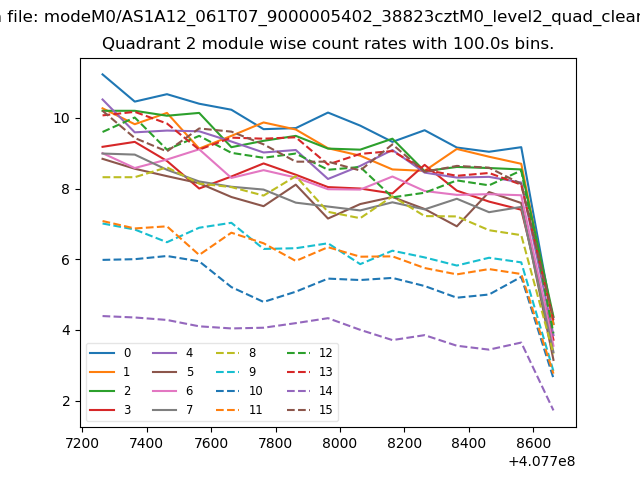
| Module-wise count rates for Quadrant B Data is divided into 100 sec bins |
 |
 |
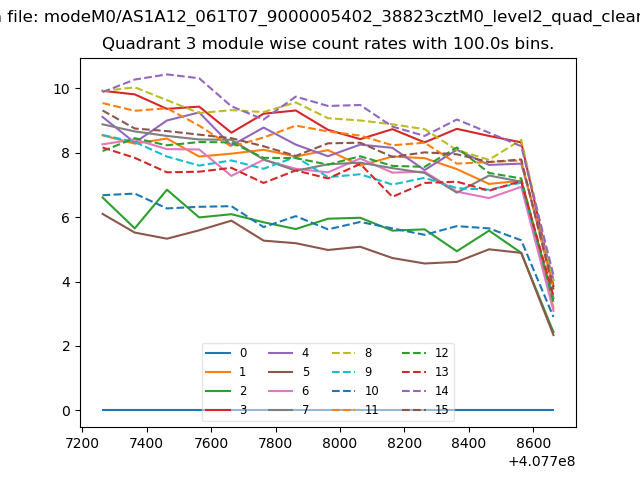
| Module-wise count rates for Quadrant C Data is divided into 100 sec bins |
 |
 |
| Module-wise count rates for Quadrant D Data is divided into 100 sec bins |
 |
 |
| Parameter | Plot |
|---|---|
| CZT HV Monitor | 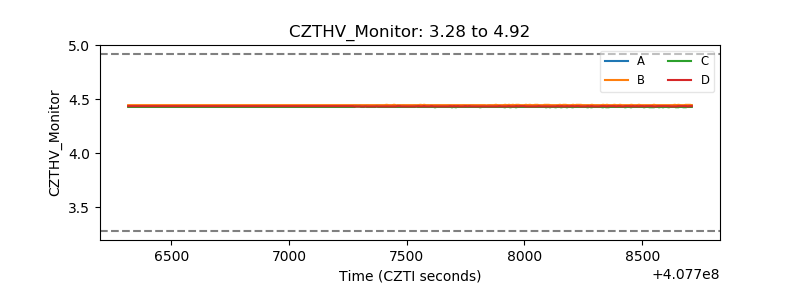 |
| D_VDD | 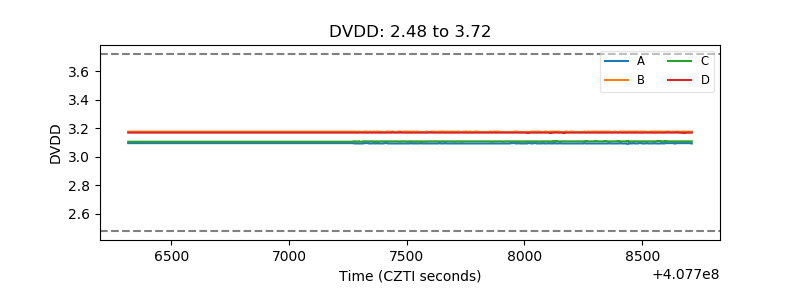 |
| Temperature 1 | 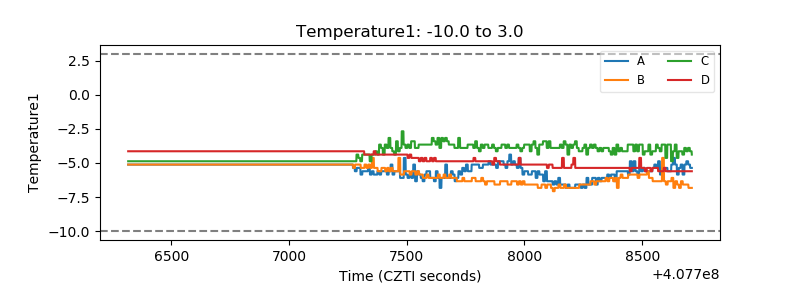 |
| Veto HV Monitor | 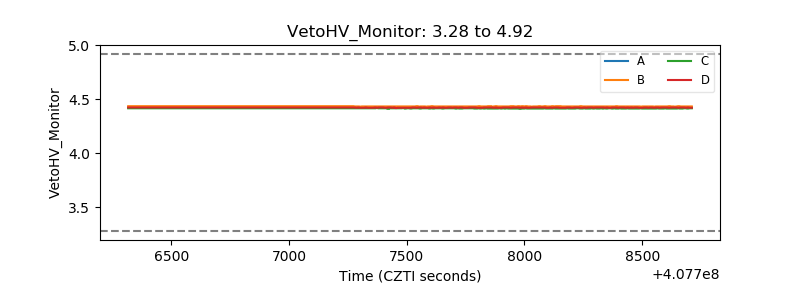 |
| Veto LLD | 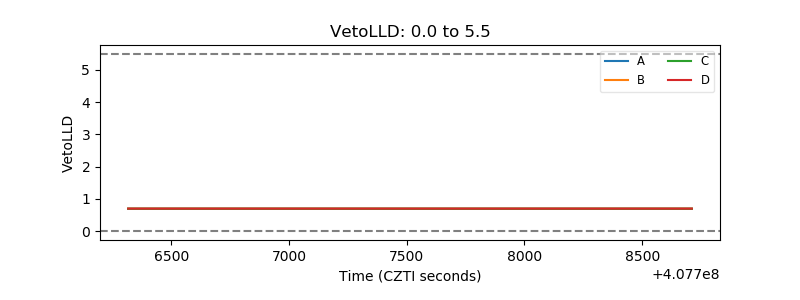 |
| Alpha Counter |  |
| _CPM_Rate | 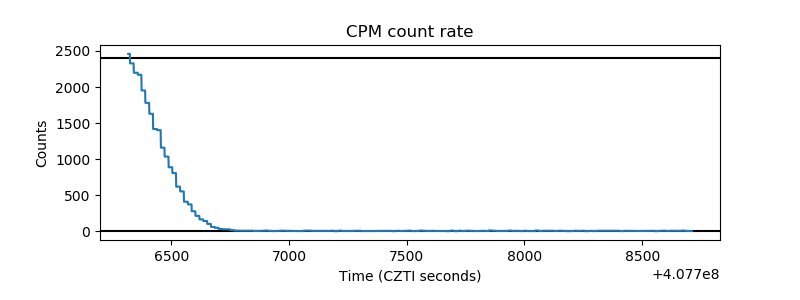 |
| CZT Counter | 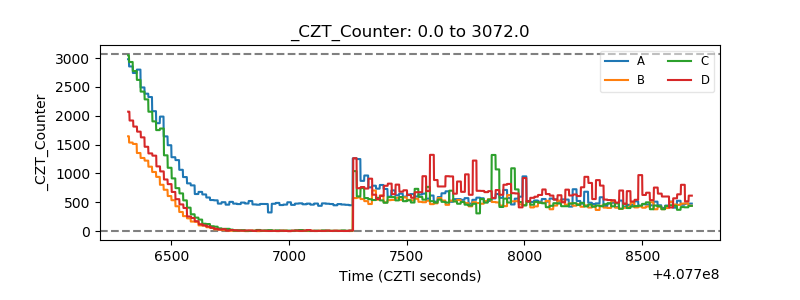 |
| +2.5 Volts monitor | 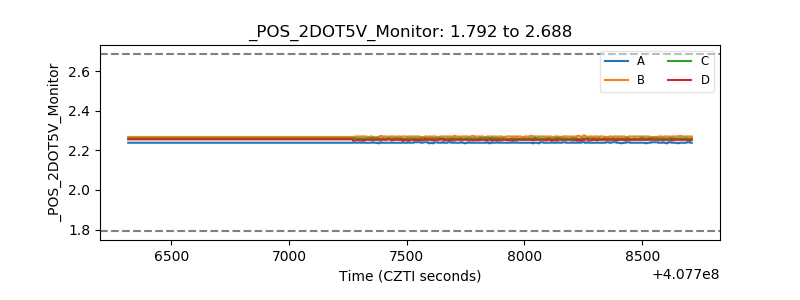 |
| +5 Volts monitor | 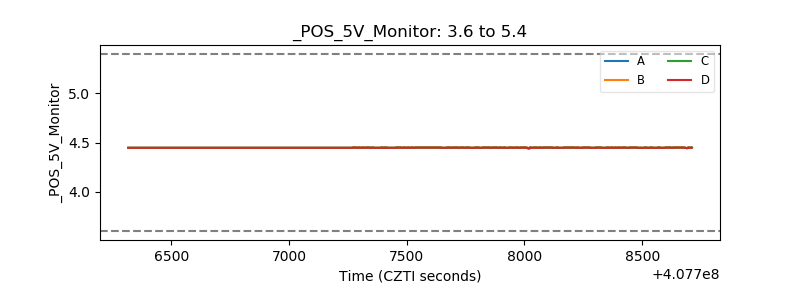 |
| _ROLL_ROT | 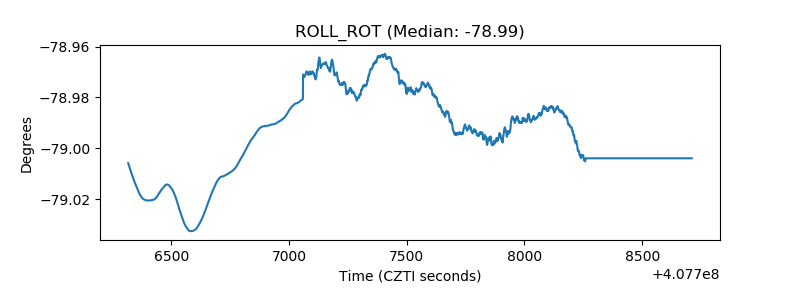 |
| _Roll_DEC | 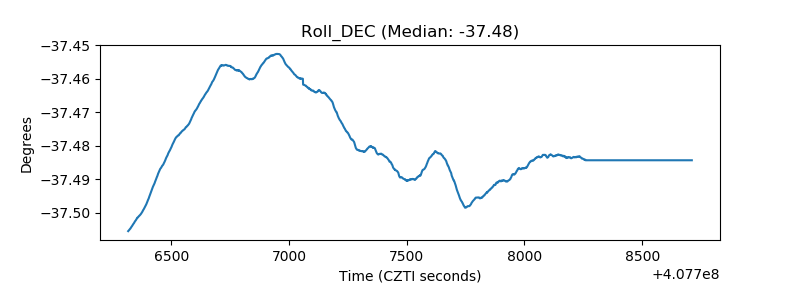 |
| _Roll_RA | 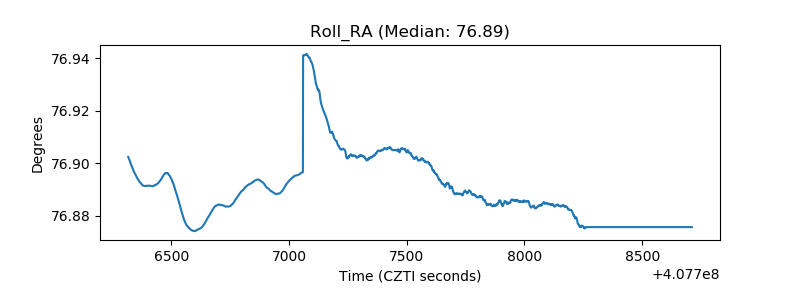 |
| Veto Counter | 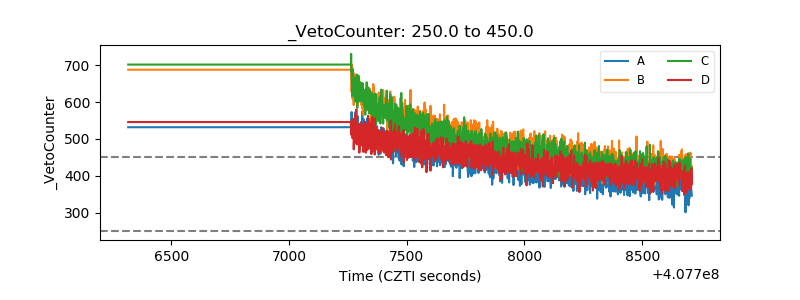 |