| Param | Original file | Final file |
|---|---|---|
| Filename | modeM0/AS1A12_083T02_9000005404_38823cztM0_level2.fits | modeM0/AS1A12_083T02_9000005404_38823cztM0_level2_quad_clean.evt |
| Size (bytes) | 159,932,160 | 40,556,160 |
| Size | 152.5 MB | 38.7 MB |
| Events in quadrant A | 1,386,751 | 276,199 |
| Events in quadrant B | 1,102,141 | 290,773 |
| Events in quadrant C | 1,131,498 | 273,344 |
| Events in quadrant D | 2,126,616 | 229,692 |
| Mode M0 | |||
|---|---|---|---|
| Quadrant | BADHDUFLAG | Total packets | Discarded packets |
| A | 0 | 5445 | 2 |
| B | 0 | 4611 | 1 |
| C | 0 | 4625 | 1 |
| D | 0 | 7861 | 1 |
| Mode SS | |||
|---|---|---|---|
| Quadrant | BADHDUFLAG | Total packets | Discarded packets |
| A | 0 | 44 | 0 |
| B | 0 | 44 | 0 |
| C | 0 | 44 | 0 |
| D | 0 | 44 | 0 |
| Mode M9 | |||
|---|---|---|---|
| Quadrant | BADHDUFLAG | Total packets | Discarded packets |
| A | 0 | 21 | 0 |
| B | 0 | 21 | 0 |
| C | 0 | 21 | 0 |
| D | 0 | 21 | 0 |
| Quadrant | Total seconds | Saturated seconds | Saturation percentage |
|---|---|---|---|
| A | 2197 | 12 | 0.546199% |
| B | 2197 | 8 | 0.364133% |
| C | 2197 | 4 | 0.182066% |
| D | 2197 | 196 | 8.921256% |
Noise dominated data is calculated using 1-second bins in cleaned event files. If a bin has >2000 counts, and if more than 50% of those come from <1% of pixels, then it is considered to be noise-dominated and hence unusable.
| Quadrant | # 1 sec bins | Bins with >0 counts | Bins with >2000 counts | High rate bins dominated by noise | Noise dominated (total time) | Noise dominated (detector-on time) | Marked lightcurve |
|---|---|---|---|---|---|---|---|
| A | 4230 | 2198 | 2 | 2 | 0.05% | 0.09% | 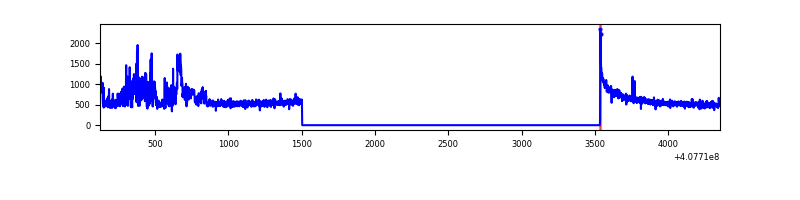 |
| B | 4230 | 2198 | 1 | 1 | 0.02% | 0.05% | 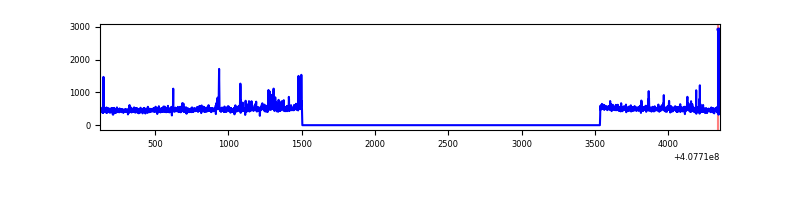 |
| C | 4230 | 2198 | 2 | 2 | 0.05% | 0.09% | 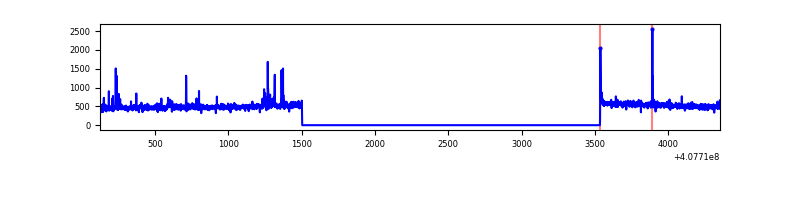 |
| D | 4230 | 2198 | 202 | 202 | 4.78% | 9.19% | 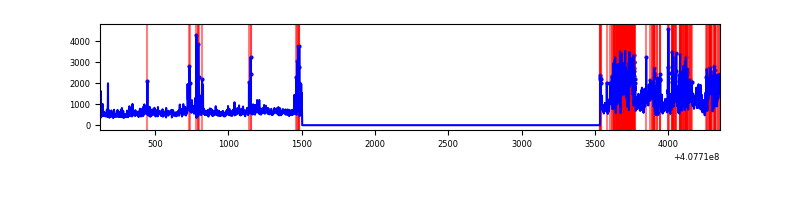 |
Top three noisy pixels from each quadrant. If the there are fewer than three noisy pixels in the level2.evt file, extra rows are filled as -1
| Pixel properties | Quadrant properties | ||||||
|---|---|---|---|---|---|---|---|
| Quadrant | DetID | PixID | Counts | Sigma | Mean | Median | Sigma |
| A | 13 | 248 | 180883 | 3324.33 | 262 | 257 | 54.3 |
| A | 10 | 83 | 180085 | 3309.64 | 262 | 257 | 54.3 |
| A | 9 | 143 | 5286 | 92.56 | 262 | 257 | 54.3 |
| B | 5 | 200 | 27306 | 531.7 | 262 | 256 | 50.9 |
| B | 5 | 172 | 11830 | 227.5 | 262 | 256 | 50.9 |
| B | 0 | 221 | 11023 | 211.64 | 262 | 256 | 50.9 |
| C | 15 | 214 | 97422 | 1626.18 | 254 | 256 | 59.8 |
| C | 1 | 23 | 34053 | 565.63 | 254 | 256 | 59.8 |
| C | 0 | 10 | 5873 | 94.01 | 254 | 256 | 59.8 |
| D | 12 | 227 | 652675 | 10812.6 | 246 | 238 | 60.3 |
| D | 2 | 16 | 202703 | 3355.38 | 246 | 238 | 60.3 |
| D | 12 | 235 | 113294 | 1873.64 | 246 | 238 | 60.3 |
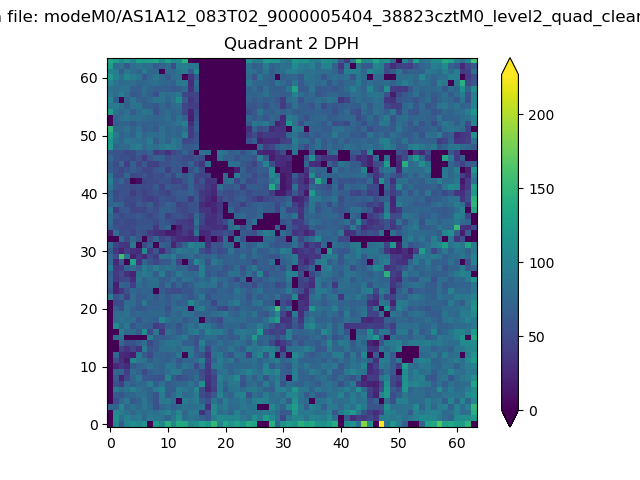
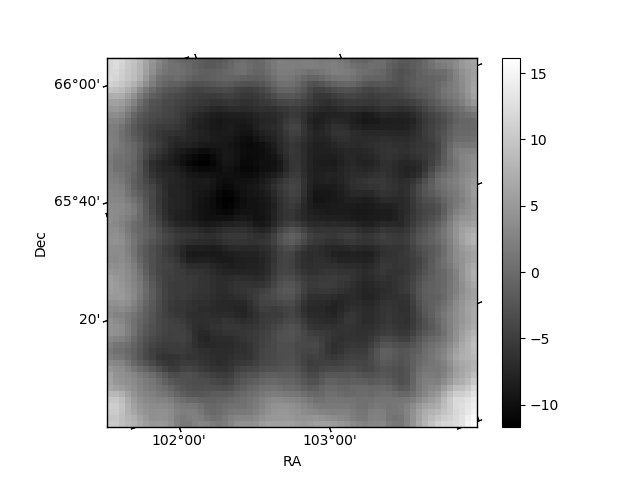
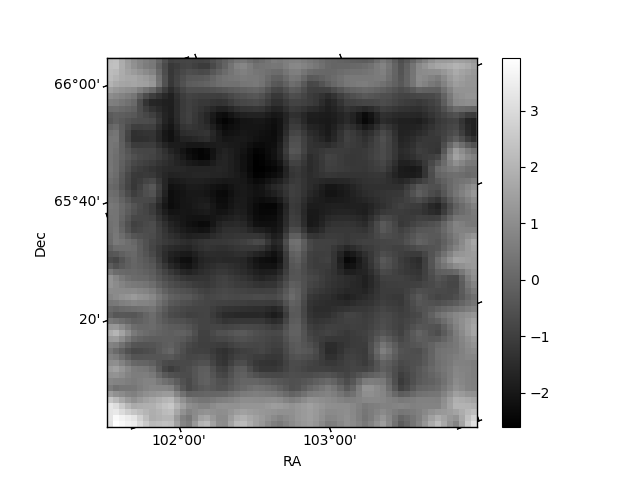
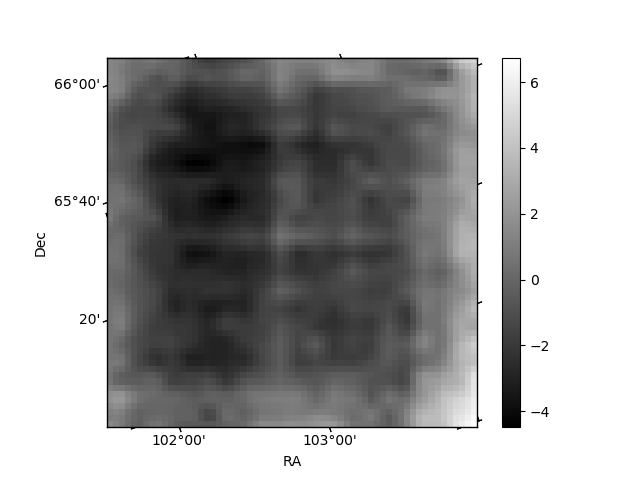
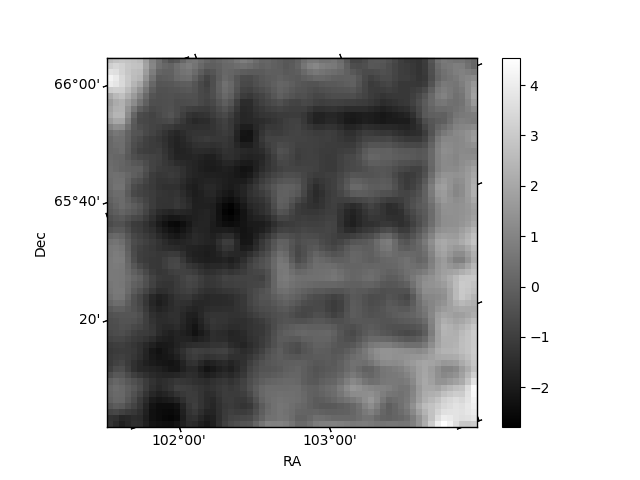
Histogram calculated using DETX and DETY for each event in the final _common_clean file
| Quadrant A | 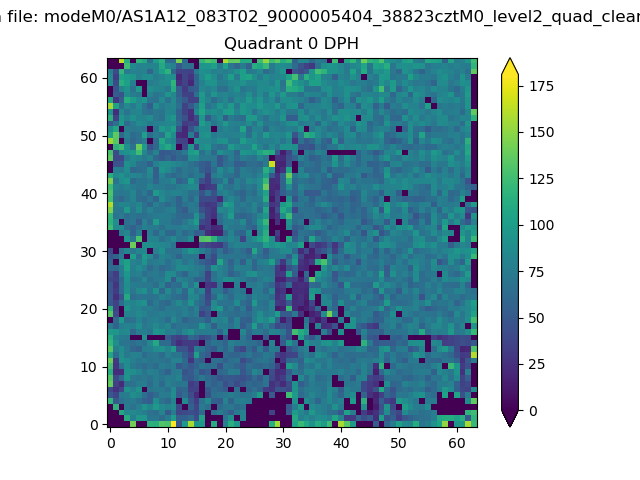 |
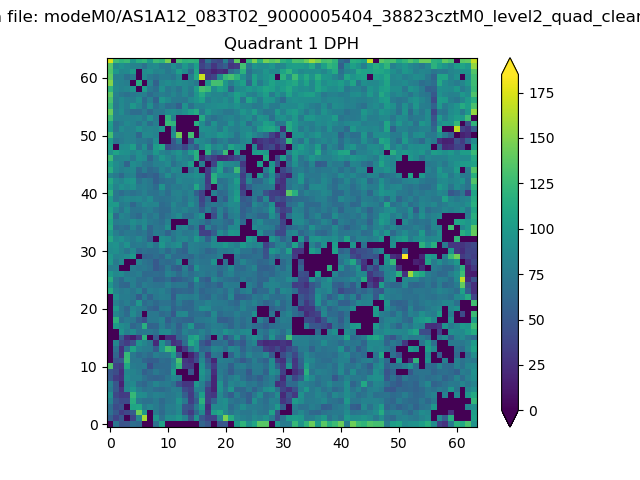 |
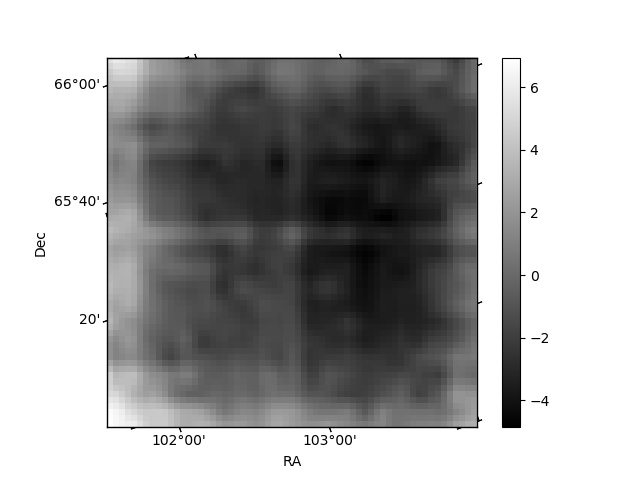
Quadrant B |
|---|---|---|---|
| Quadrant D | 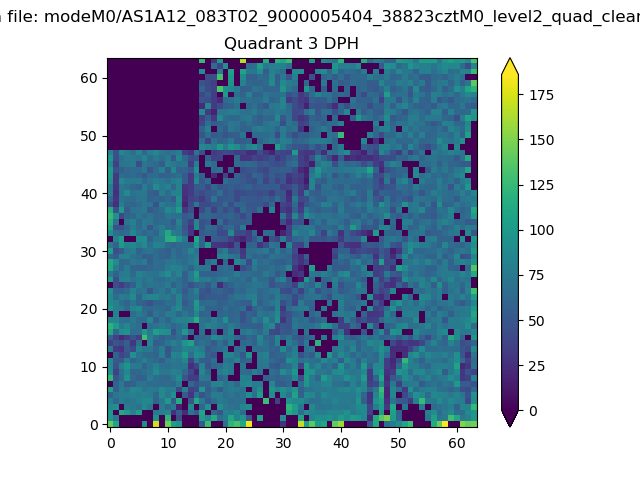 |
 |
Quadrant C |
| Plot type | Count rate plots | Images |
|---|---|---|
| Comparison with Poisson distribution Blue bars denote a histogram of data divided into 1 sec bins. Red curve is a Poisson curve with rate = median count rate of data. |
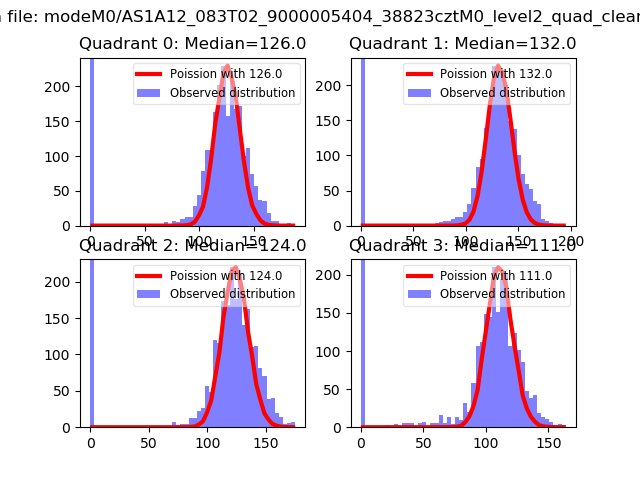 |
 |
| Quadrant-wise count rates Data is divided into 100 sec bins |
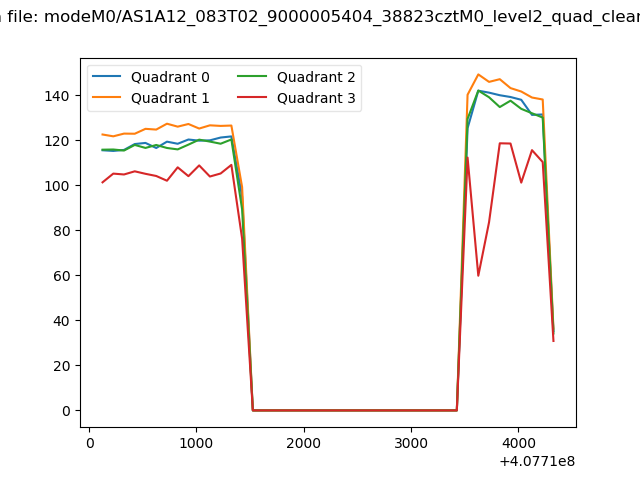 |
|
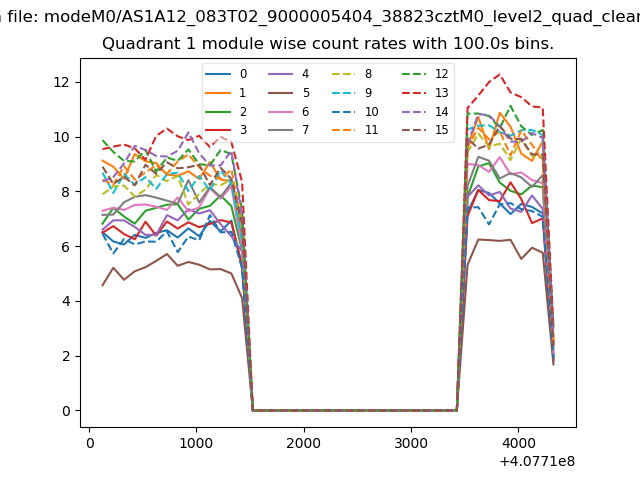
| Module-wise count rates for Quadrant A Data is divided into 100 sec bins |
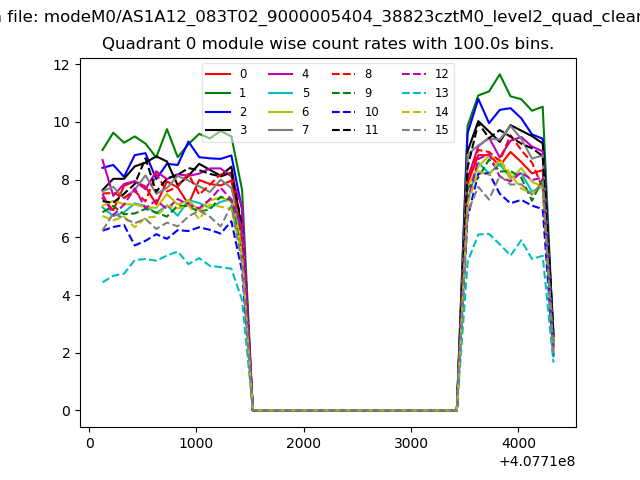 |
 |
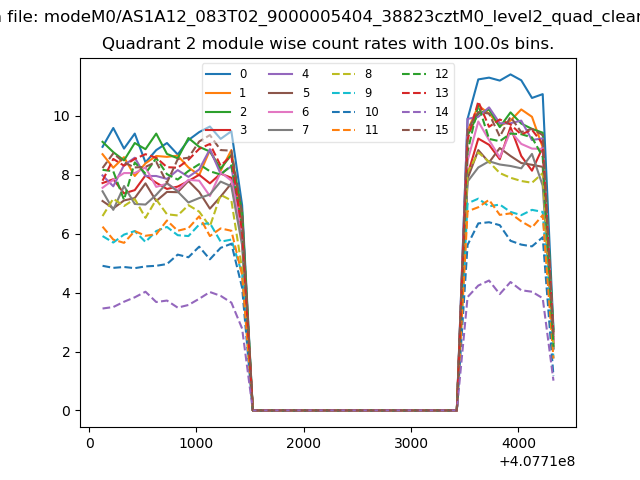
| Module-wise count rates for Quadrant B Data is divided into 100 sec bins |
 |
 |
| Module-wise count rates for Quadrant C Data is divided into 100 sec bins |
 |
 |
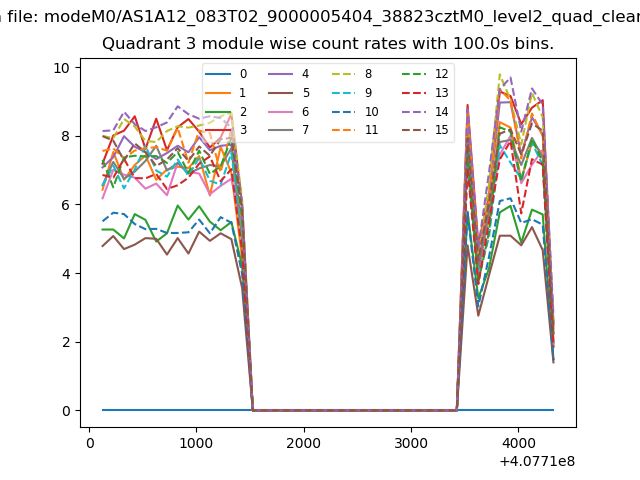
| Module-wise count rates for Quadrant D Data is divided into 100 sec bins |
 |
 |
| Parameter | Plot |
|---|---|
| CZT HV Monitor |  |
| D_VDD | 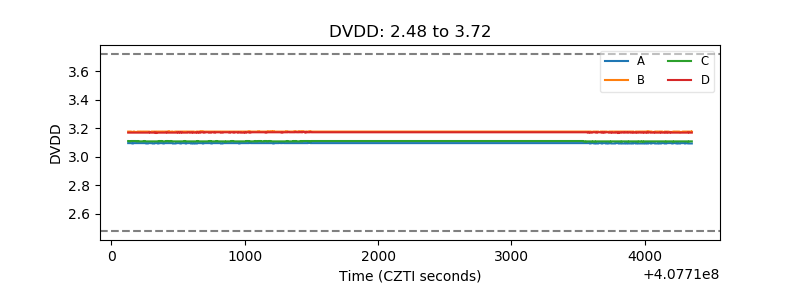 |
| Temperature 1 | 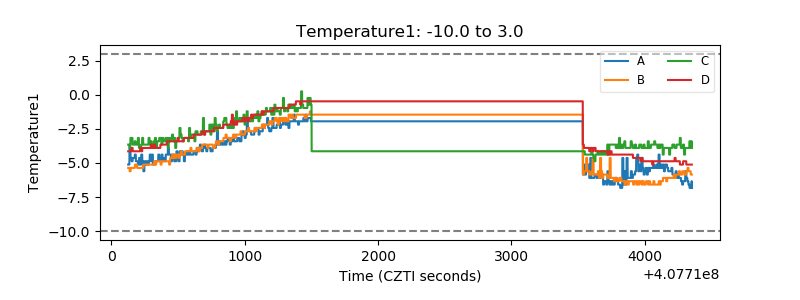 |
| Veto HV Monitor | 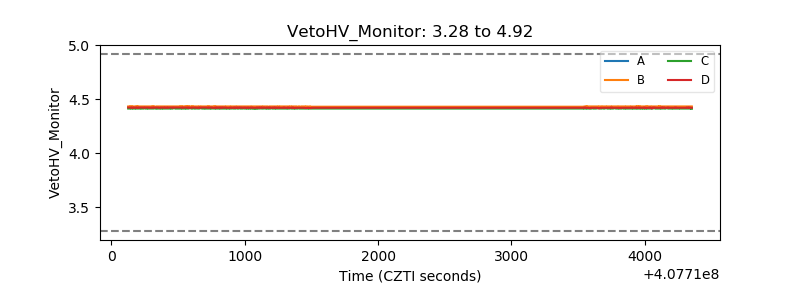 |
| Veto LLD | 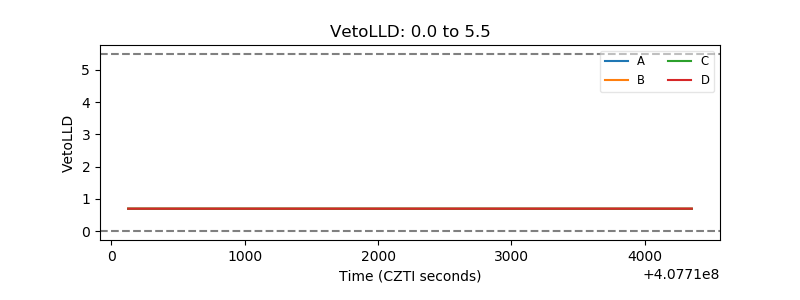 |
| Alpha Counter | 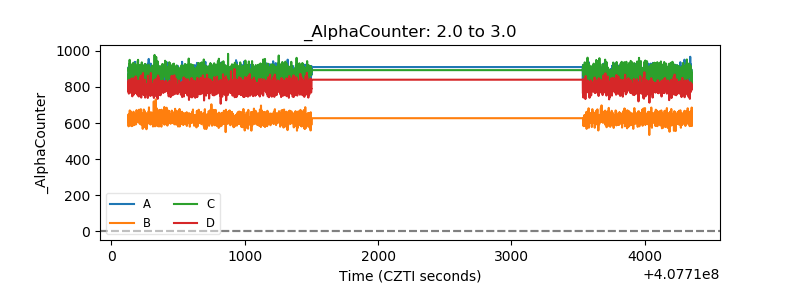 |
| _CPM_Rate | 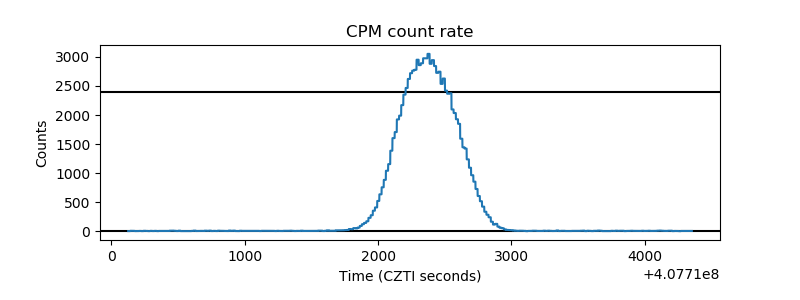 |
| CZT Counter | 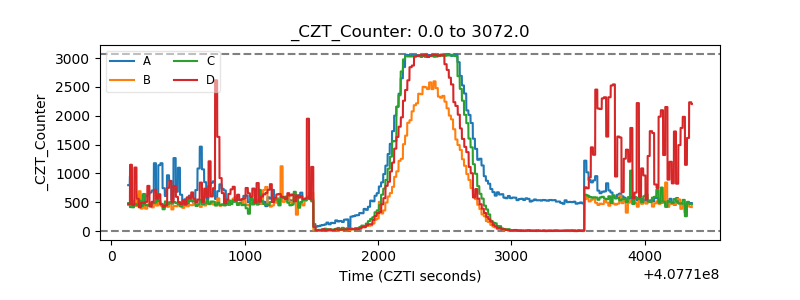 |
| +2.5 Volts monitor | 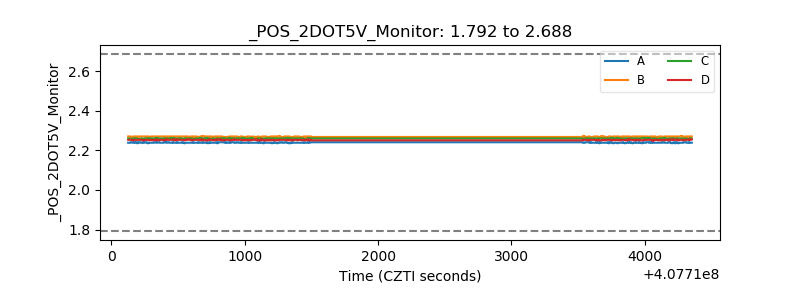 |
| +5 Volts monitor | 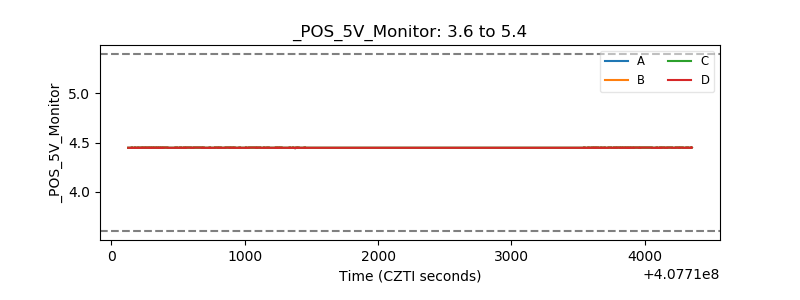 |
| _ROLL_ROT | 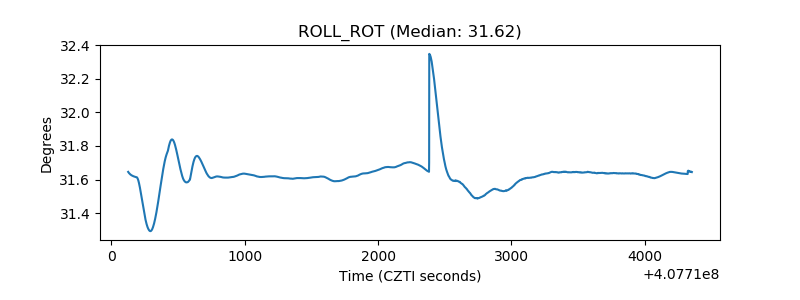 |
| _Roll_DEC | 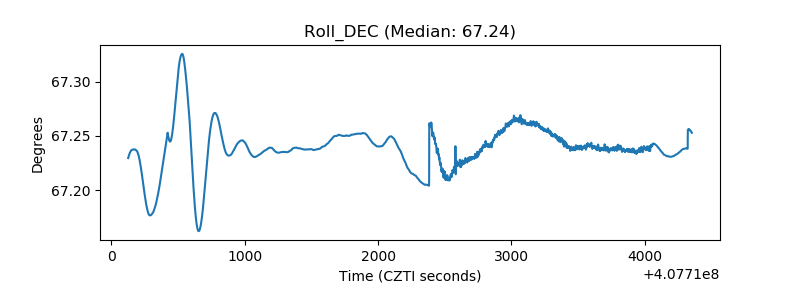 |
| _Roll_RA | 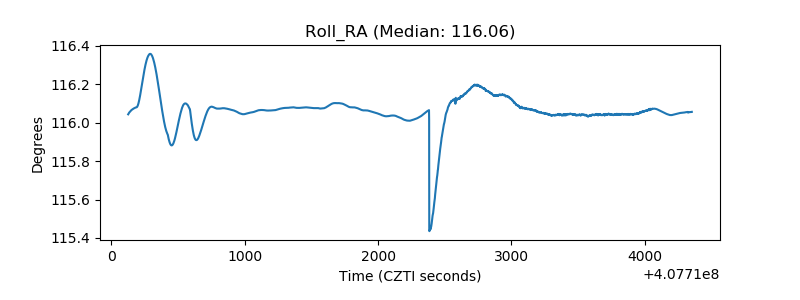 |
| Veto Counter | 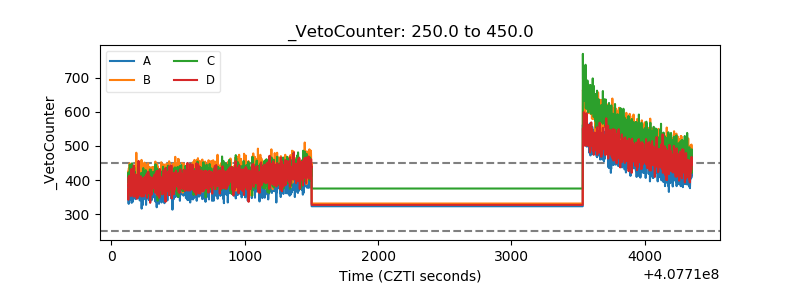 |