| Param | Original file | Final file |
|---|---|---|
| Filename | modeM0/AS1A12_083T02_9000005404_38824cztM0_level2.fits | modeM0/AS1A12_083T02_9000005404_38824cztM0_level2_quad_clean.evt |
| Size (bytes) | 368,933,760 | 86,846,400 |
| Size | 351.8 MB | 82.8 MB |
| Events in quadrant A | 2,542,133 | 603,204 |
| Events in quadrant B | 2,225,035 | 629,063 |
| Events in quadrant C | 2,366,653 | 597,899 |
| Events in quadrant D | 6,146,606 | 460,682 |
| Mode M0 | |||
|---|---|---|---|
| Quadrant | BADHDUFLAG | Total packets | Discarded packets |
| A | 0 | 10486 | 3 |
| B | 0 | 9813 | 2 |
| C | 0 | 9978 | 2 |
| D | 0 | 21575 | 2 |
| Mode SS | |||
|---|---|---|---|
| Quadrant | BADHDUFLAG | Total packets | Discarded packets |
| A | 0 | 98 | 0 |
| B | 0 | 98 | 0 |
| C | 0 | 98 | 0 |
| D | 0 | 98 | 0 |
| Mode M9 | |||
|---|---|---|---|
| Quadrant | BADHDUFLAG | Total packets | Discarded packets |
| A | 0 | 30 | 0 |
| B | 0 | 30 | 0 |
| C | 0 | 30 | 0 |
| D | 0 | 31 | 0 |
| Quadrant | Total seconds | Saturated seconds | Saturation percentage |
|---|---|---|---|
| A | 4832 | 17 | 0.351821% |
| B | 4832 | 10 | 0.206954% |
| C | 4832 | 11 | 0.227649% |
| D | 4832 | 947 | 19.598510% |
Noise dominated data is calculated using 1-second bins in cleaned event files. If a bin has >2000 counts, and if more than 50% of those come from <1% of pixels, then it is considered to be noise-dominated and hence unusable.
| Quadrant | # 1 sec bins | Bins with >0 counts | Bins with >2000 counts | High rate bins dominated by noise | Noise dominated (total time) | Noise dominated (detector-on time) | Marked lightcurve |
|---|---|---|---|---|---|---|---|
| A | 6955 | 4833 | 4 | 4 | 0.06% | 0.08% | 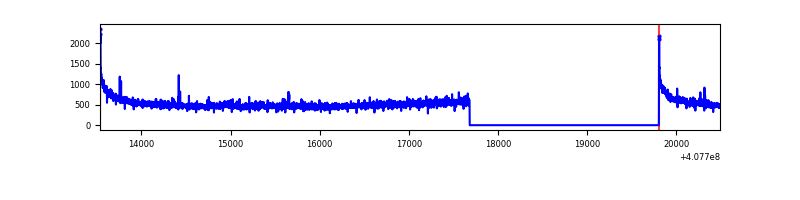 |
| B | 6955 | 4833 | 3 | 3 | 0.04% | 0.06% | 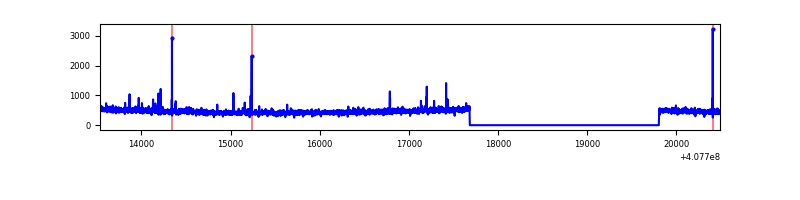 |
| C | 6955 | 4833 | 4 | 4 | 0.06% | 0.08% | 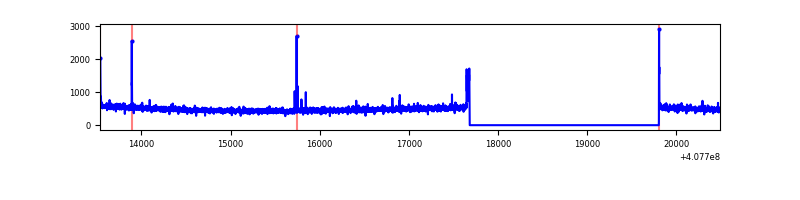 |
| D | 6955 | 4833 | 1083 | 1083 | 15.57% | 22.41% | 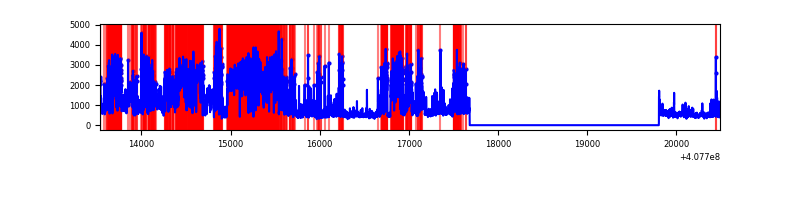 |
Top three noisy pixels from each quadrant. If the there are fewer than three noisy pixels in the level2.evt file, extra rows are filled as -1
| Pixel properties | Quadrant properties | ||||||
|---|---|---|---|---|---|---|---|
| Quadrant | DetID | PixID | Counts | Sigma | Mean | Median | Sigma |
| A | 10 | 83 | 380158 | 3462.36 | 545 | 536 | 109.6 |
| A | 6 | 10 | 23615 | 210.49 | 545 | 536 | 109.6 |
| A | 13 | 6 | 10370 | 89.69 | 545 | 536 | 109.6 |
| B | 5 | 172 | 19349 | 180.44 | 551 | 537 | 104.3 |
| B | 0 | 230 | 14680 | 135.66 | 551 | 537 | 104.3 |
| B | 5 | 184 | 12592 | 115.63 | 551 | 537 | 104.3 |
| C | 15 | 214 | 215048 | 1746.75 | 536 | 540 | 122.8 |
| C | 15 | 208 | 24076 | 191.65 | 536 | 540 | 122.8 |
| C | 0 | 10 | 13349 | 104.3 | 536 | 540 | 122.8 |
| D | 12 | 227 | 2440809 | 20115.02 | 497 | 483 | 121.3 |
| D | 4 | 239 | 859049 | 7076.95 | 497 | 483 | 121.3 |
| D | 2 | 16 | 353314 | 2908.3 | 497 | 483 | 121.3 |
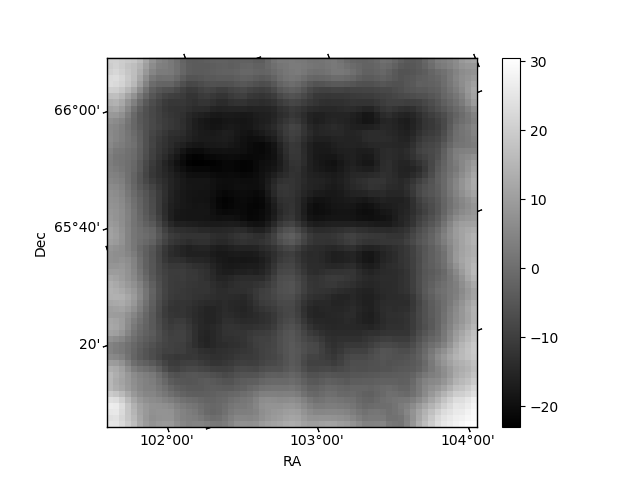
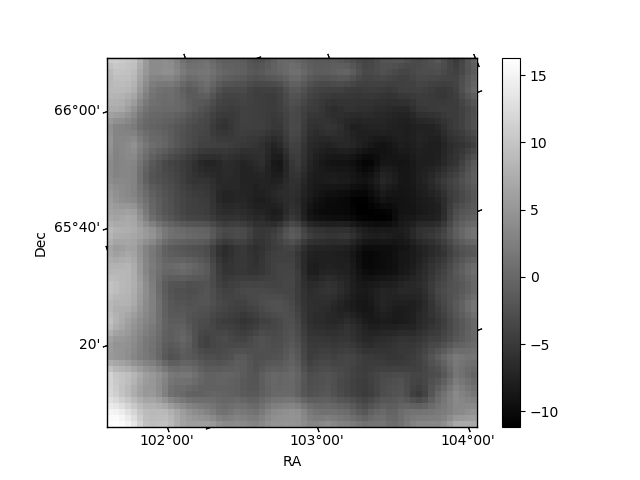
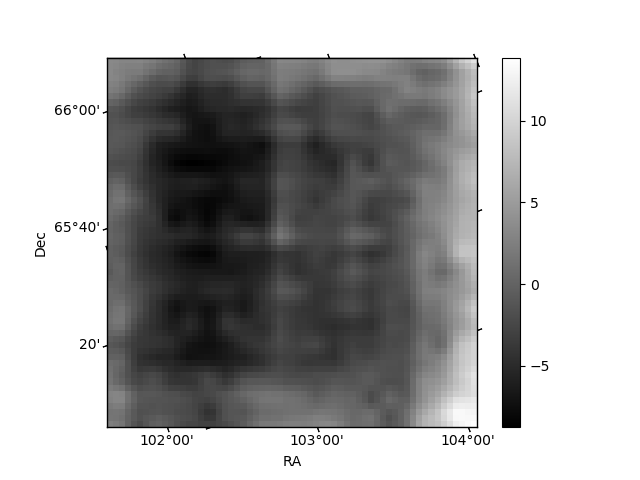
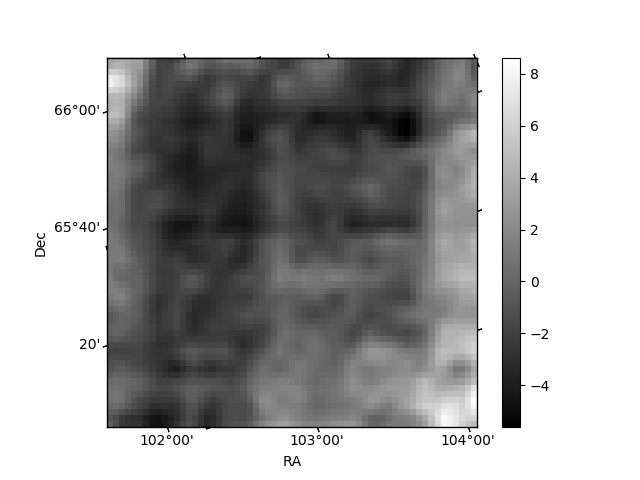
Histogram calculated using DETX and DETY for each event in the final _common_clean file
| Quadrant A | 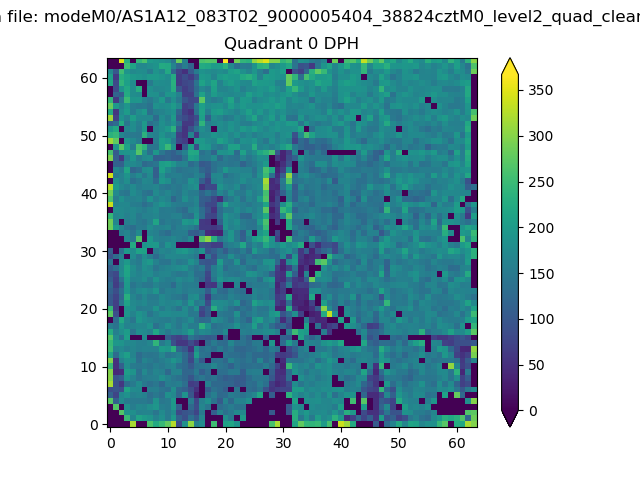 |
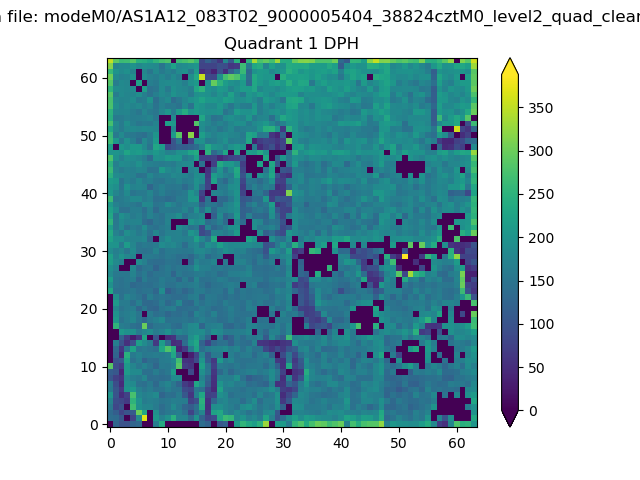 |
Quadrant B |
|---|---|---|---|
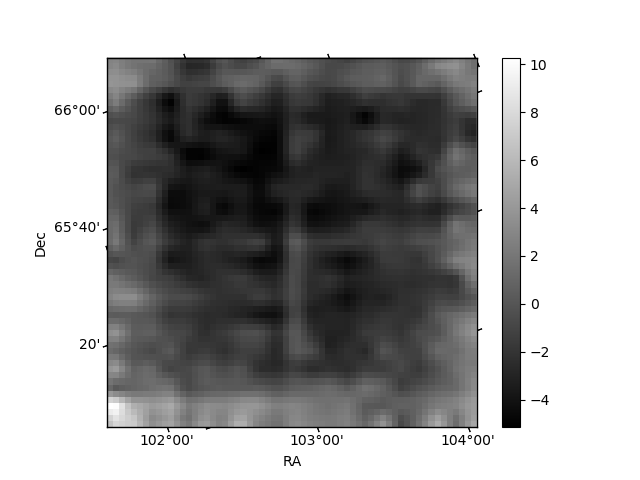
| Quadrant D |  |
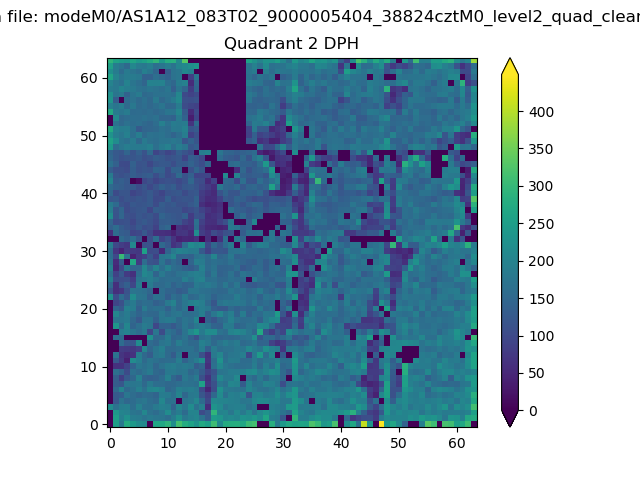 |
Quadrant C |
| Plot type | Count rate plots | Images |
|---|---|---|
| Comparison with Poisson distribution Blue bars denote a histogram of data divided into 1 sec bins. Red curve is a Poisson curve with rate = median count rate of data. |
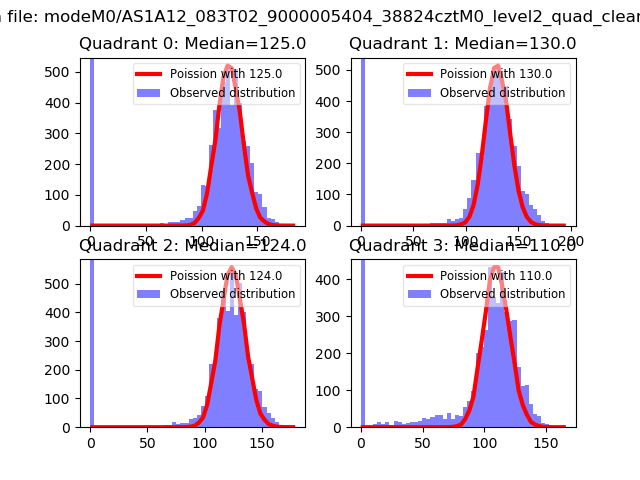 |
 |
| Quadrant-wise count rates Data is divided into 100 sec bins |
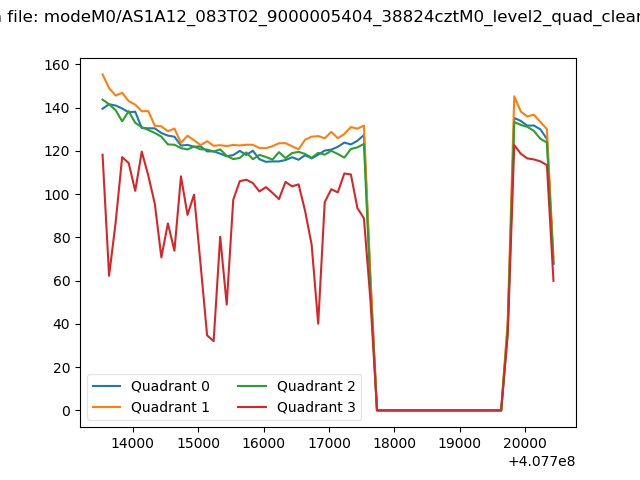 |
|
| Module-wise count rates for Quadrant A Data is divided into 100 sec bins |
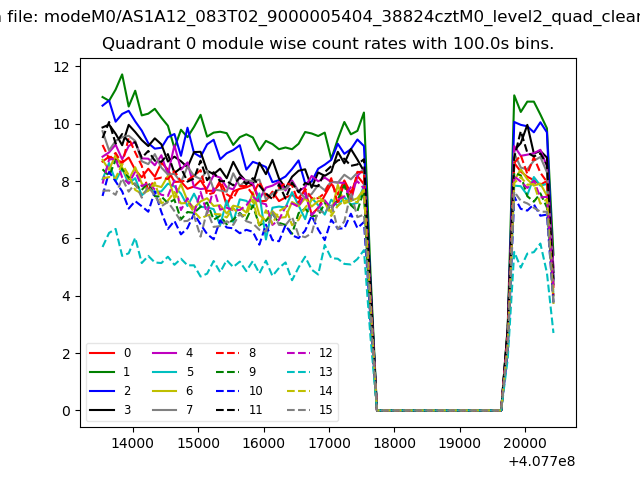 |
 |
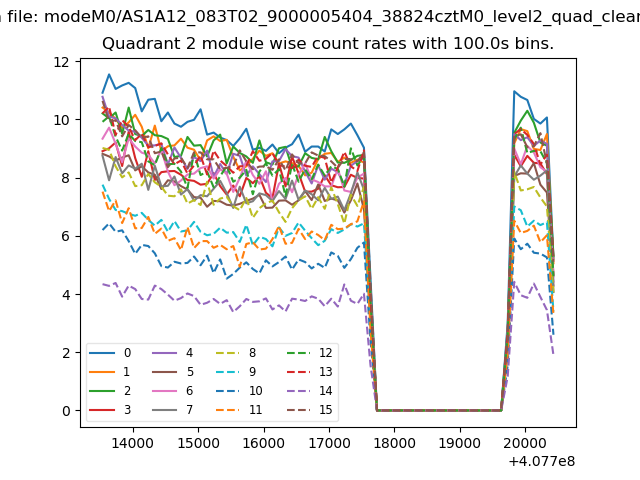
| Module-wise count rates for Quadrant B Data is divided into 100 sec bins |
 |
 |
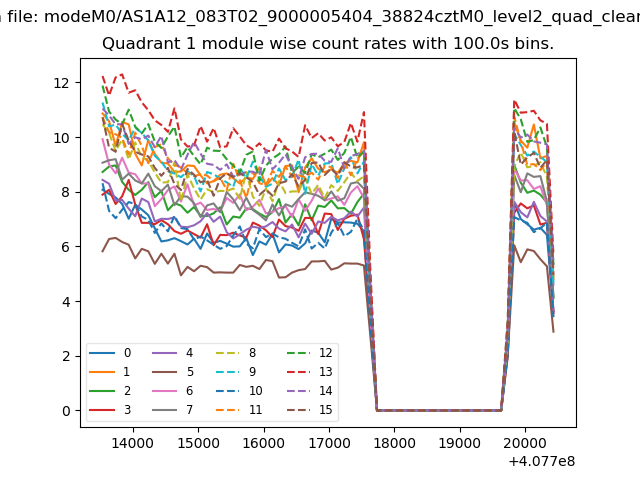
| Module-wise count rates for Quadrant C Data is divided into 100 sec bins |
 |
 |
| Module-wise count rates for Quadrant D Data is divided into 100 sec bins |
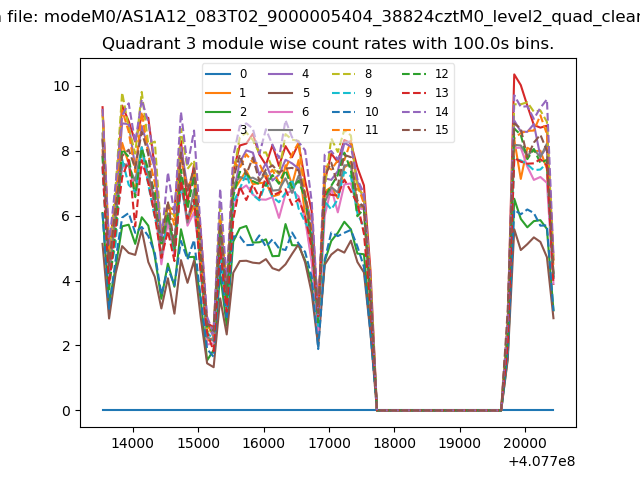 |
 |
| Parameter | Plot |
|---|---|
| CZT HV Monitor | 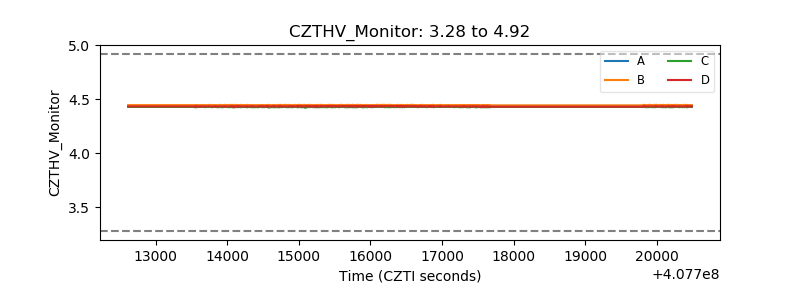 |
| D_VDD | 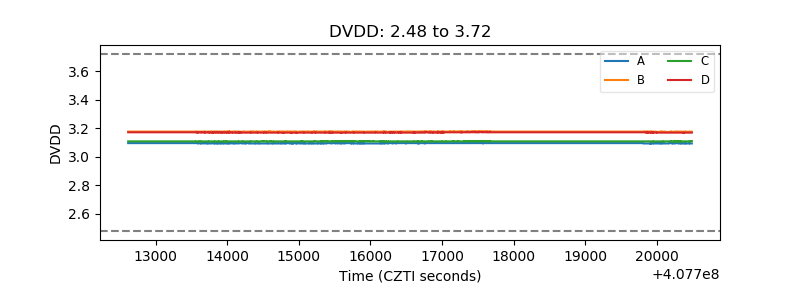 |
| Temperature 1 | 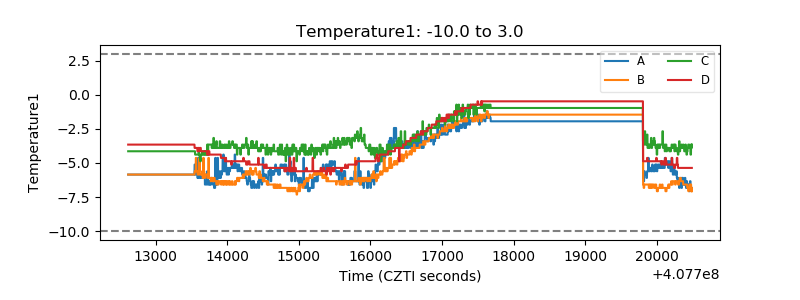 |
| Veto HV Monitor | 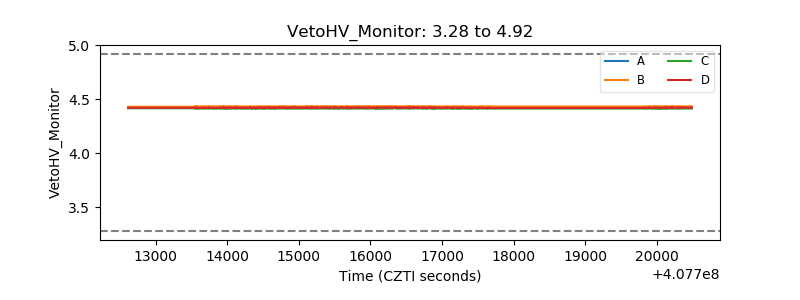 |
| Veto LLD | 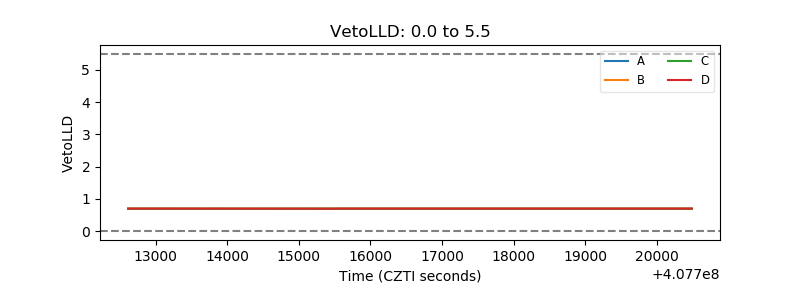 |
| Alpha Counter | 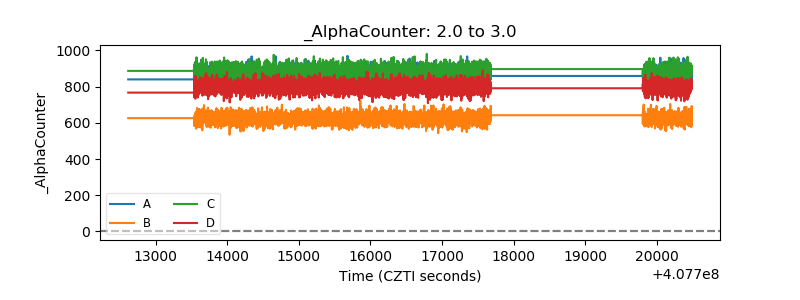 |
| _CPM_Rate | 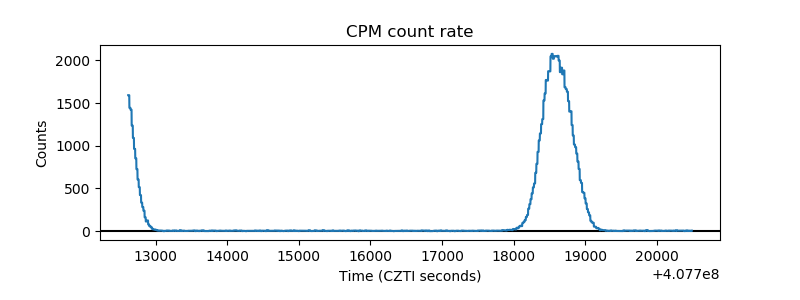 |
| CZT Counter | 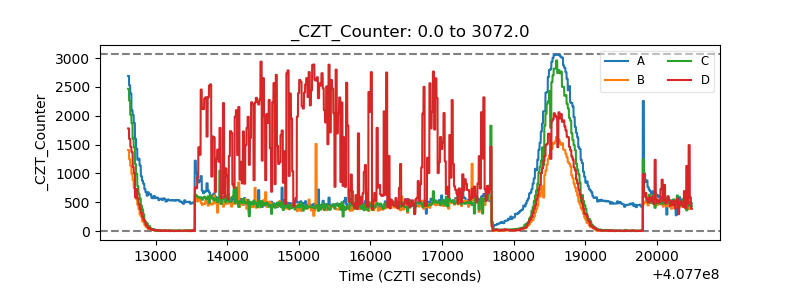 |
| +2.5 Volts monitor | 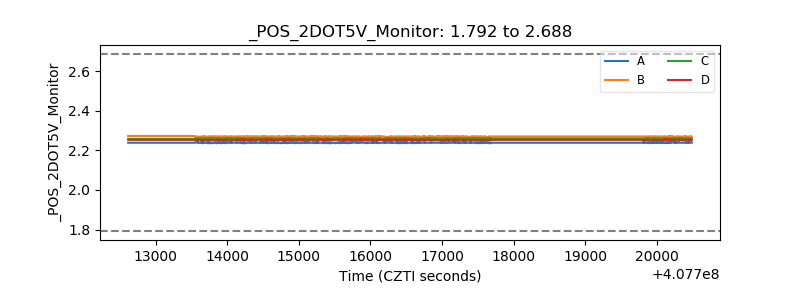 |
| +5 Volts monitor | 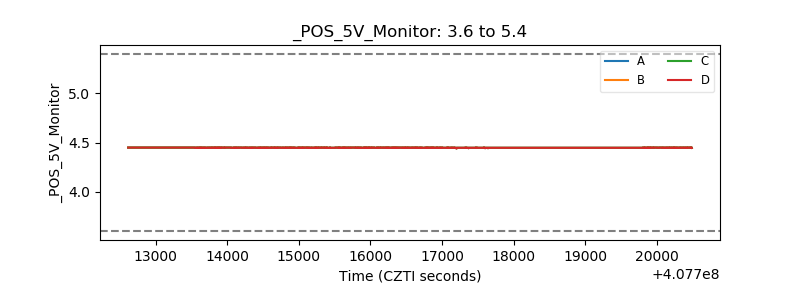 |
| _ROLL_ROT | 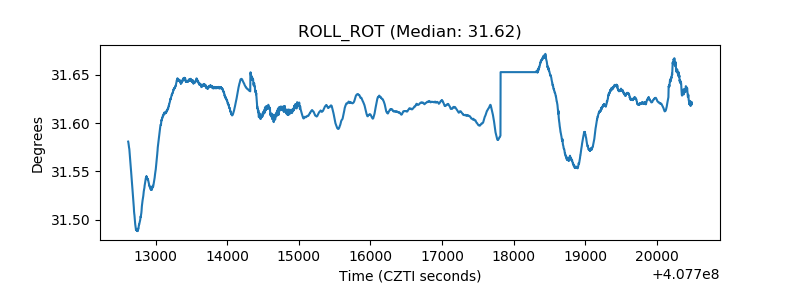 |
| _Roll_DEC | 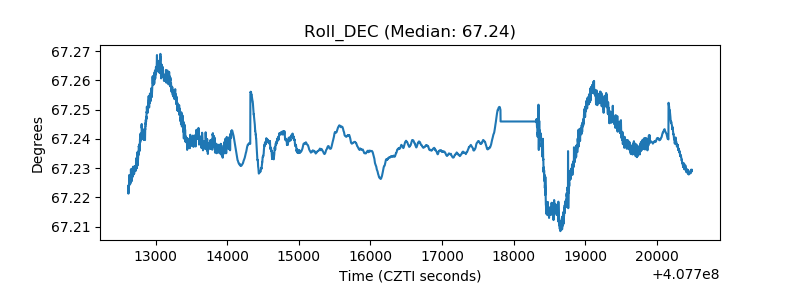 |
| _Roll_RA | 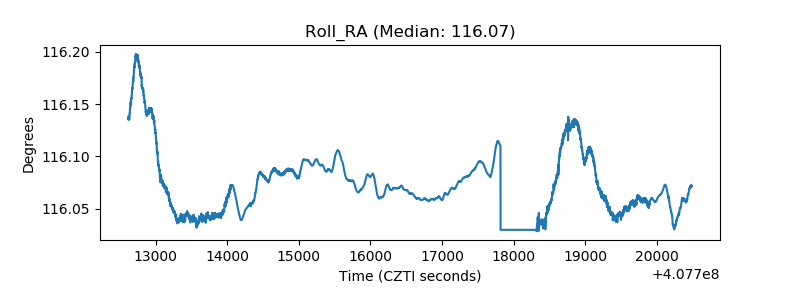 |
| Veto Counter | 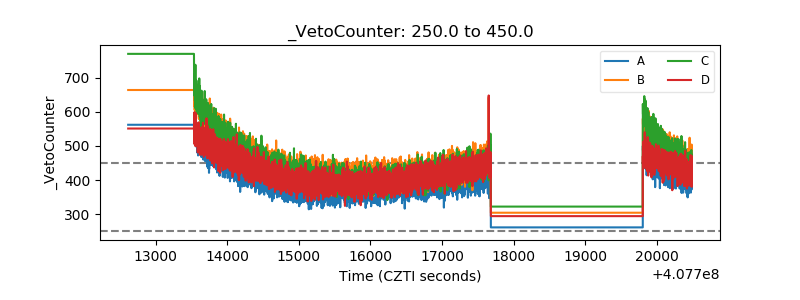 |