| Param | Original file | Final file |
|---|---|---|
| Filename | modeM0/AS1A12_083T02_9000005404_38826cztM0_level2.fits | modeM0/AS1A12_083T02_9000005404_38826cztM0_level2_quad_clean.evt |
| Size (bytes) | 301,717,440 | 89,196,480 |
| Size | 287.7 MB | 85.1 MB |
| Events in quadrant A | 2,740,239 | 601,627 |
| Events in quadrant B | 2,269,281 | 616,731 |
| Events in quadrant C | 2,505,912 | 584,694 |
| Events in quadrant D | 3,246,311 | 532,407 |
| Mode M0 | |||
|---|---|---|---|
| Quadrant | BADHDUFLAG | Total packets | Discarded packets |
| A | 0 | 11446 | 3 |
| B | 0 | 10534 | 2 |
| C | 0 | 10899 | 2 |
| D | 0 | 13169 | 2 |
| Mode SS | |||
|---|---|---|---|
| Quadrant | BADHDUFLAG | Total packets | Discarded packets |
| A | 0 | 106 | 0 |
| B | 0 | 106 | 0 |
| C | 0 | 106 | 0 |
| D | 0 | 106 | 0 |
| Mode M9 | |||
|---|---|---|---|
| Quadrant | BADHDUFLAG | Total packets | Discarded packets |
| A | 0 | 38 | 0 |
| B | 0 | 38 | 0 |
| C | 0 | 38 | 0 |
| D | 0 | 39 | 0 |
| Quadrant | Total seconds | Saturated seconds | Saturation percentage |
|---|---|---|---|
| A | 5219 | 13 | 0.249090% |
| B | 5219 | 11 | 0.210768% |
| C | 5219 | 17 | 0.325733% |
| D | 5219 | 73 | 1.398735% |
Noise dominated data is calculated using 1-second bins in cleaned event files. If a bin has >2000 counts, and if more than 50% of those come from <1% of pixels, then it is considered to be noise-dominated and hence unusable.
| Quadrant | # 1 sec bins | Bins with >0 counts | Bins with >2000 counts | High rate bins dominated by noise | Noise dominated (total time) | Noise dominated (detector-on time) | Marked lightcurve |
|---|---|---|---|---|---|---|---|
| A | 7282 | 5220 | 9 | 9 | 0.12% | 0.17% | 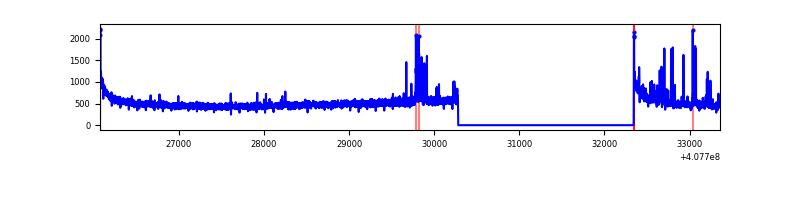 |
| B | 7282 | 5220 | 5 | 5 | 0.07% | 0.10% | 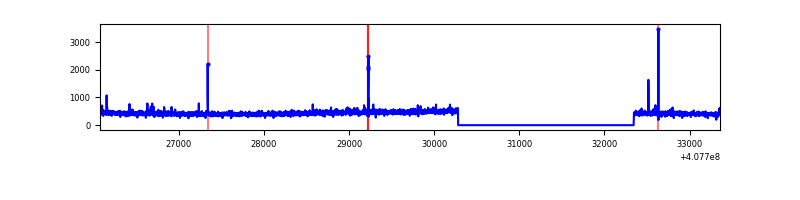 |
| C | 7282 | 5220 | 18 | 18 | 0.25% | 0.34% | 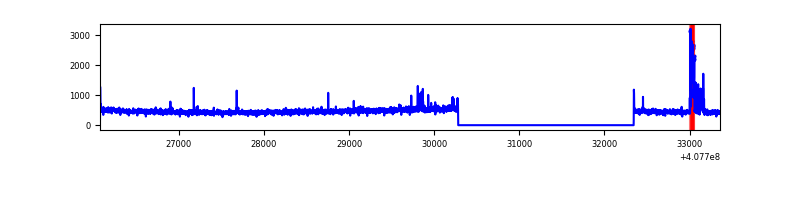 |
| D | 7282 | 5220 | 68 | 68 | 0.93% | 1.30% | 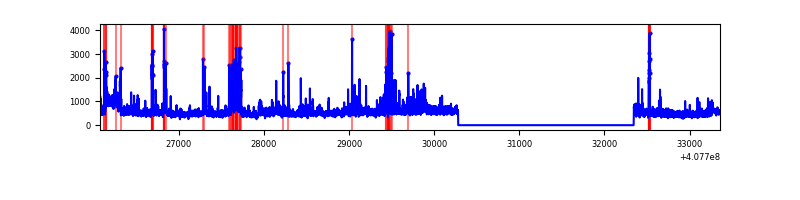 |
Top three noisy pixels from each quadrant. If the there are fewer than three noisy pixels in the level2.evt file, extra rows are filled as -1
| Pixel properties | Quadrant properties | ||||||
|---|---|---|---|---|---|---|---|
| Quadrant | DetID | PixID | Counts | Sigma | Mean | Median | Sigma |
| A | 10 | 83 | 401925 | 3519.8 | 566 | 557 | 114.0 |
| A | 13 | 248 | 127761 | 1115.52 | 566 | 557 | 114.0 |
| A | 13 | 6 | 15511 | 131.14 | 566 | 557 | 114.0 |
| B | 5 | 172 | 31703 | 288.0 | 564 | 549 | 108.2 |
| B | 12 | 111 | 13335 | 118.2 | 564 | 549 | 108.2 |
| B | 11 | 111 | 12406 | 109.61 | 564 | 549 | 108.2 |
| C | 15 | 214 | 233149 | 1840.16 | 545 | 548 | 126.4 |
| C | 15 | 208 | 116926 | 920.69 | 545 | 548 | 126.4 |
| C | 1 | 23 | 19692 | 151.45 | 545 | 548 | 126.4 |
| D | 2 | 16 | 400245 | 3025.32 | 540 | 524 | 132.1 |
| D | 10 | 118 | 283192 | 2139.4 | 540 | 524 | 132.1 |
| D | 5 | 222 | 264881 | 2000.81 | 540 | 524 | 132.1 |
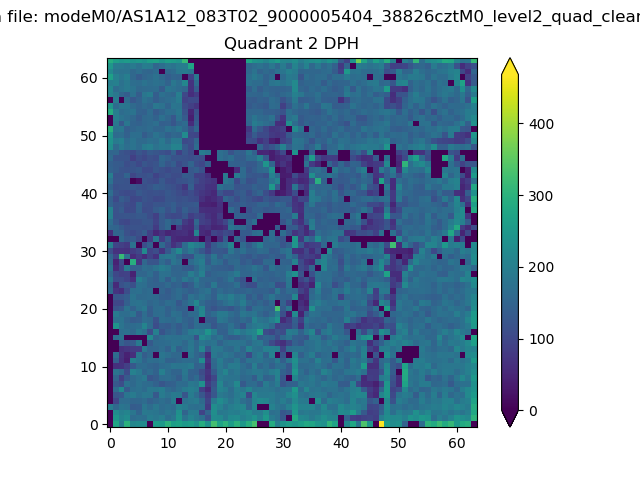
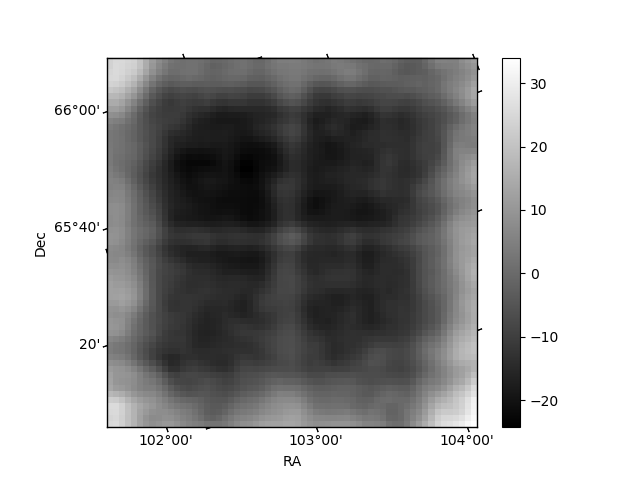
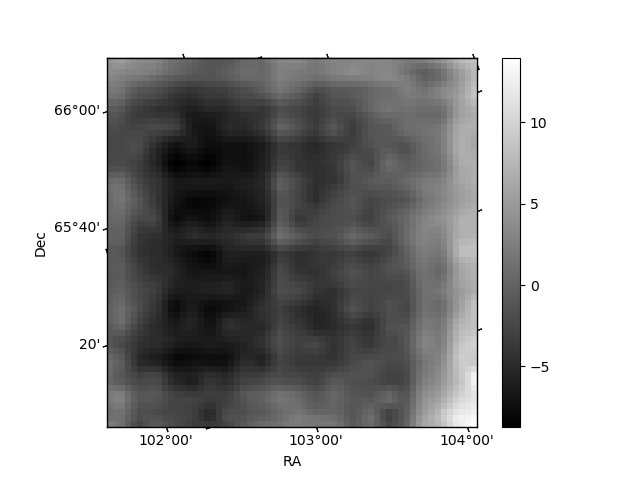
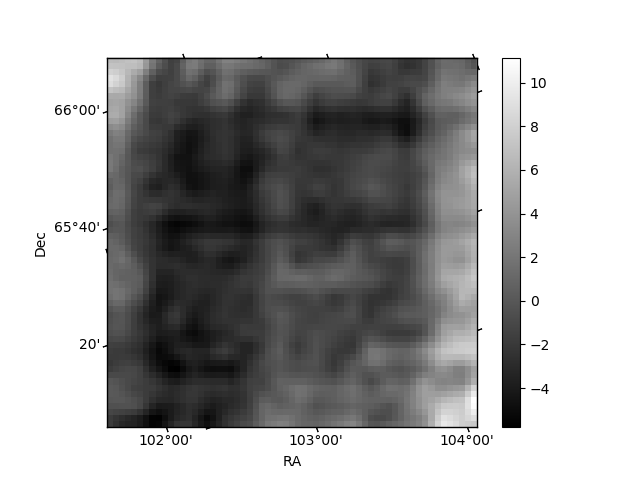
Histogram calculated using DETX and DETY for each event in the final _common_clean file
| Quadrant A | 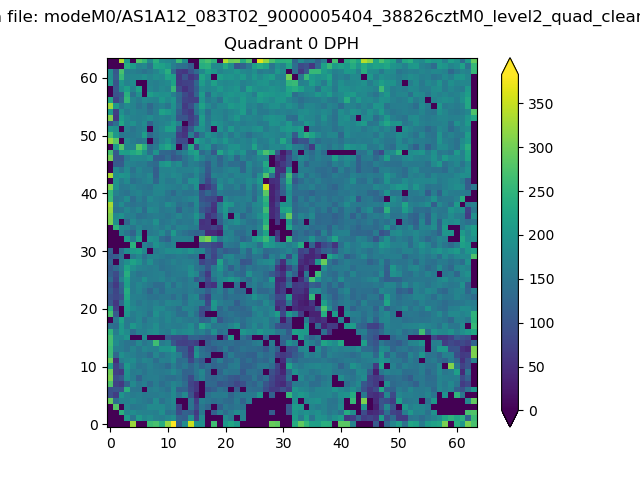 |
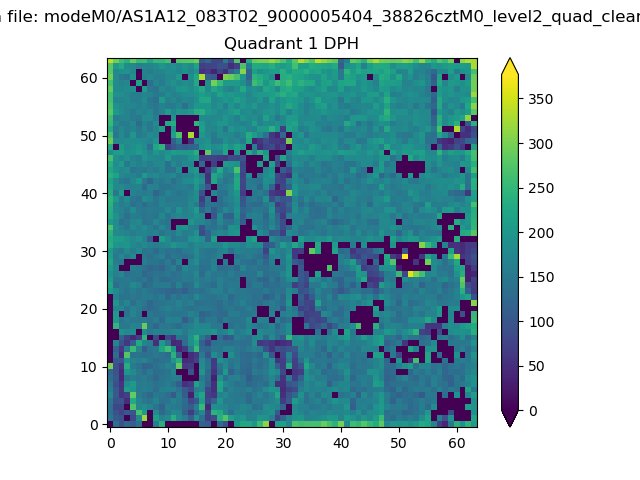 |
Quadrant B |
|---|---|---|---|
| Quadrant D | 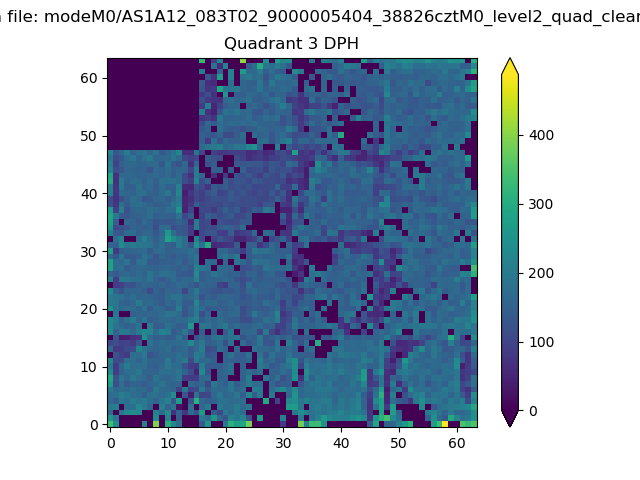 |
 |
Quadrant C |
| Plot type | Count rate plots | Images |
|---|---|---|
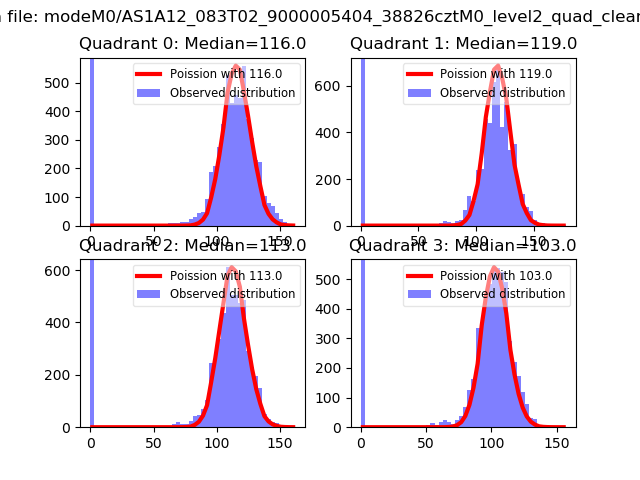
| Comparison with Poisson distribution Blue bars denote a histogram of data divided into 1 sec bins. Red curve is a Poisson curve with rate = median count rate of data. |
 |
 |
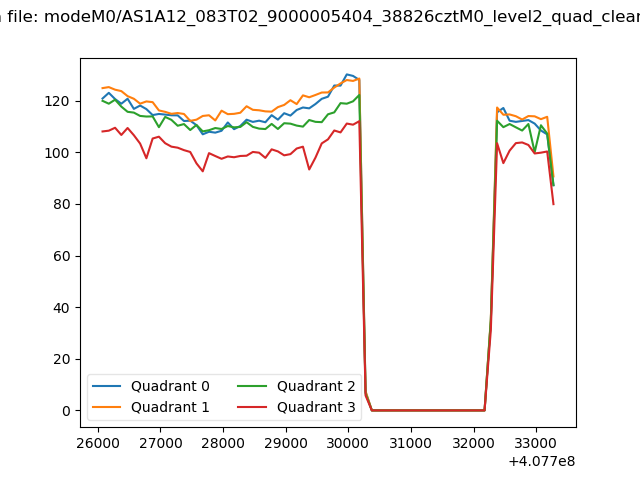
| Quadrant-wise count rates Data is divided into 100 sec bins |
 |
|
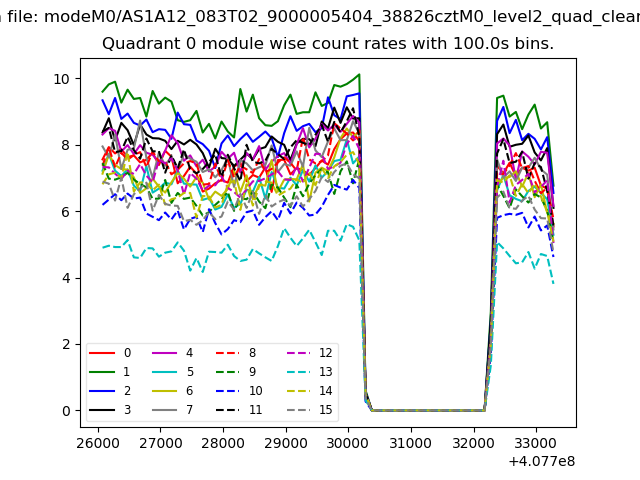
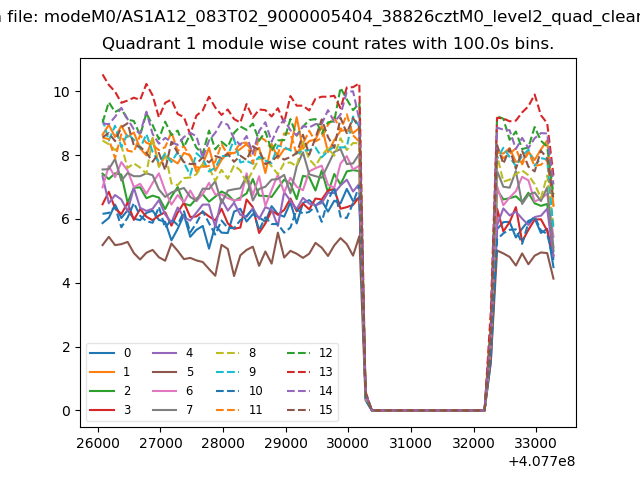
| Module-wise count rates for Quadrant A Data is divided into 100 sec bins |
 |
 |
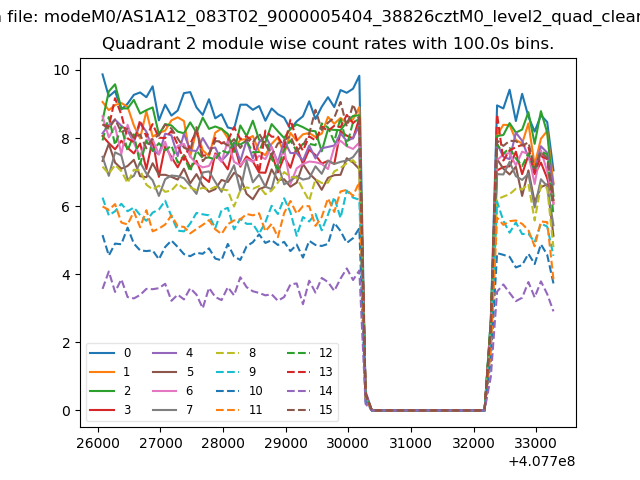
| Module-wise count rates for Quadrant B Data is divided into 100 sec bins |
 |
 |
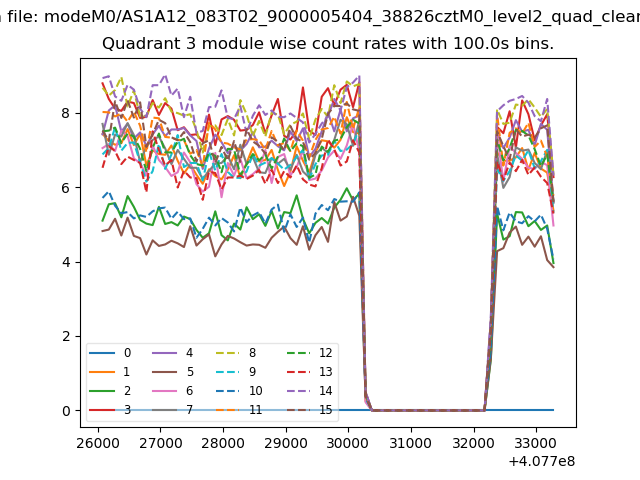
| Module-wise count rates for Quadrant C Data is divided into 100 sec bins |
 |
 |
| Module-wise count rates for Quadrant D Data is divided into 100 sec bins |
 |
 |
| Parameter | Plot |
|---|---|
| CZT HV Monitor | 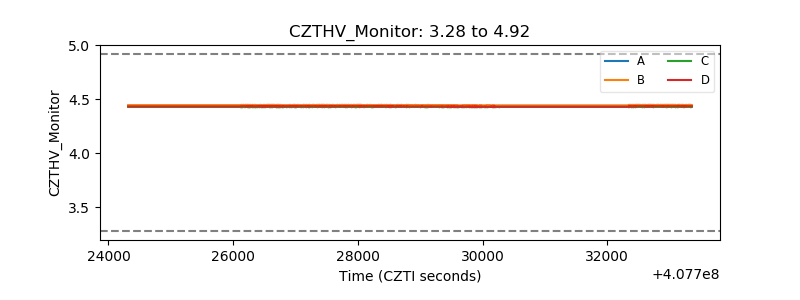 |
| D_VDD | 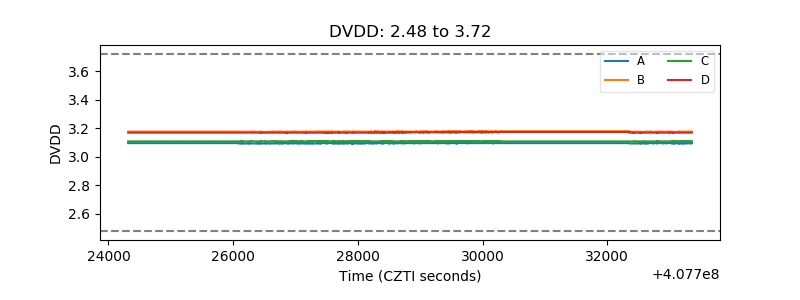 |
| Temperature 1 | 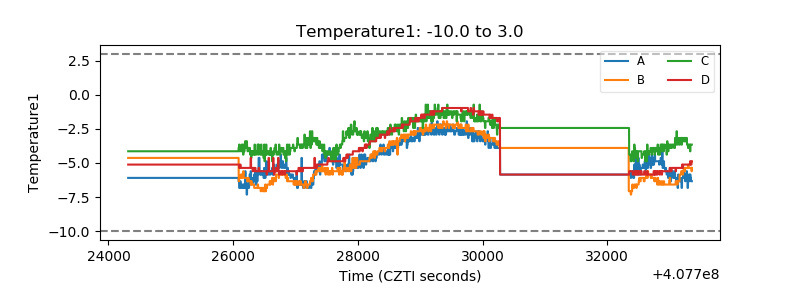 |
| Veto HV Monitor | 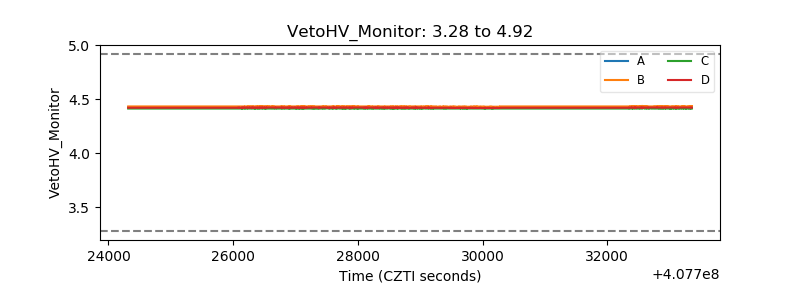 |
| Veto LLD | 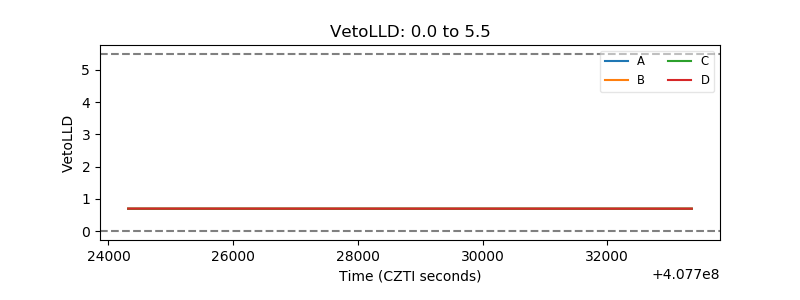 |
| Alpha Counter | 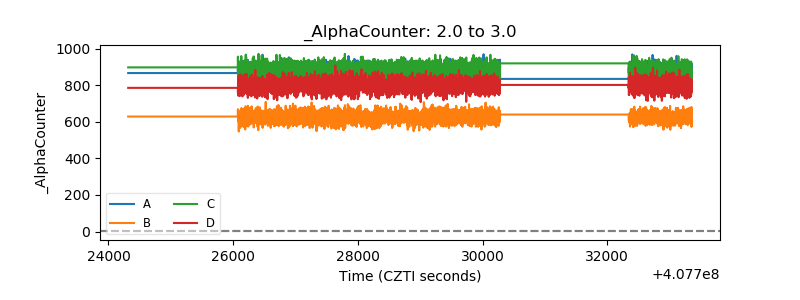 |
| _CPM_Rate | 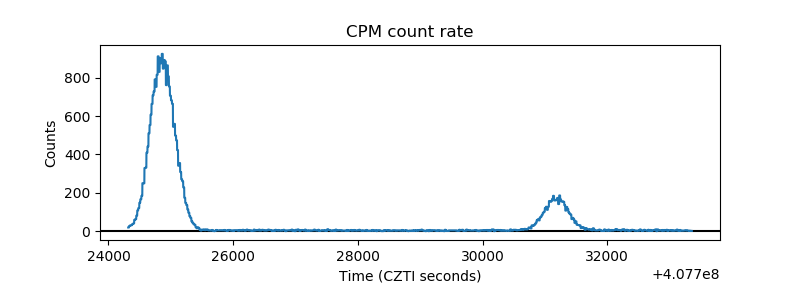 |
| CZT Counter | 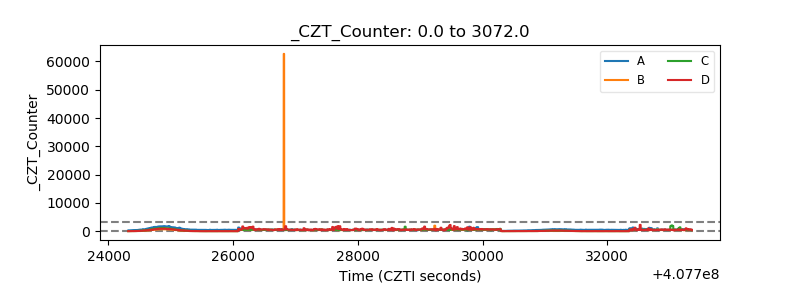 |
| +2.5 Volts monitor | 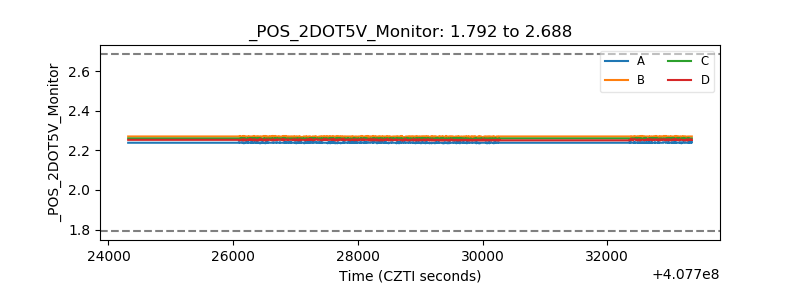 |
| +5 Volts monitor | 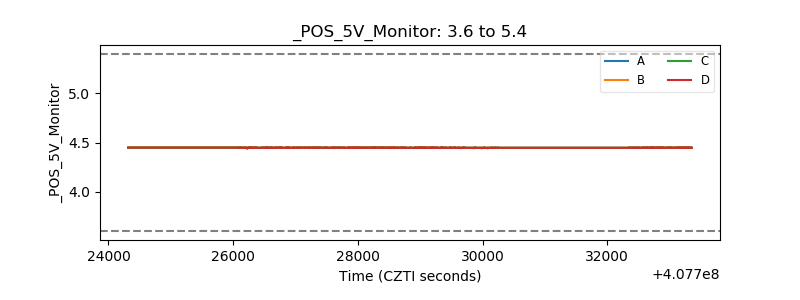 |
| _ROLL_ROT | 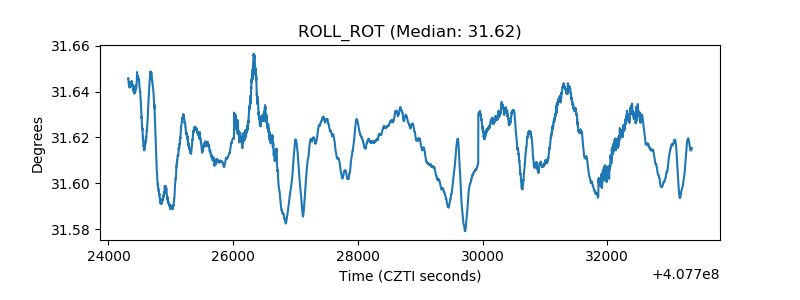 |
| _Roll_DEC | 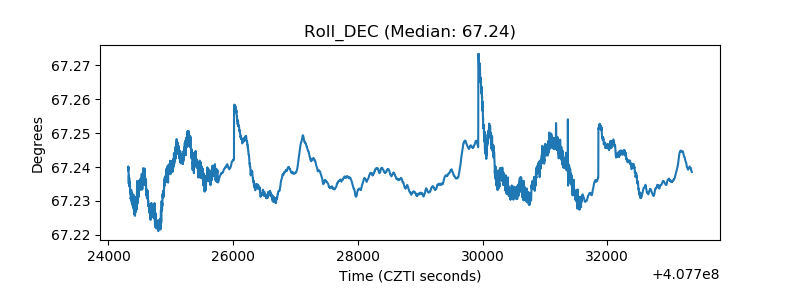 |
| _Roll_RA | 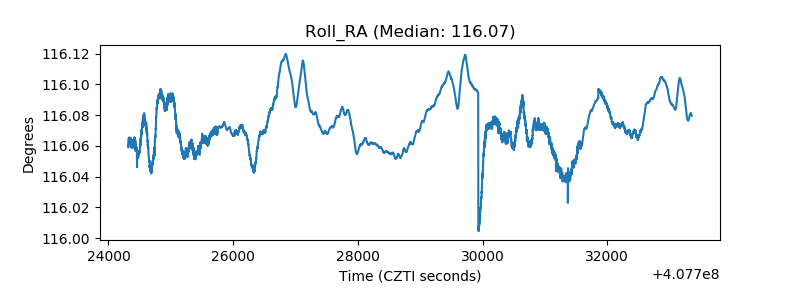 |
| Veto Counter | 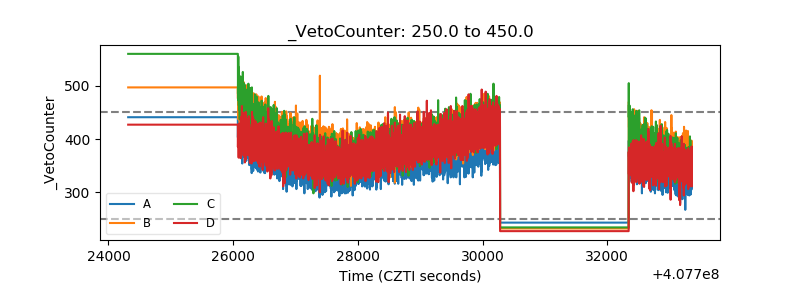 |