| Param | Original file | Final file |
|---|---|---|
| Filename | modeM0/AS1A12_083T02_9000005404_38827cztM0_level2.fits | modeM0/AS1A12_083T02_9000005404_38827cztM0_level2_quad_clean.evt |
| Size (bytes) | 308,865,600 | 88,148,160 |
| Size | 294.6 MB | 84.1 MB |
| Events in quadrant A | 2,851,865 | 593,420 |
| Events in quadrant B | 2,525,148 | 602,937 |
| Events in quadrant C | 2,630,170 | 574,422 |
| Events in quadrant D | 3,011,893 | 526,551 |
| Mode M0 | |||
|---|---|---|---|
| Quadrant | BADHDUFLAG | Total packets | Discarded packets |
| A | 0 | 11723 | 3 |
| B | 0 | 11316 | 2 |
| C | 0 | 11325 | 2 |
| D | 0 | 12754 | 2 |
| Mode SS | |||
|---|---|---|---|
| Quadrant | BADHDUFLAG | Total packets | Discarded packets |
| A | 0 | 108 | 0 |
| B | 0 | 108 | 0 |
| C | 0 | 108 | 0 |
| D | 0 | 108 | 0 |
| Mode M9 | |||
|---|---|---|---|
| Quadrant | BADHDUFLAG | Total packets | Discarded packets |
| A | 0 | 37 | 0 |
| B | 0 | 37 | 0 |
| C | 0 | 37 | 0 |
| D | 0 | 38 | 0 |
| Quadrant | Total seconds | Saturated seconds | Saturation percentage |
|---|---|---|---|
| A | 5312 | 15 | 0.282380% |
| B | 5312 | 68 | 1.280120% |
| C | 5312 | 37 | 0.696536% |
| D | 5312 | 86 | 1.618976% |
Noise dominated data is calculated using 1-second bins in cleaned event files. If a bin has >2000 counts, and if more than 50% of those come from <1% of pixels, then it is considered to be noise-dominated and hence unusable.
| Quadrant | # 1 sec bins | Bins with >0 counts | Bins with >2000 counts | High rate bins dominated by noise | Noise dominated (total time) | Noise dominated (detector-on time) | Marked lightcurve |
|---|---|---|---|---|---|---|---|
| A | 7133 | 5313 | 8 | 8 | 0.11% | 0.15% | 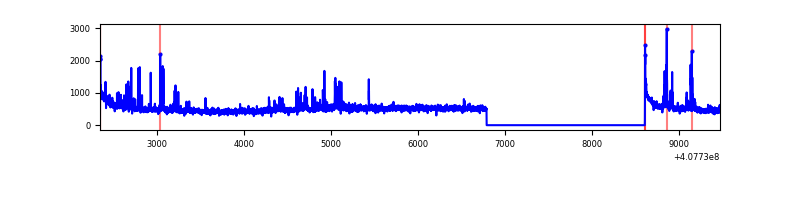 |
| B | 7133 | 5313 | 54 | 54 | 0.76% | 1.02% | 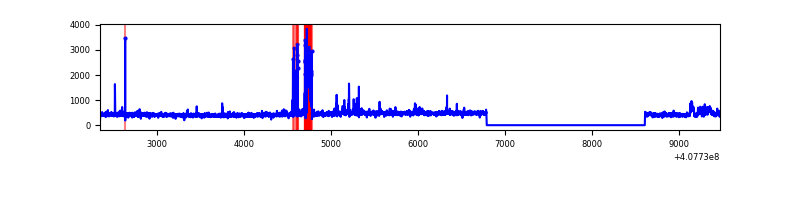 |
| C | 7133 | 5313 | 32 | 32 | 0.45% | 0.60% | 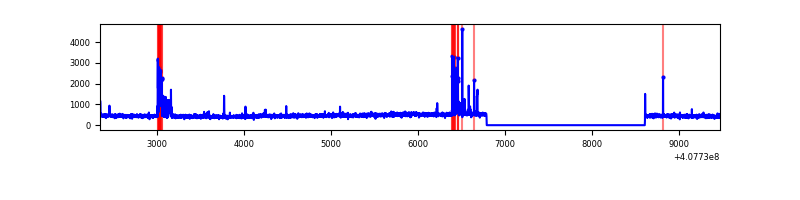 |
| D | 7133 | 5313 | 63 | 63 | 0.88% | 1.19% | 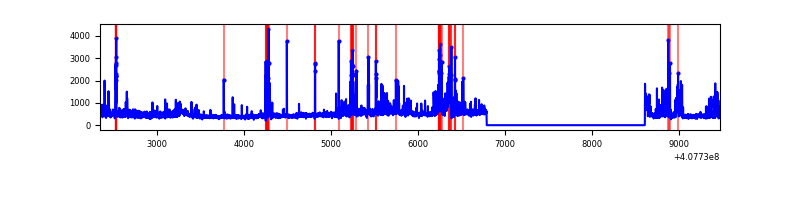 |
Top three noisy pixels from each quadrant. If the there are fewer than three noisy pixels in the level2.evt file, extra rows are filled as -1
| Pixel properties | Quadrant properties | ||||||
|---|---|---|---|---|---|---|---|
| Quadrant | DetID | PixID | Counts | Sigma | Mean | Median | Sigma |
| A | 10 | 83 | 404008 | 3463.58 | 574 | 564 | 116.5 |
| A | 13 | 248 | 197538 | 1691.03 | 574 | 564 | 116.5 |
| A | 13 | 6 | 21289 | 177.92 | 574 | 564 | 116.5 |
| B | 5 | 172 | 171059 | 1555.45 | 567 | 550 | 109.6 |
| B | 5 | 200 | 55073 | 497.38 | 567 | 550 | 109.6 |
| B | 0 | 221 | 35183 | 315.94 | 567 | 550 | 109.6 |
| C | 15 | 214 | 236724 | 1834.93 | 553 | 555 | 128.7 |
| C | 15 | 208 | 206146 | 1597.35 | 553 | 555 | 128.7 |
| C | 14 | 254 | 8714 | 63.39 | 553 | 555 | 128.7 |
| D | 12 | 227 | 229648 | 1688.68 | 552 | 535 | 135.7 |
| D | 2 | 16 | 198022 | 1455.58 | 552 | 535 | 135.7 |
| D | 2 | 250 | 150280 | 1103.7 | 552 | 535 | 135.7 |
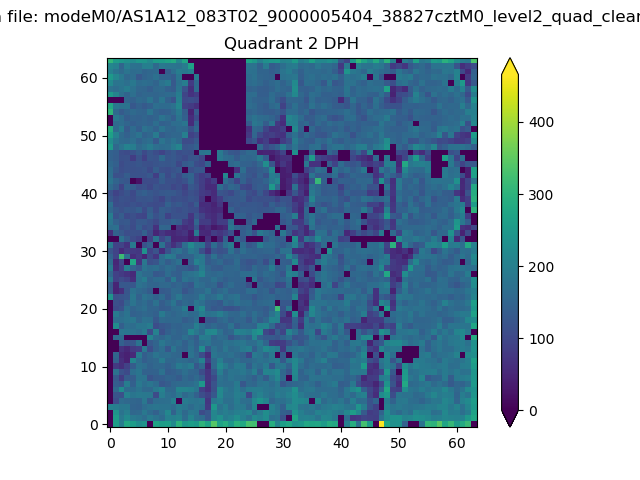
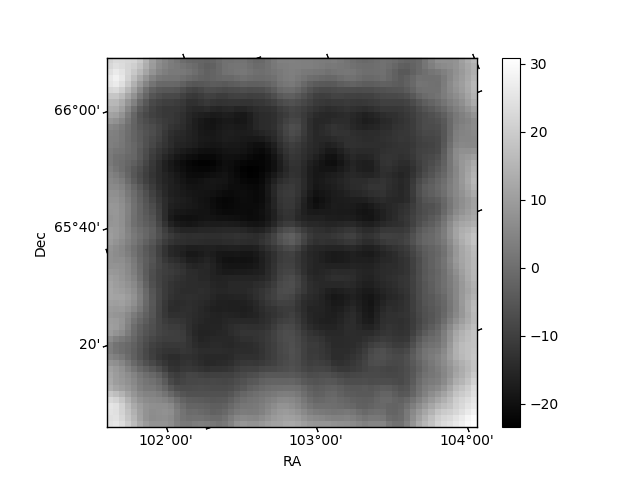
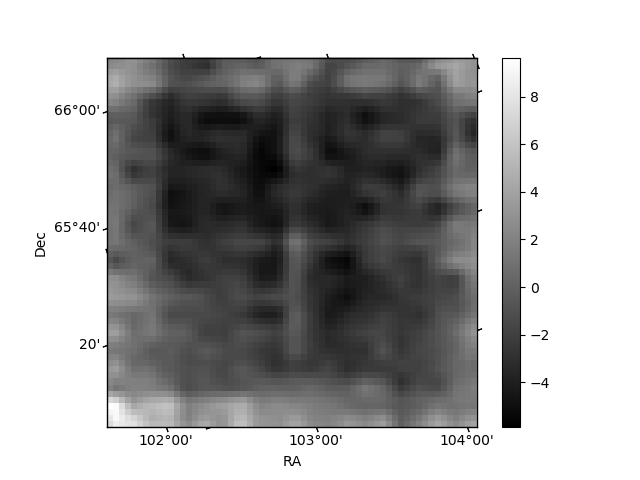
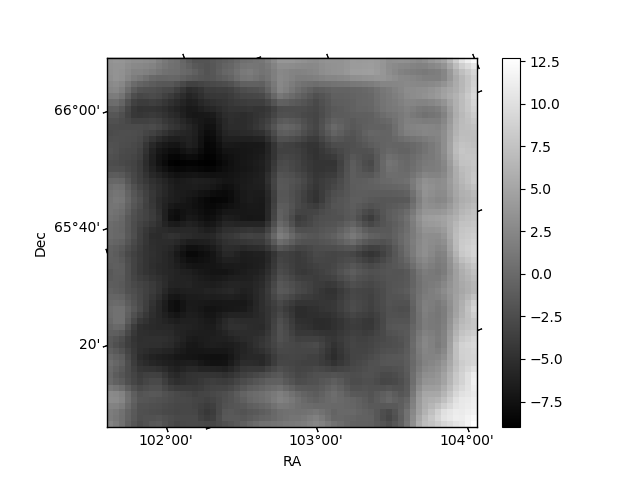
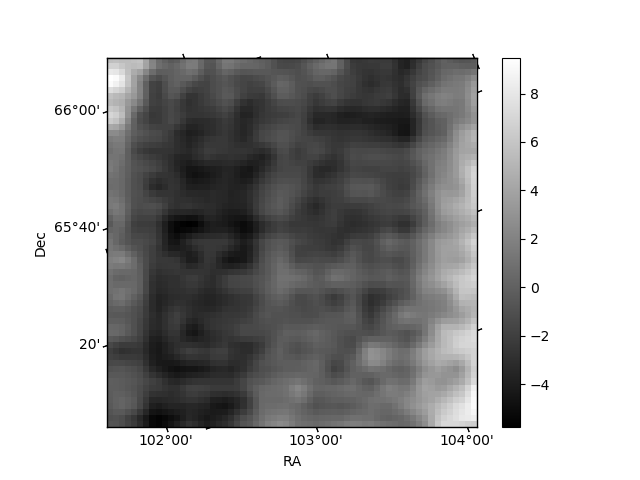
Histogram calculated using DETX and DETY for each event in the final _common_clean file
| Quadrant A | 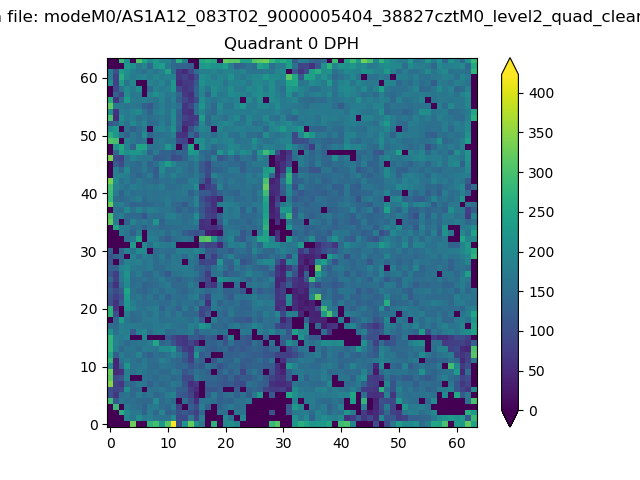 |
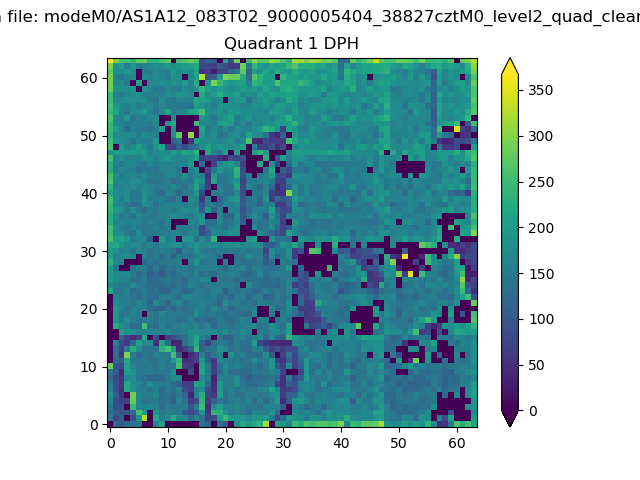 |
Quadrant B |
|---|---|---|---|
| Quadrant D | 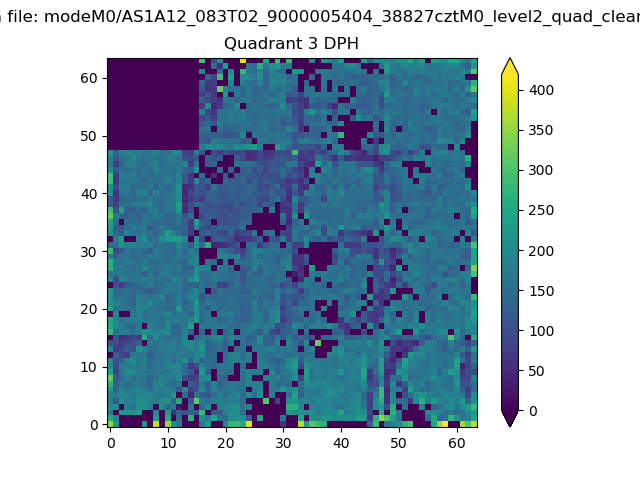 |
 |
Quadrant C |
| Plot type | Count rate plots | Images |
|---|---|---|
| Comparison with Poisson distribution Blue bars denote a histogram of data divided into 1 sec bins. Red curve is a Poisson curve with rate = median count rate of data. |
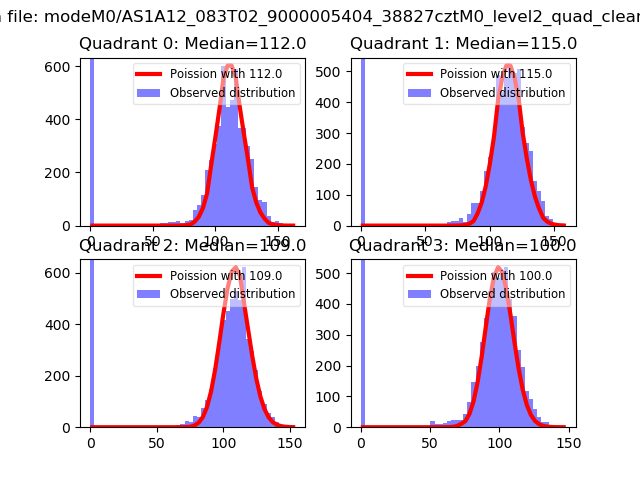 |
 |
| Quadrant-wise count rates Data is divided into 100 sec bins |
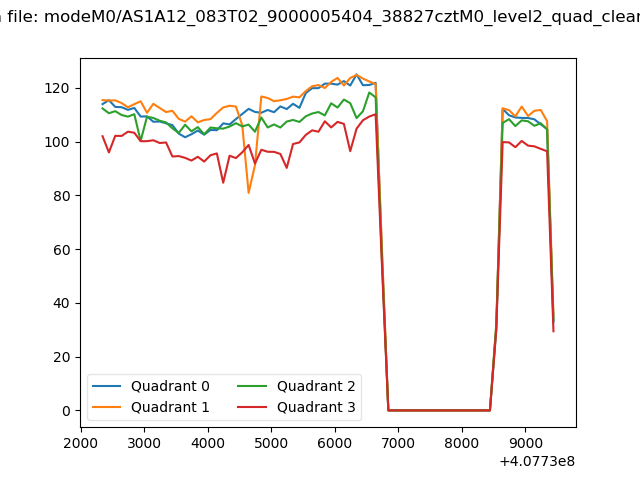 |
|
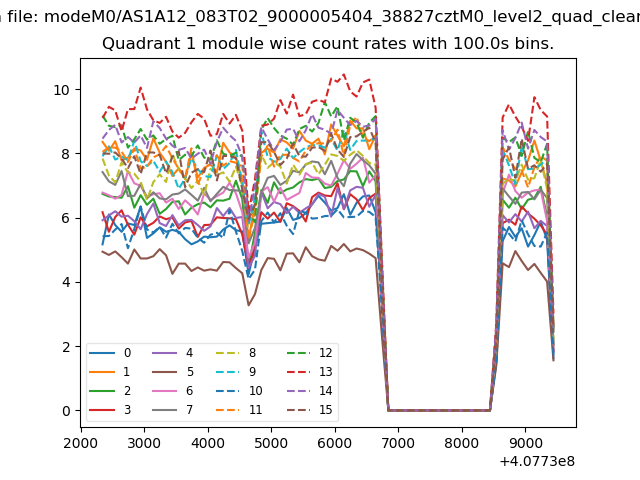
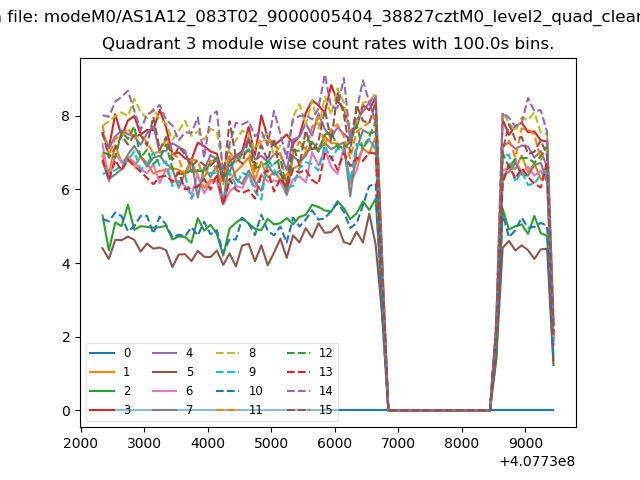
| Module-wise count rates for Quadrant A Data is divided into 100 sec bins |
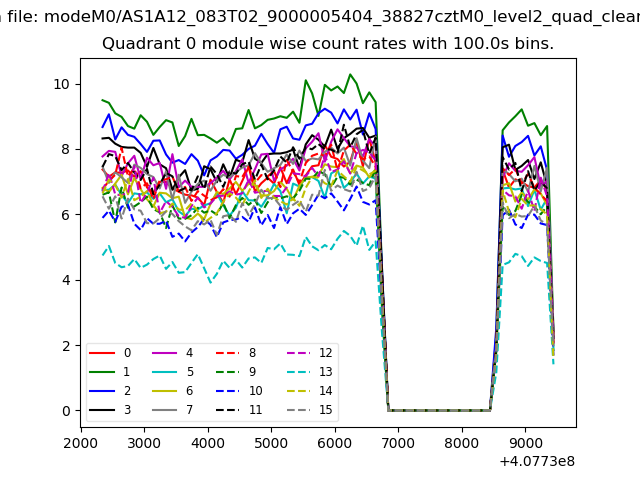 |
 |
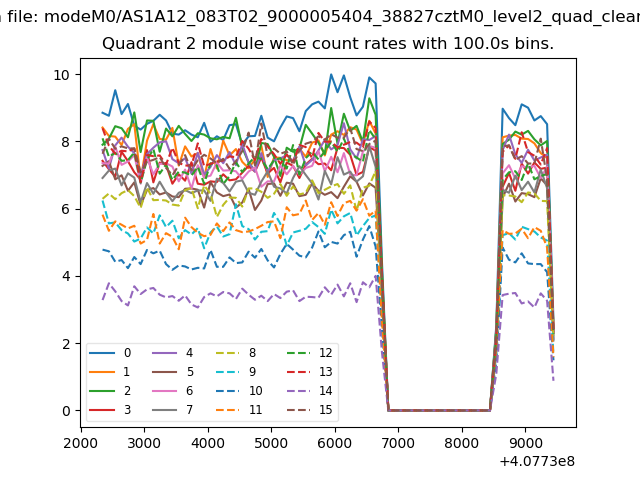
| Module-wise count rates for Quadrant B Data is divided into 100 sec bins |
 |
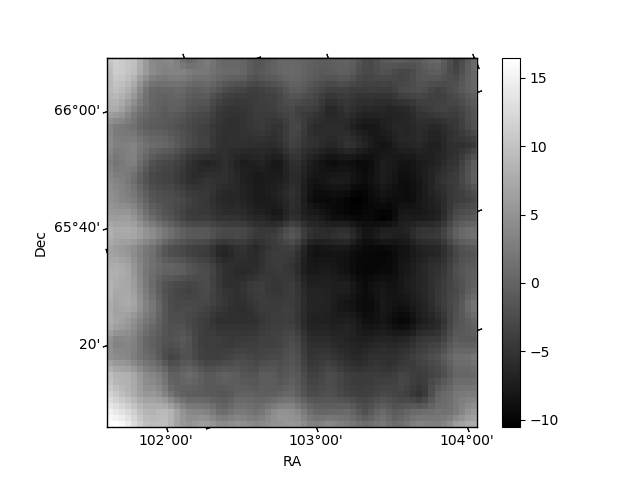 |
| Module-wise count rates for Quadrant C Data is divided into 100 sec bins |
 |
 |
| Module-wise count rates for Quadrant D Data is divided into 100 sec bins |
 |
 |
| Parameter | Plot |
|---|---|
| CZT HV Monitor | 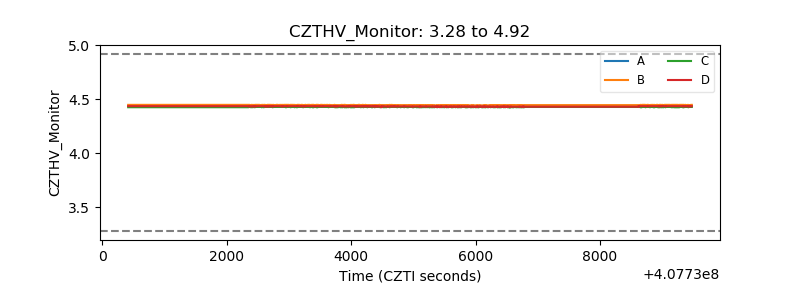 |
| D_VDD | 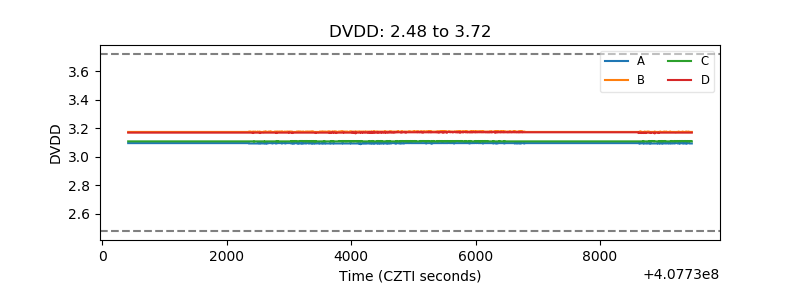 |
| Temperature 1 | 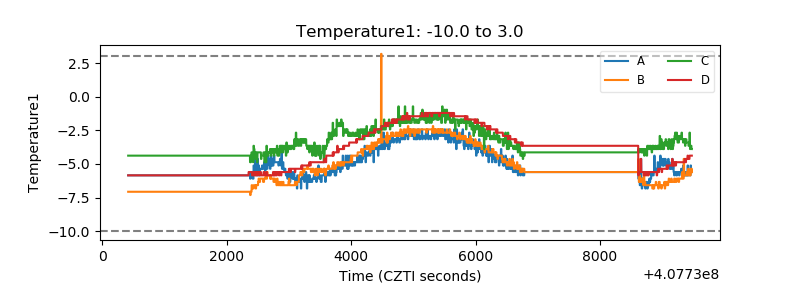 |
| Veto HV Monitor | 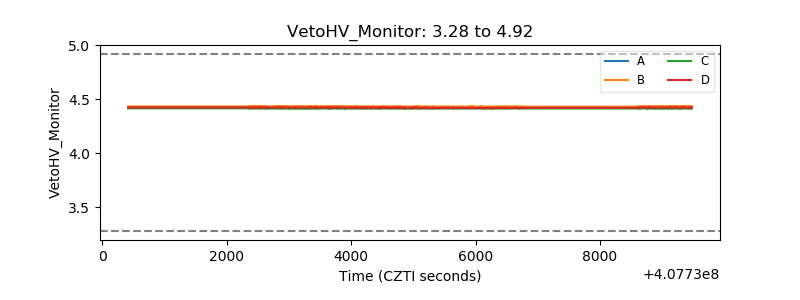 |
| Veto LLD | 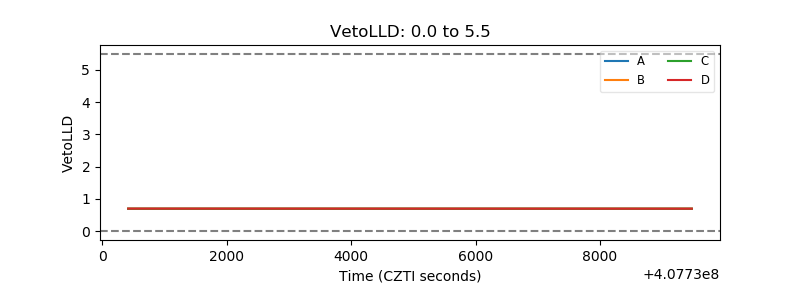 |
| Alpha Counter | 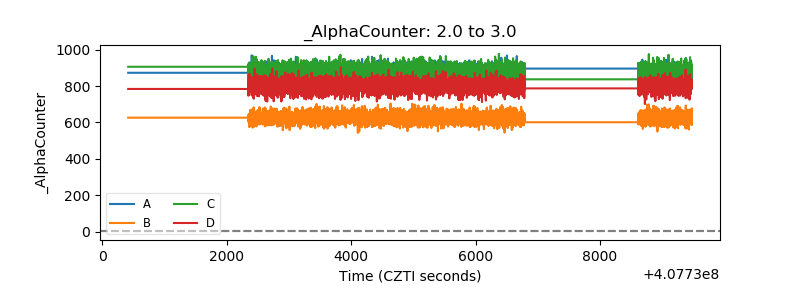 |
| _CPM_Rate | 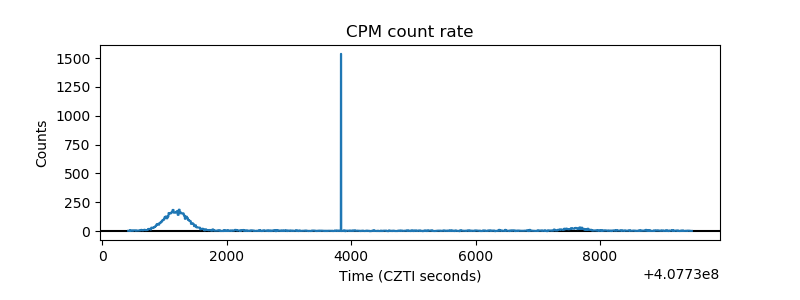 |
| CZT Counter | 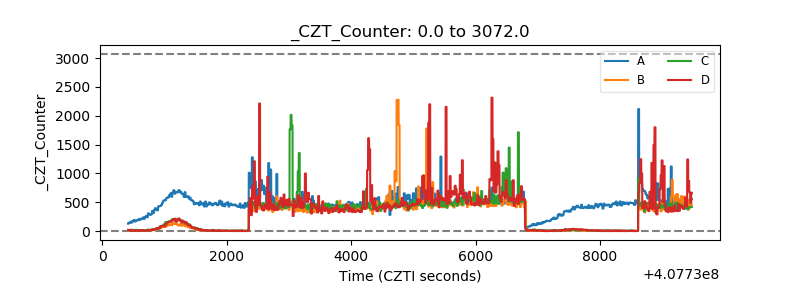 |
| +2.5 Volts monitor | 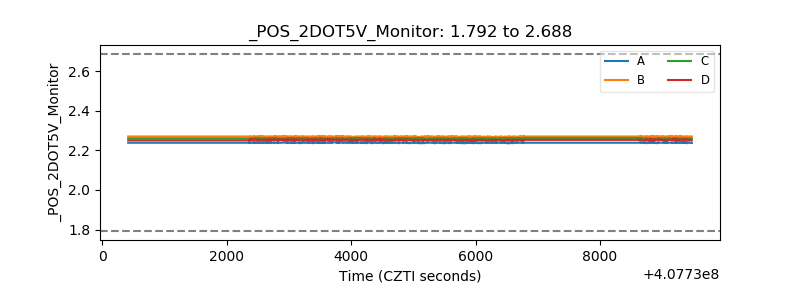 |
| +5 Volts monitor | 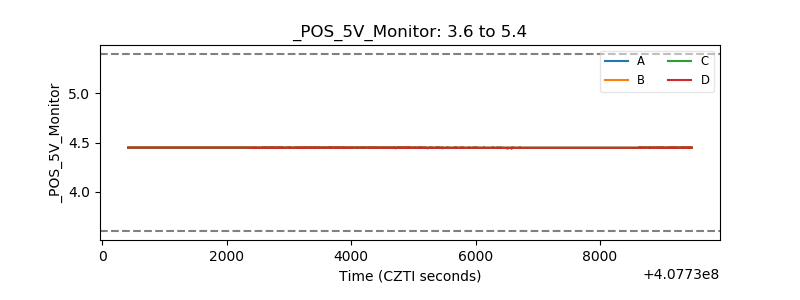 |
| _ROLL_ROT | 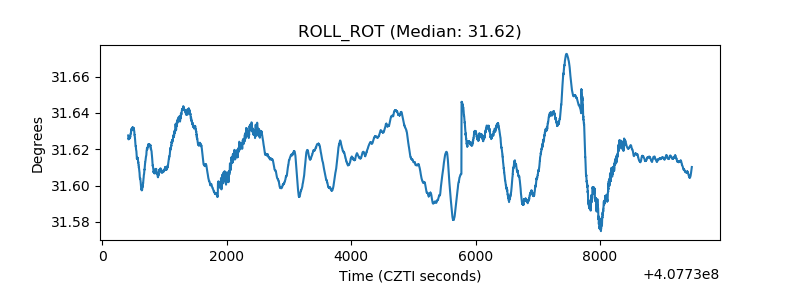 |
| _Roll_DEC | 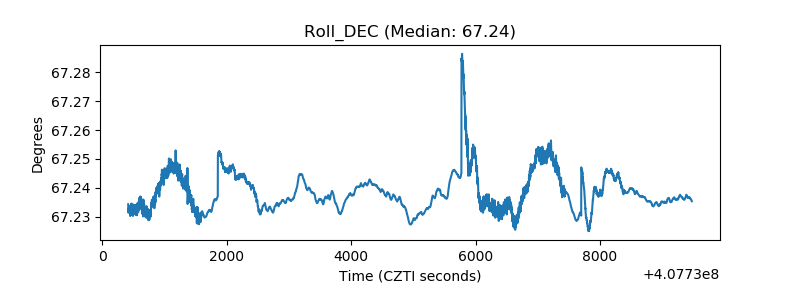 |
| _Roll_RA | 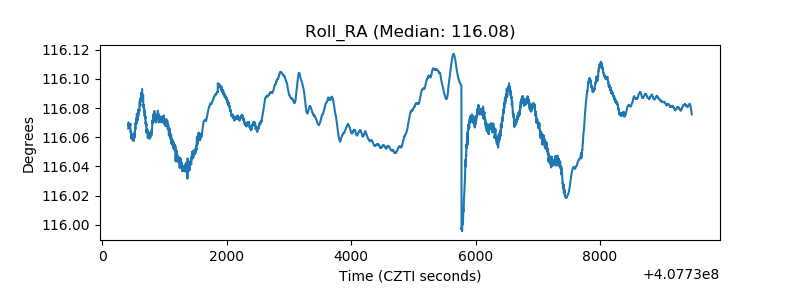 |
| Veto Counter | 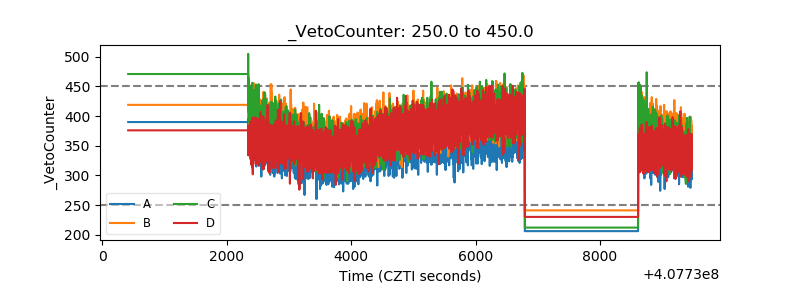 |