| Param | Original file | Final file |
|---|---|---|
| Filename | modeM0/AS1A12_083T02_9000005404_38828cztM0_level2.fits | modeM0/AS1A12_083T02_9000005404_38828cztM0_level2_quad_clean.evt |
| Size (bytes) | 401,322,240 | 90,835,200 |
| Size | 382.7 MB | 86.6 MB |
| Events in quadrant A | 3,270,717 | 619,018 |
| Events in quadrant B | 2,850,600 | 637,729 |
| Events in quadrant C | 2,591,298 | 603,231 |
| Events in quadrant D | 5,705,751 | 496,911 |
| Mode M0 | |||
|---|---|---|---|
| Quadrant | BADHDUFLAG | Total packets | Discarded packets |
| A | 0 | 13092 | 3 |
| B | 0 | 12498 | 2 |
| C | 0 | 11344 | 2 |
| D | 0 | 20973 | 2 |
| Mode SS | |||
|---|---|---|---|
| Quadrant | BADHDUFLAG | Total packets | Discarded packets |
| A | 0 | 116 | 0 |
| B | 0 | 116 | 0 |
| C | 0 | 116 | 0 |
| D | 0 | 116 | 0 |
| Mode M9 | |||
|---|---|---|---|
| Quadrant | BADHDUFLAG | Total packets | Discarded packets |
| A | 0 | 29 | 0 |
| B | 0 | 29 | 0 |
| C | 0 | 29 | 0 |
| D | 0 | 30 | 0 |
| Quadrant | Total seconds | Saturated seconds | Saturation percentage |
|---|---|---|---|
| A | 5621 | 71 | 1.263120% |
| B | 5621 | 31 | 0.551503% |
| C | 5621 | 3 | 0.053371% |
| D | 5621 | 789 | 14.036648% |
Noise dominated data is calculated using 1-second bins in cleaned event files. If a bin has >2000 counts, and if more than 50% of those come from <1% of pixels, then it is considered to be noise-dominated and hence unusable.
| Quadrant | # 1 sec bins | Bins with >0 counts | Bins with >2000 counts | High rate bins dominated by noise | Noise dominated (total time) | Noise dominated (detector-on time) | Marked lightcurve |
|---|---|---|---|---|---|---|---|
| A | 7113 | 5622 | 53 | 53 | 0.75% | 0.94% | 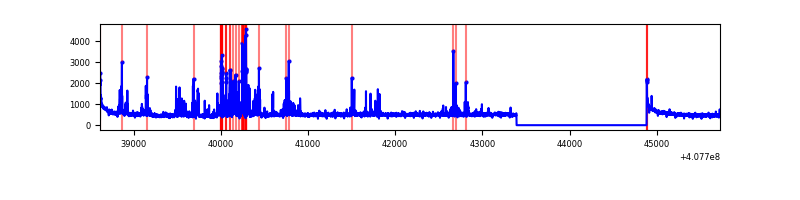 |
| B | 7113 | 5622 | 16 | 16 | 0.22% | 0.28% | 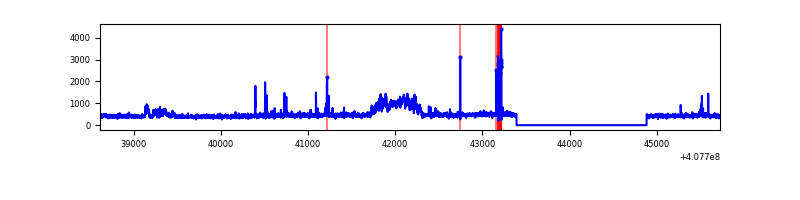 |
| C | 7113 | 5622 | 2 | 2 | 0.03% | 0.04% | 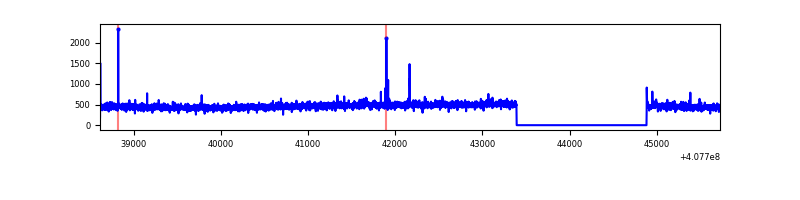 |
| D | 7113 | 5622 | 705 | 705 | 9.91% | 12.54% | 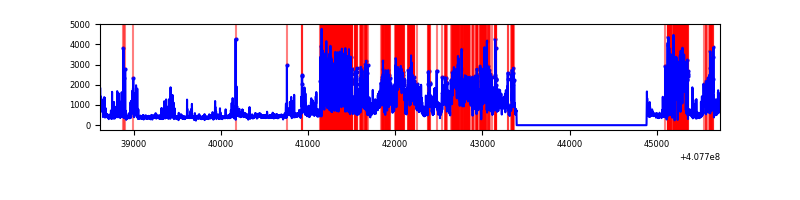 |
Top three noisy pixels from each quadrant. If the there are fewer than three noisy pixels in the level2.evt file, extra rows are filled as -1
| Pixel properties | Quadrant properties | ||||||
|---|---|---|---|---|---|---|---|
| Quadrant | DetID | PixID | Counts | Sigma | Mean | Median | Sigma |
| A | 13 | 248 | 473848 | 3841.92 | 609 | 597 | 123.2 |
| A | 10 | 83 | 423133 | 3430.21 | 609 | 597 | 123.2 |
| A | 13 | 254 | 10088 | 77.05 | 609 | 597 | 123.2 |
| B | 5 | 200 | 367522 | 3110.89 | 604 | 588 | 118.0 |
| B | 4 | 81 | 32739 | 272.58 | 604 | 588 | 118.0 |
| B | 5 | 172 | 22054 | 181.99 | 604 | 588 | 118.0 |
| C | 15 | 214 | 239813 | 1727.27 | 593 | 597 | 138.5 |
| C | 15 | 208 | 19921 | 139.53 | 593 | 597 | 138.5 |
| C | 2 | 16 | 5435 | 34.93 | 593 | 597 | 138.5 |
| D | 12 | 227 | 2020748 | 14656.8 | 563 | 545 | 137.8 |
| D | 5 | 222 | 507727 | 3679.66 | 563 | 545 | 137.8 |
| D | 2 | 249 | 472690 | 3425.46 | 563 | 545 | 137.8 |
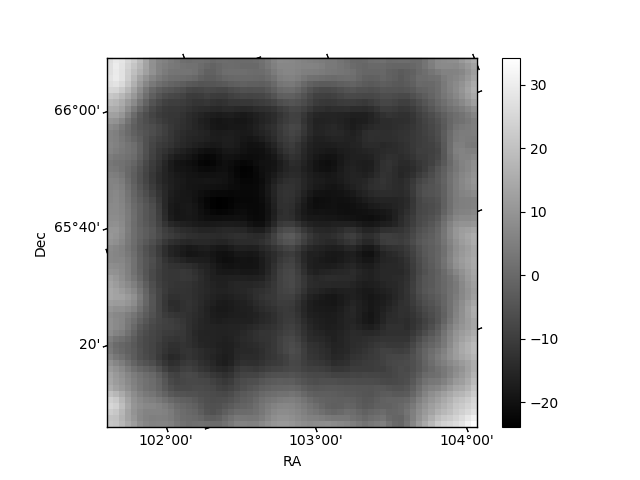
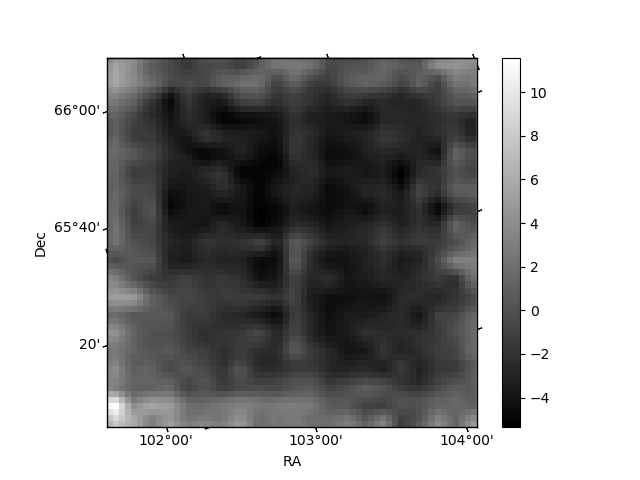
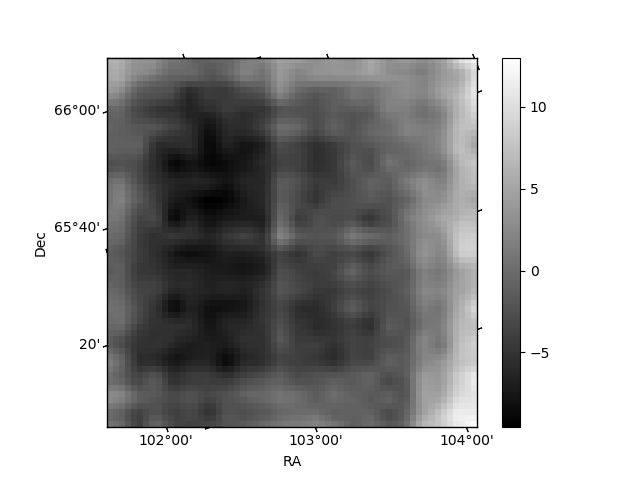
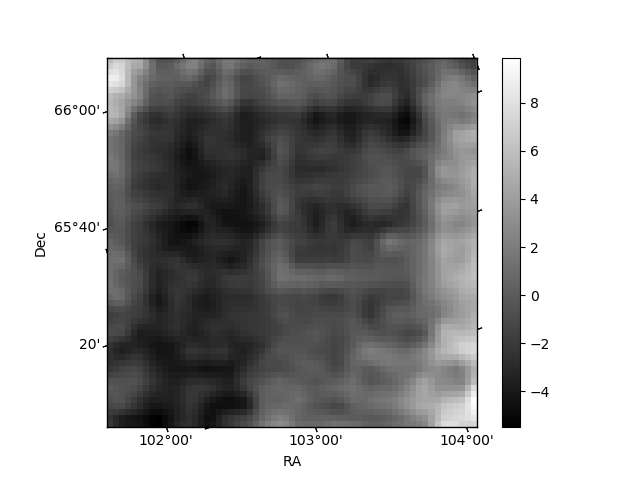
Histogram calculated using DETX and DETY for each event in the final _common_clean file
| Quadrant A | 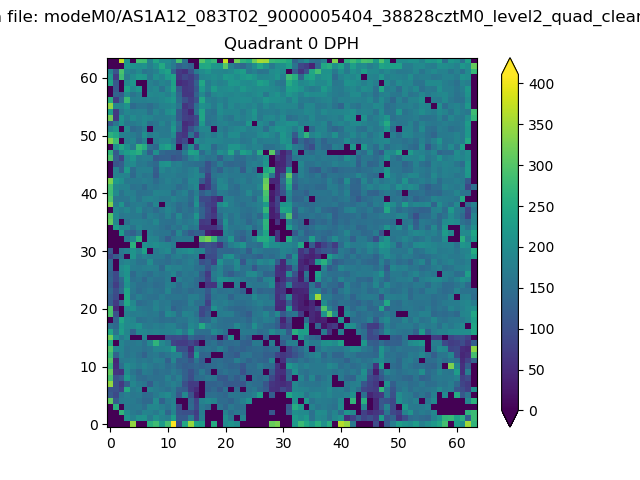 |
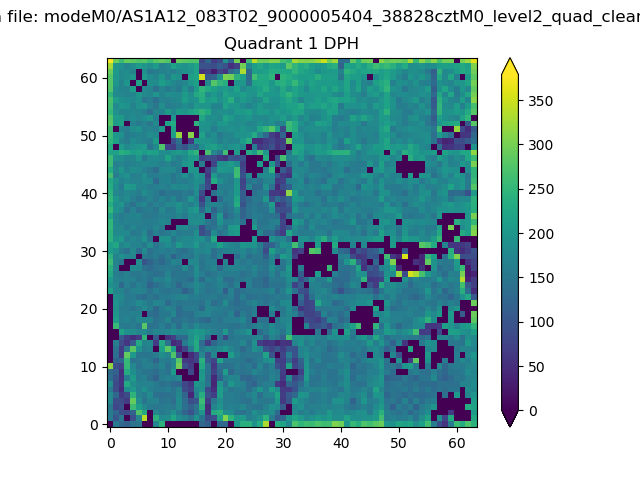 |
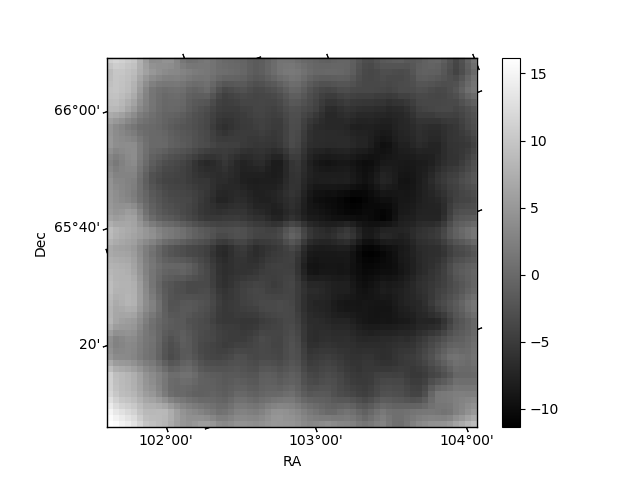
Quadrant B |
|---|---|---|---|
| Quadrant D | 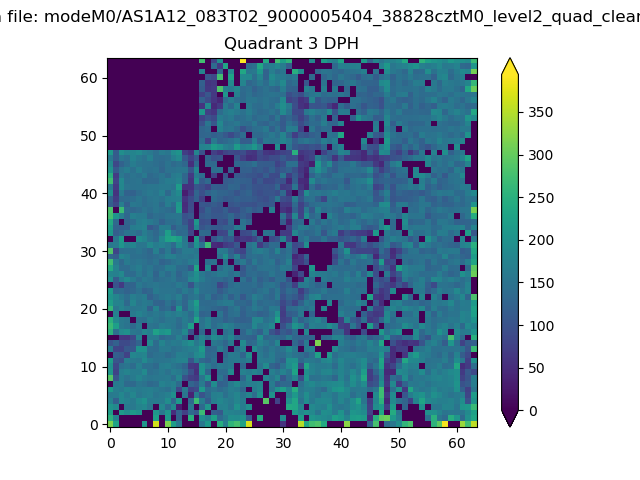 |
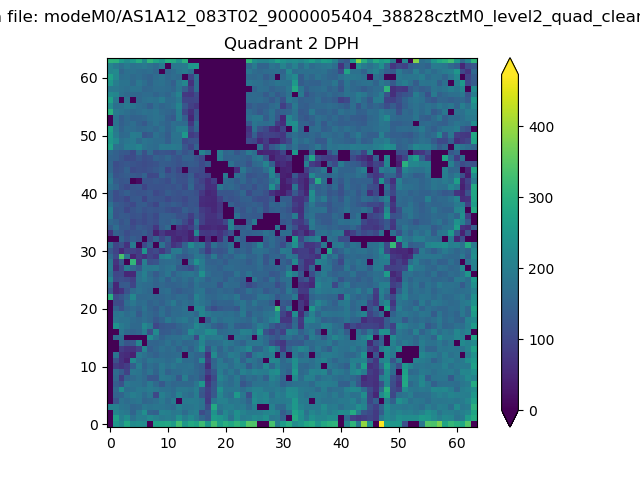 |
Quadrant C |
| Plot type | Count rate plots | Images |
|---|---|---|
| Comparison with Poisson distribution Blue bars denote a histogram of data divided into 1 sec bins. Red curve is a Poisson curve with rate = median count rate of data. |
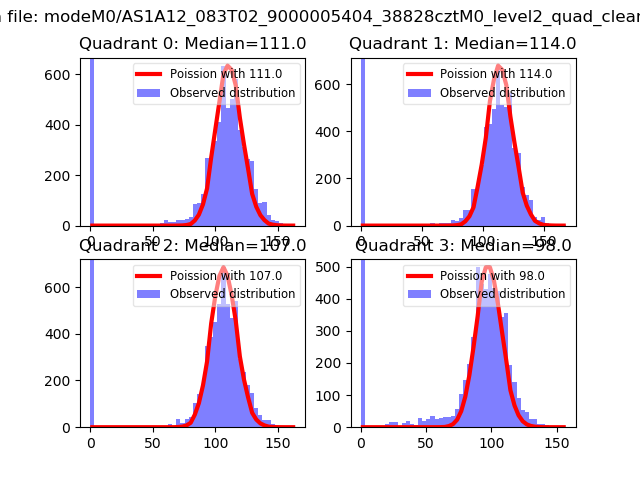 |
 |
| Quadrant-wise count rates Data is divided into 100 sec bins |
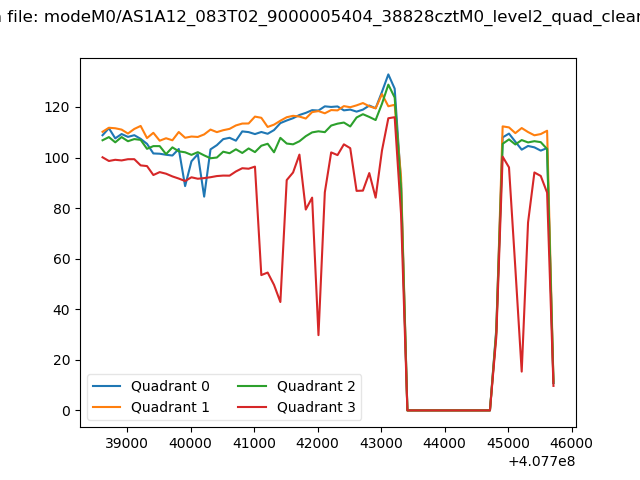 |
|
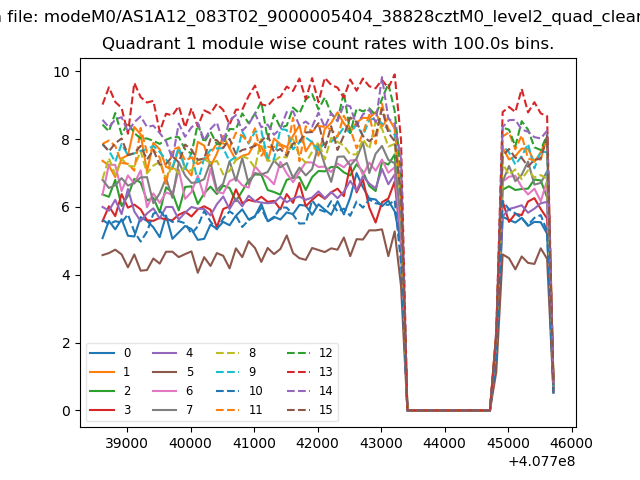
| Module-wise count rates for Quadrant A Data is divided into 100 sec bins |
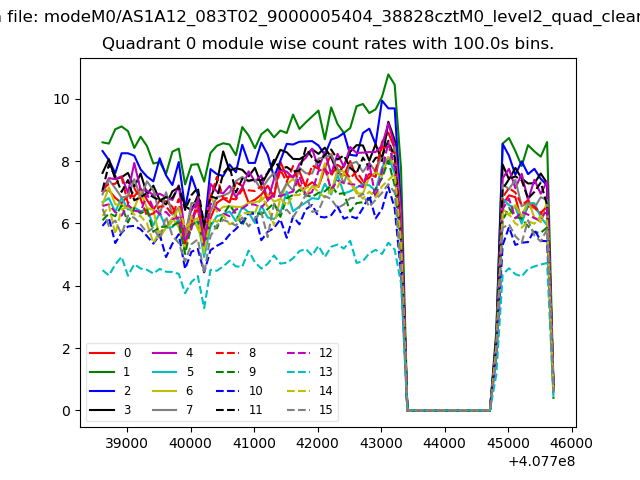 |
 |
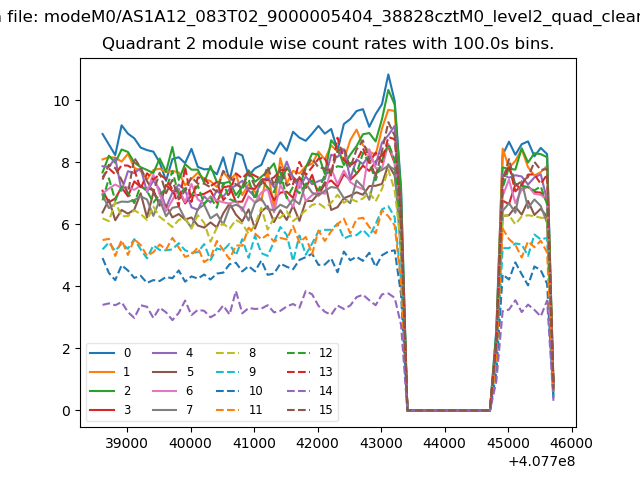
| Module-wise count rates for Quadrant B Data is divided into 100 sec bins |
 |
 |
| Module-wise count rates for Quadrant C Data is divided into 100 sec bins |
 |
 |
| Module-wise count rates for Quadrant D Data is divided into 100 sec bins |
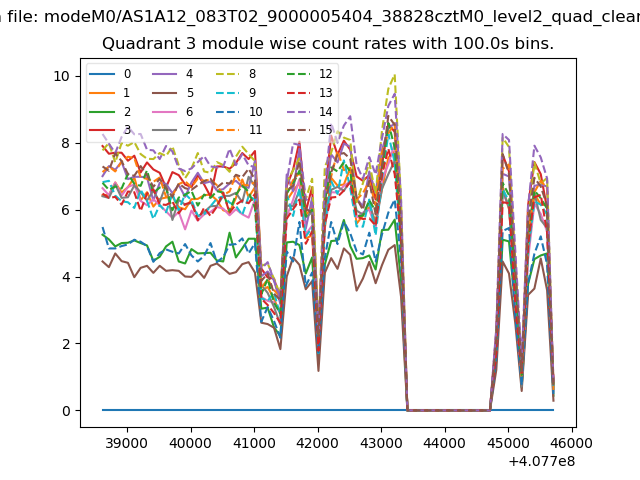 |
 |
| Parameter | Plot |
|---|---|
| CZT HV Monitor | 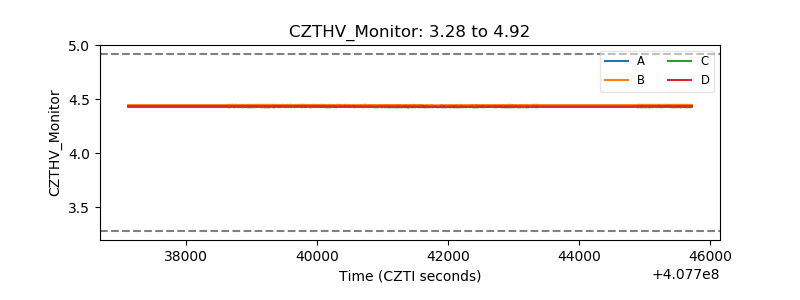 |
| D_VDD | 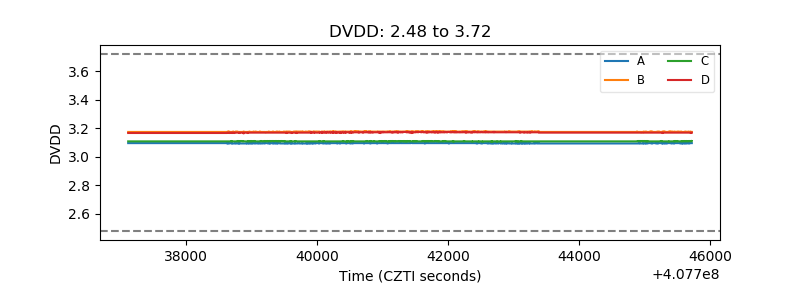 |
| Temperature 1 | 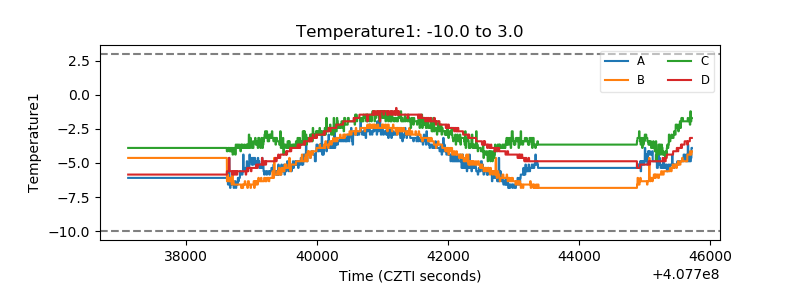 |
| Veto HV Monitor | 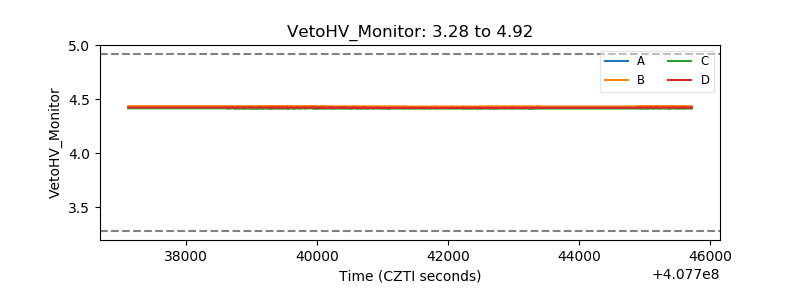 |
| Veto LLD | 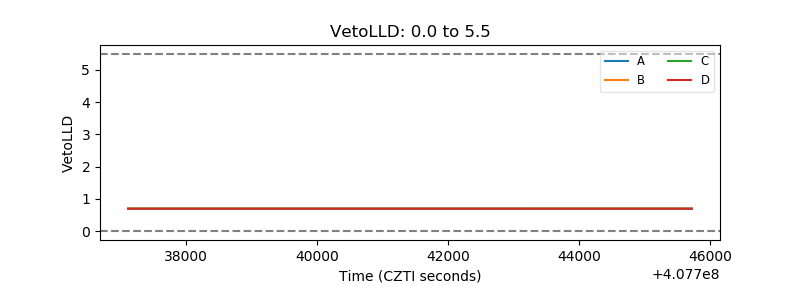 |
| Alpha Counter | 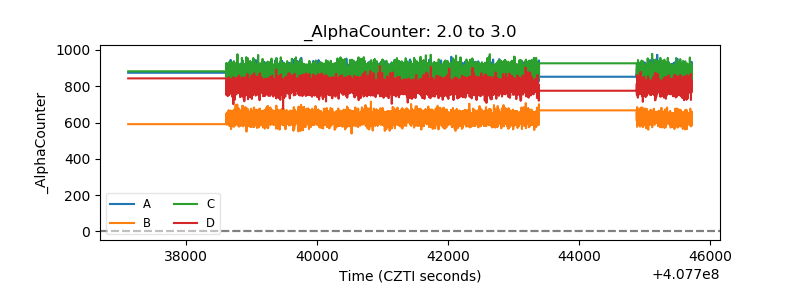 |
| _CPM_Rate | 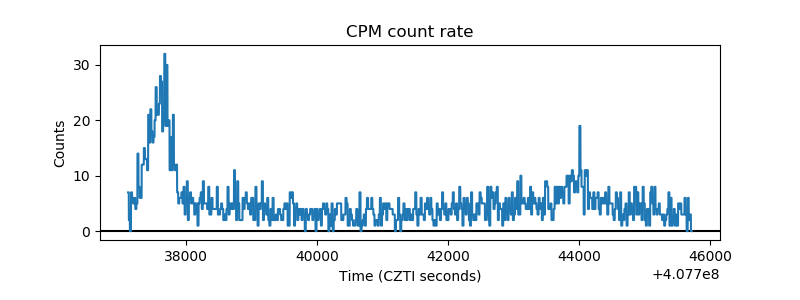 |
| CZT Counter | 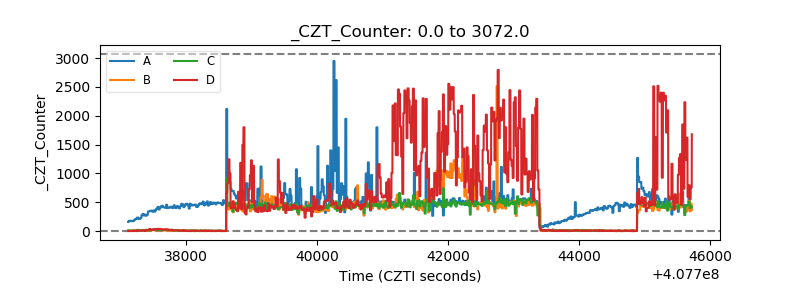 |
| +2.5 Volts monitor | 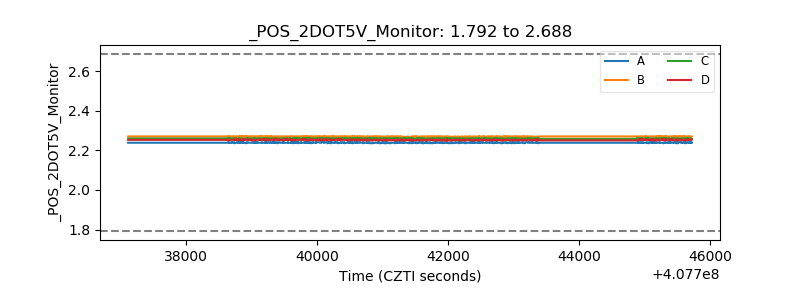 |
| +5 Volts monitor | 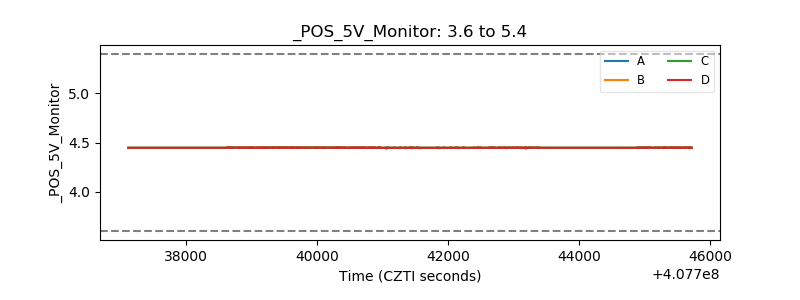 |
| _ROLL_ROT | 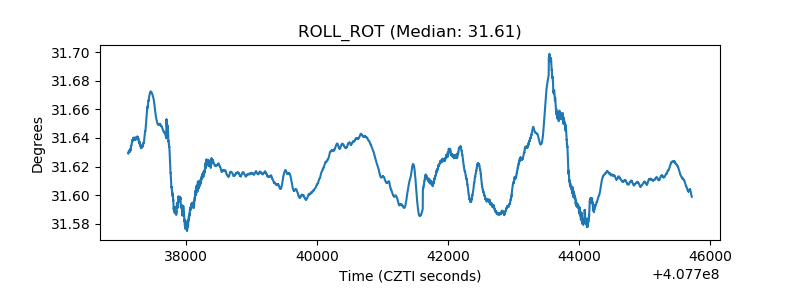 |
| _Roll_DEC | 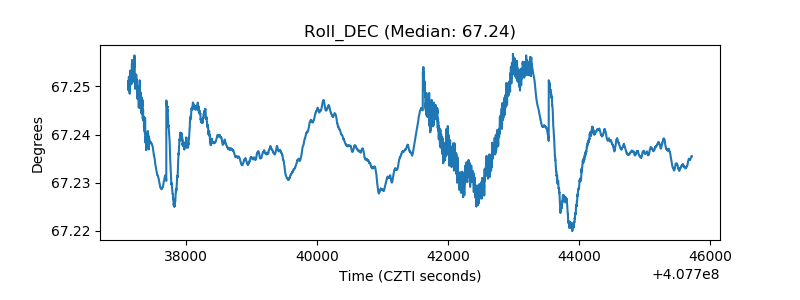 |
| _Roll_RA | 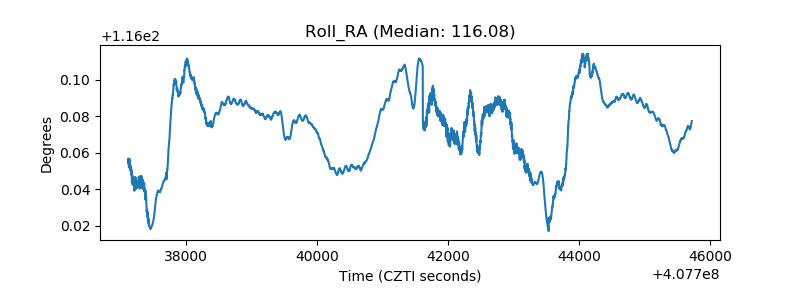 |
| Veto Counter | 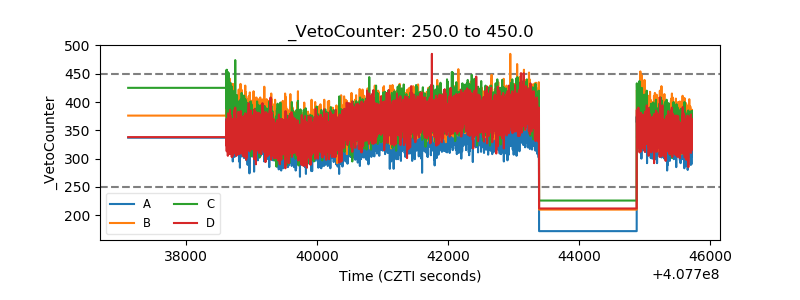 |