| Param | Original file | Final file |
|---|---|---|
| Filename | modeM0/AS1A12_083T02_9000005404_38829cztM0_level2.fits | modeM0/AS1A12_083T02_9000005404_38829cztM0_level2_quad_clean.evt |
| Size (bytes) | 443,422,080 | 89,628,480 |
| Size | 422.9 MB | 85.5 MB |
| Events in quadrant A | 3,424,009 | 622,923 |
| Events in quadrant B | 2,746,214 | 640,870 |
| Events in quadrant C | 3,013,532 | 605,370 |
| Events in quadrant D | 6,784,424 | 443,761 |
| Mode M0 | |||
|---|---|---|---|
| Quadrant | BADHDUFLAG | Total packets | Discarded packets |
| A | 0 | 13713 | 2 |
| B | 0 | 12176 | 1 |
| C | 0 | 12561 | 1 |
| D | 0 | 24025 | 1 |
| Mode SS | |||
|---|---|---|---|
| Quadrant | BADHDUFLAG | Total packets | Discarded packets |
| A | 0 | 116 | 0 |
| B | 0 | 116 | 0 |
| C | 0 | 116 | 0 |
| D | 0 | 116 | 0 |
| Mode M9 | |||
|---|---|---|---|
| Quadrant | BADHDUFLAG | Total packets | Discarded packets |
| A | 0 | 14 | 0 |
| B | 0 | 14 | 0 |
| C | 0 | 14 | 0 |
| D | 0 | 14 | 0 |
| Quadrant | Total seconds | Saturated seconds | Saturation percentage |
|---|---|---|---|
| A | 5733 | 93 | 1.622187% |
| B | 5733 | 43 | 0.750044% |
| C | 5733 | 74 | 1.290773% |
| D | 5733 | 1350 | 23.547881% |
Noise dominated data is calculated using 1-second bins in cleaned event files. If a bin has >2000 counts, and if more than 50% of those come from <1% of pixels, then it is considered to be noise-dominated and hence unusable.
| Quadrant | # 1 sec bins | Bins with >0 counts | Bins with >2000 counts | High rate bins dominated by noise | Noise dominated (total time) | Noise dominated (detector-on time) | Marked lightcurve |
|---|---|---|---|---|---|---|---|
| A | 7046 | 5734 | 74 | 74 | 1.05% | 1.29% | 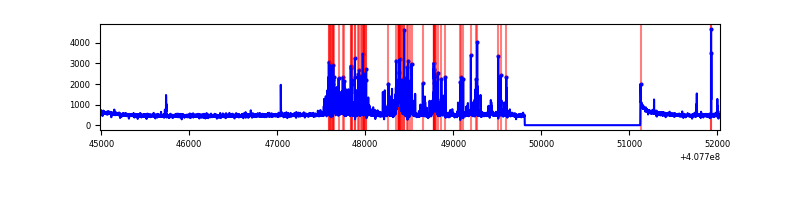 |
| B | 7046 | 5734 | 35 | 35 | 0.50% | 0.61% | 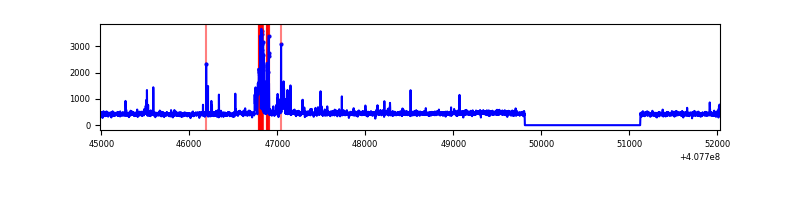 |
| C | 7046 | 5734 | 67 | 67 | 0.95% | 1.17% | 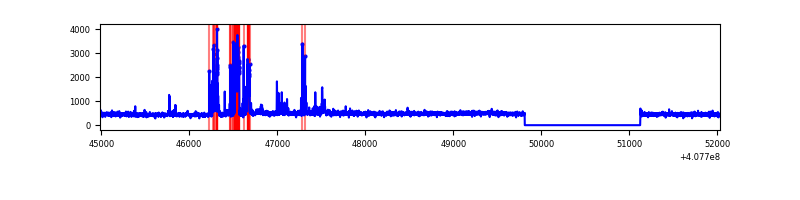 |
| D | 7046 | 5734 | 1238 | 1238 | 17.57% | 21.59% | 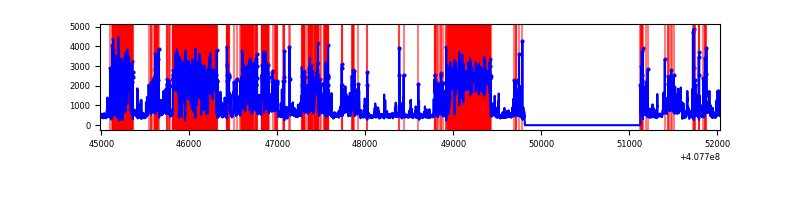 |
Top three noisy pixels from each quadrant. If the there are fewer than three noisy pixels in the level2.evt file, extra rows are filled as -1
| Pixel properties | Quadrant properties | ||||||
|---|---|---|---|---|---|---|---|
| Quadrant | DetID | PixID | Counts | Sigma | Mean | Median | Sigma |
| A | 13 | 248 | 591263 | 4694.46 | 623 | 610 | 125.8 |
| A | 10 | 83 | 391818 | 3109.29 | 623 | 610 | 125.8 |
| A | 13 | 254 | 11766 | 88.67 | 623 | 610 | 125.8 |
| B | 5 | 200 | 194216 | 1603.36 | 621 | 602 | 120.8 |
| B | 4 | 81 | 30461 | 247.27 | 621 | 602 | 120.8 |
| B | 0 | 230 | 24572 | 198.5 | 621 | 602 | 120.8 |
| C | 1 | 23 | 264108 | 1837.11 | 607 | 607 | 143.4 |
| C | 15 | 214 | 238411 | 1657.95 | 607 | 607 | 143.4 |
| C | 14 | 254 | 74039 | 511.96 | 607 | 607 | 143.4 |
| D | 12 | 227 | 2598355 | 19072.14 | 549 | 532 | 136.2 |
| D | 12 | 3 | 985264 | 7229.49 | 549 | 532 | 136.2 |
| D | 2 | 249 | 562258 | 4123.96 | 549 | 532 | 136.2 |
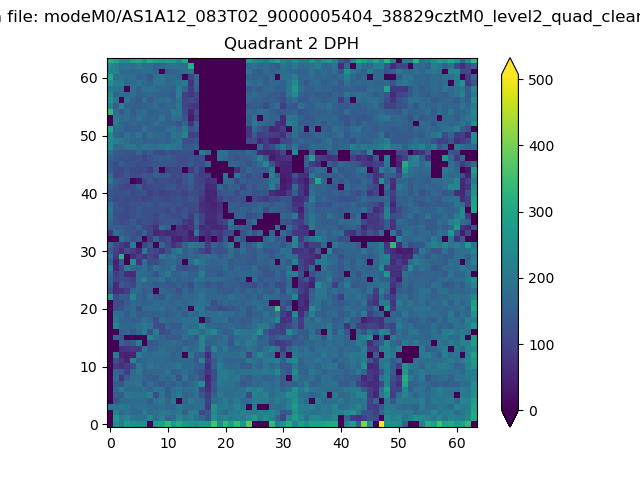
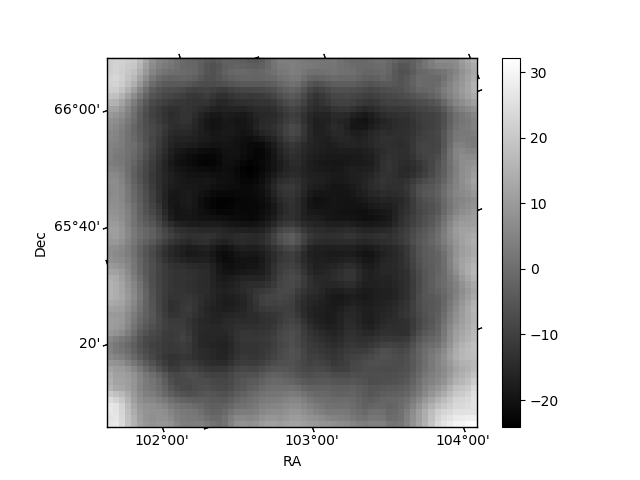
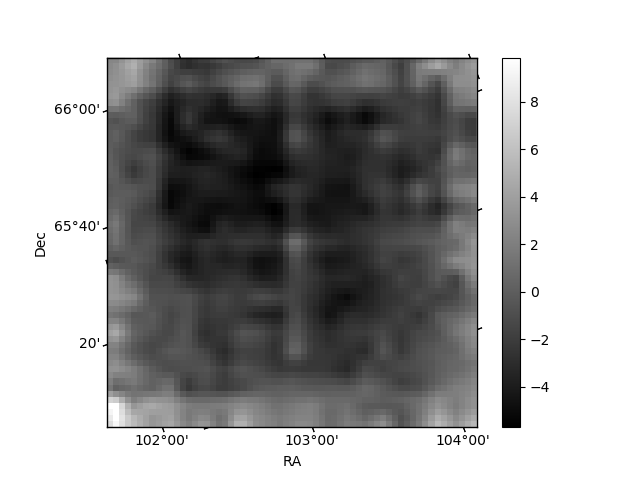
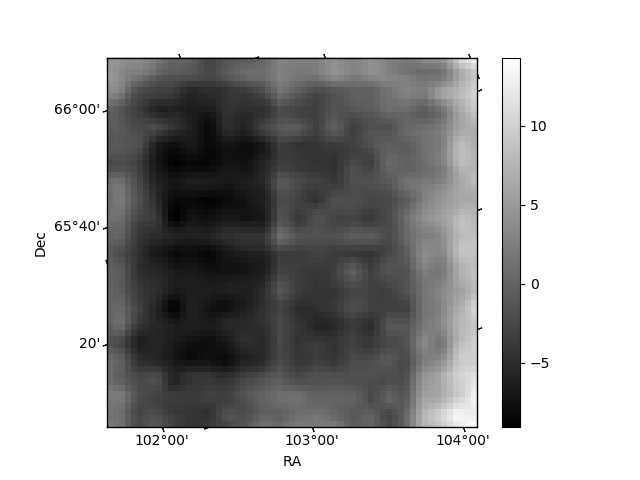
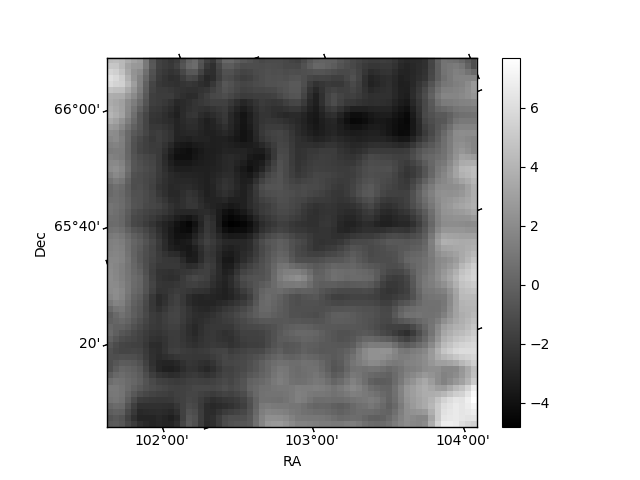
Histogram calculated using DETX and DETY for each event in the final _common_clean file
| Quadrant A | 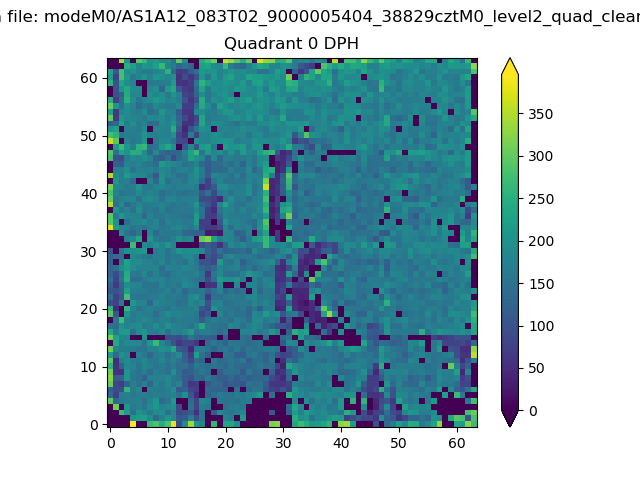 |
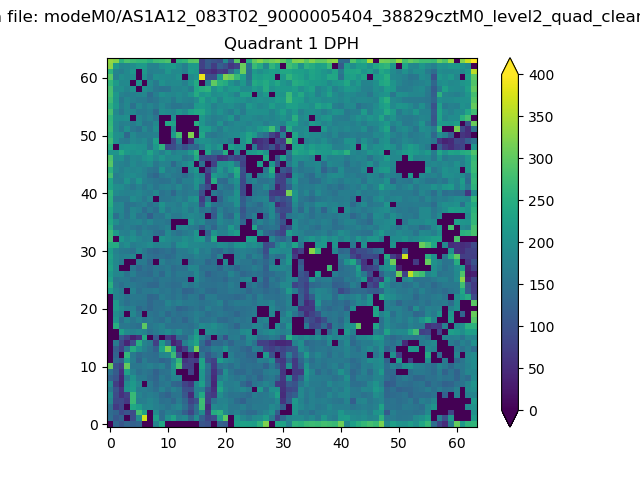 |
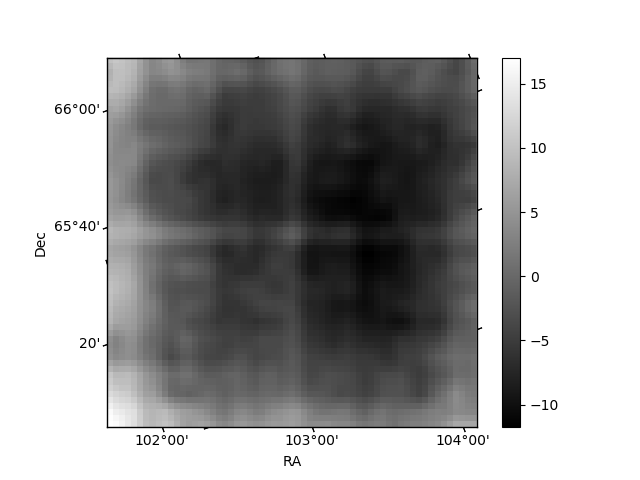
Quadrant B |
|---|---|---|---|
| Quadrant D | 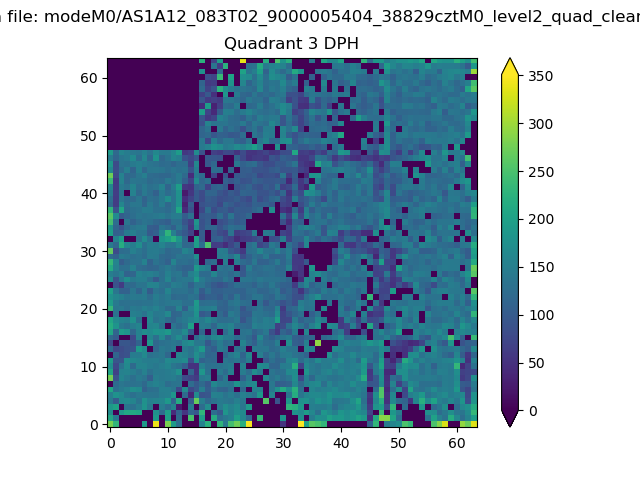 |
 |
Quadrant C |
| Plot type | Count rate plots | Images |
|---|---|---|
| Comparison with Poisson distribution Blue bars denote a histogram of data divided into 1 sec bins. Red curve is a Poisson curve with rate = median count rate of data. |
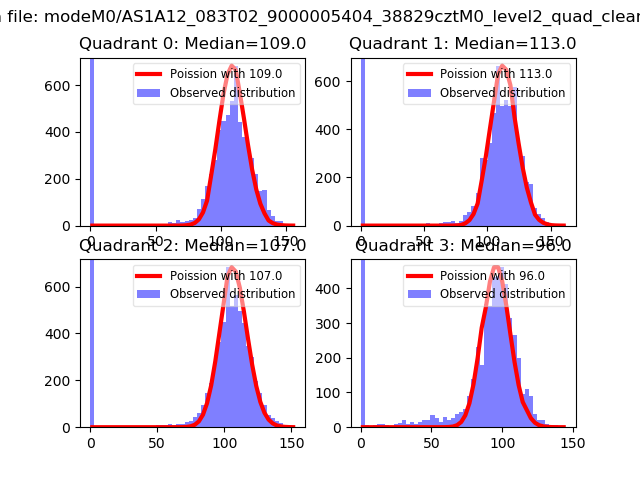 |
 |
| Quadrant-wise count rates Data is divided into 100 sec bins |
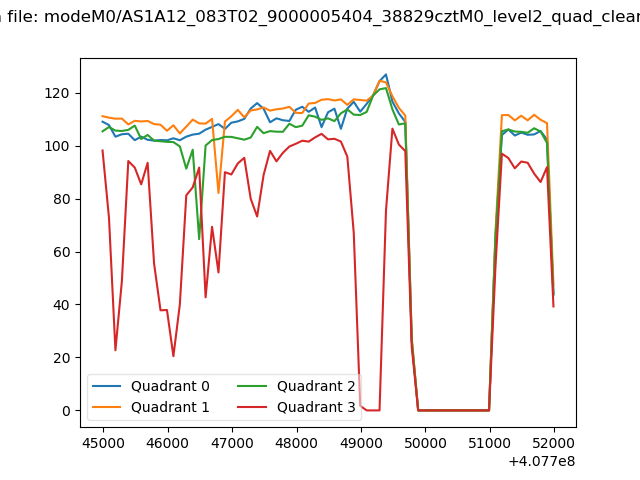 |
|
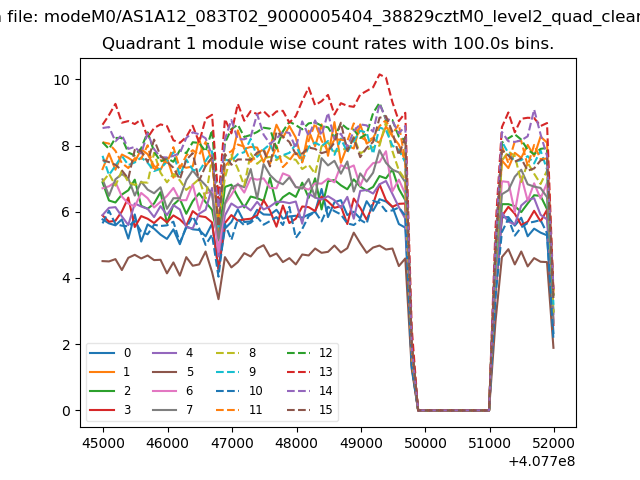
| Module-wise count rates for Quadrant A Data is divided into 100 sec bins |
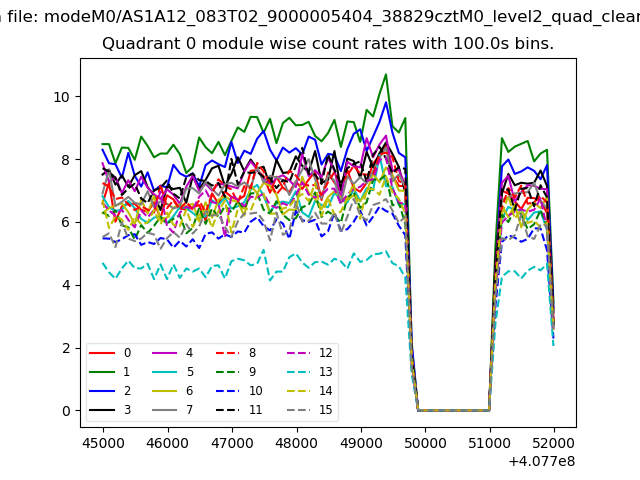 |
 |
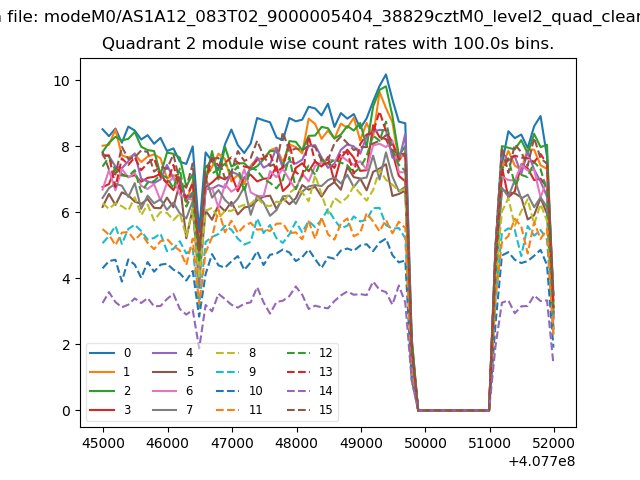
| Module-wise count rates for Quadrant B Data is divided into 100 sec bins |
 |
 |
| Module-wise count rates for Quadrant C Data is divided into 100 sec bins |
 |
 |
| Module-wise count rates for Quadrant D Data is divided into 100 sec bins |
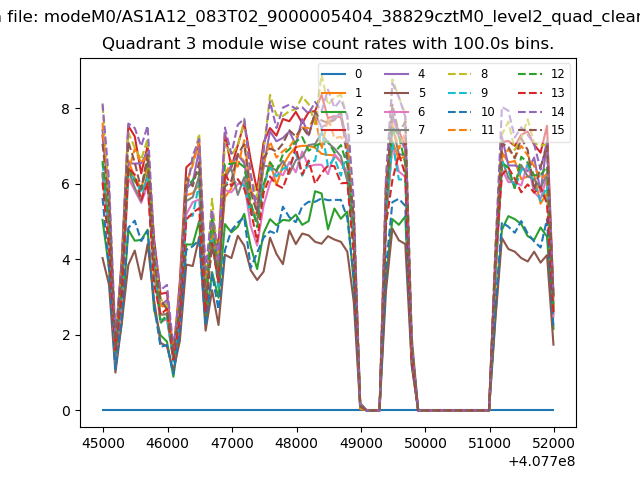 |
 |
| Parameter | Plot |
|---|---|
| CZT HV Monitor | 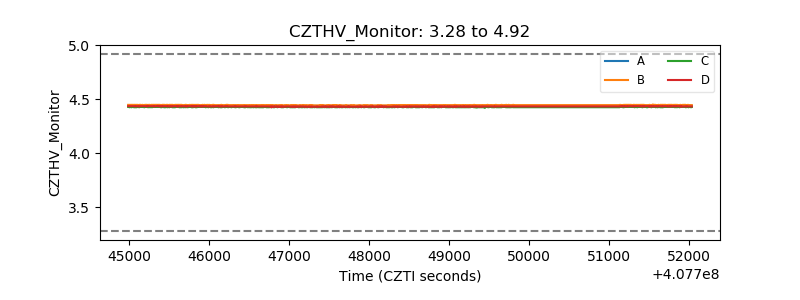 |
| D_VDD | 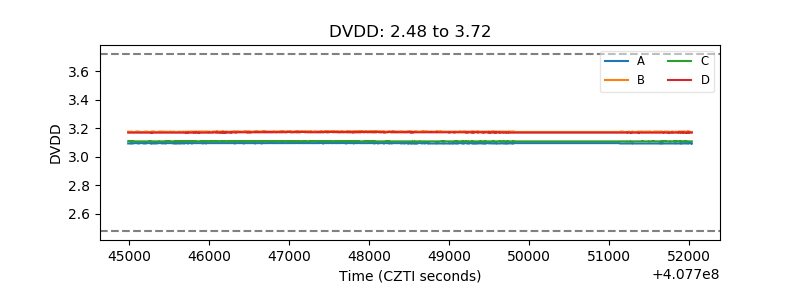 |
| Temperature 1 | 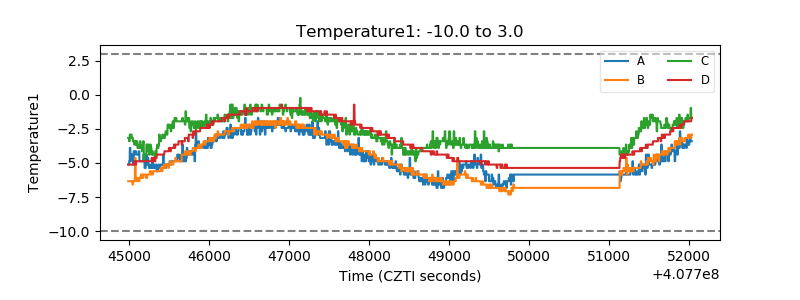 |
| Veto HV Monitor | 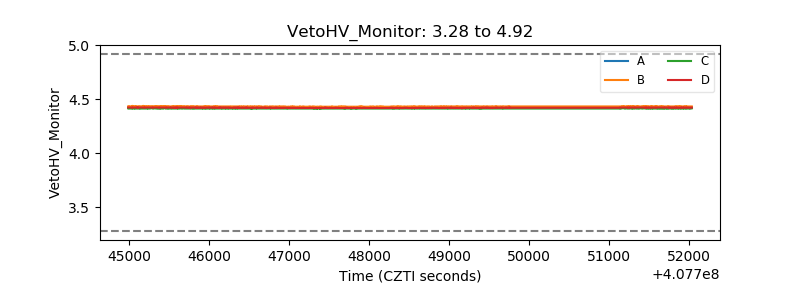 |
| Veto LLD | 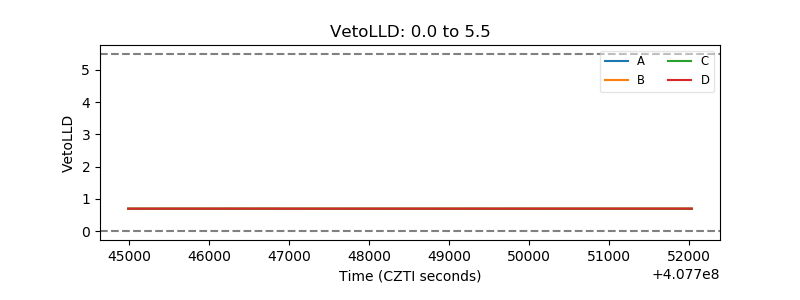 |
| Alpha Counter | 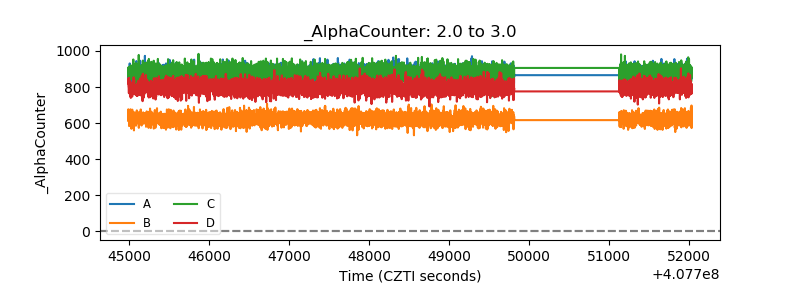 |
| _CPM_Rate | 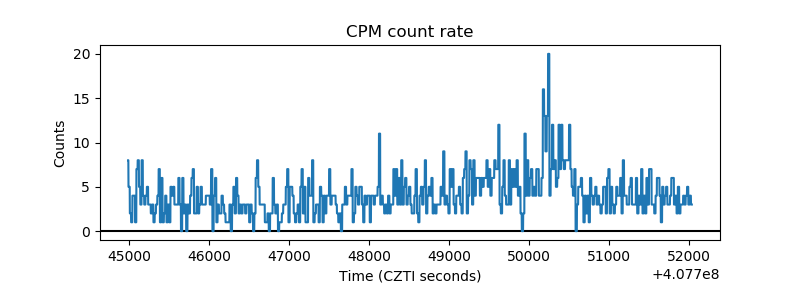 |
| CZT Counter | 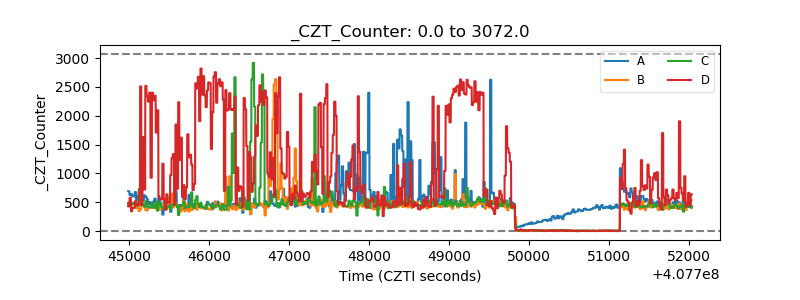 |
| +2.5 Volts monitor |  |
| +5 Volts monitor | 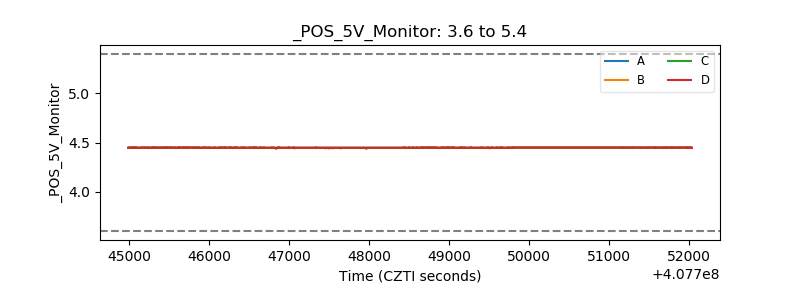 |
| _ROLL_ROT | 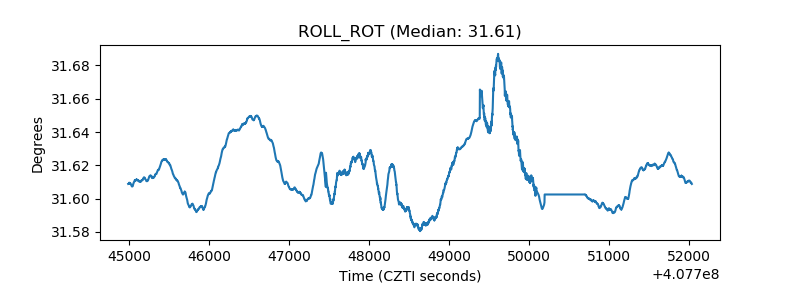 |
| _Roll_DEC | 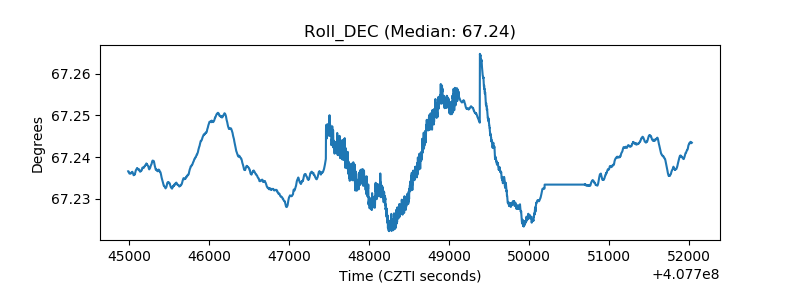 |
| _Roll_RA | 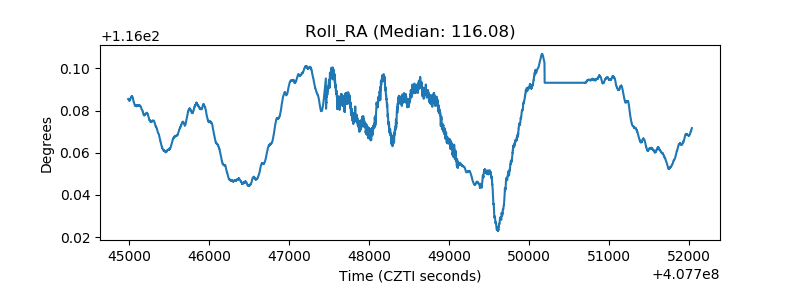 |
| Veto Counter | 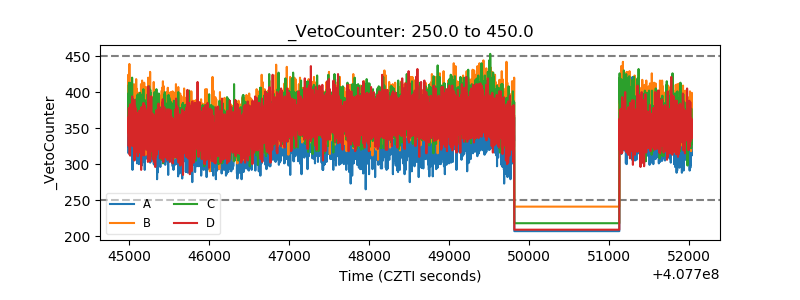 |