| Param | Original file | Final file |
|---|---|---|
| Filename | modeM0/AS1A12_083T02_9000005404_38830cztM0_level2.fits | modeM0/AS1A12_083T02_9000005404_38830cztM0_level2_quad_clean.evt |
| Size (bytes) | 213,926,400 | 55,514,880 |
| Size | 204.0 MB | 52.9 MB |
| Events in quadrant A | 1,801,686 | 375,269 |
| Events in quadrant B | 1,622,081 | 381,419 |
| Events in quadrant C | 1,586,086 | 358,941 |
| Events in quadrant D | 2,638,739 | 321,107 |
| Mode M0 | |||
|---|---|---|---|
| Quadrant | BADHDUFLAG | Total packets | Discarded packets |
| A | 0 | 7430 | 1 |
| B | 0 | 7281 | 1 |
| C | 0 | 6942 | 1 |
| D | 0 | 10139 | 1 |
| Mode SS | |||
|---|---|---|---|
| Quadrant | BADHDUFLAG | Total packets | Discarded packets |
| A | 0 | 68 | 0 |
| B | 0 | 68 | 0 |
| C | 0 | 68 | 0 |
| D | 0 | 68 | 0 |
| Mode M9 | |||
|---|---|---|---|
| Quadrant | BADHDUFLAG | Total packets | Discarded packets |
| A | 0 | 4 | 0 |
| B | 0 | 4 | 0 |
| C | 0 | 4 | 0 |
| D | 0 | 5 | 0 |
| Quadrant | Total seconds | Saturated seconds | Saturation percentage |
|---|---|---|---|
| A | 3449 | 9 | 0.260945% |
| B | 3449 | 41 | 1.188750% |
| C | 3449 | 3 | 0.086982% |
| D | 3449 | 171 | 4.957959% |
Noise dominated data is calculated using 1-second bins in cleaned event files. If a bin has >2000 counts, and if more than 50% of those come from <1% of pixels, then it is considered to be noise-dominated and hence unusable.
| Quadrant | # 1 sec bins | Bins with >0 counts | Bins with >2000 counts | High rate bins dominated by noise | Noise dominated (total time) | Noise dominated (detector-on time) | Marked lightcurve |
|---|---|---|---|---|---|---|---|
| A | 3449 | 3449 | 3 | 3 | 0.09% | 0.09% | 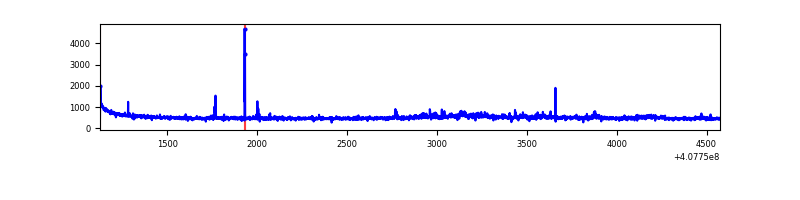 |
| B | 3449 | 3449 | 25 | 25 | 0.72% | 0.72% | 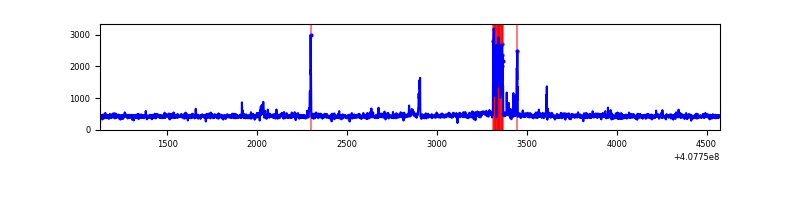 |
| C | 3449 | 3449 | 0 | 0 | 0.00% | 0.00% | 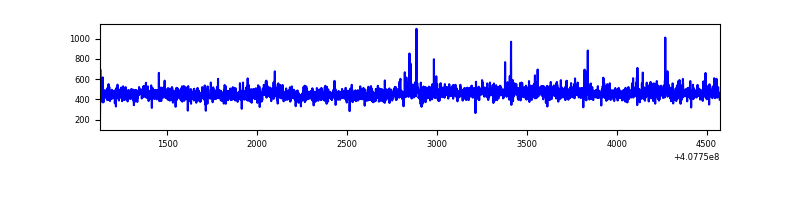 |
| D | 3449 | 3449 | 138 | 138 | 4.00% | 4.00% | 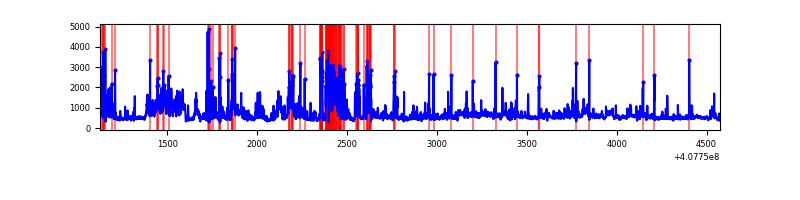 |
Top three noisy pixels from each quadrant. If the there are fewer than three noisy pixels in the level2.evt file, extra rows are filled as -1
| Pixel properties | Quadrant properties | ||||||
|---|---|---|---|---|---|---|---|
| Quadrant | DetID | PixID | Counts | Sigma | Mean | Median | Sigma |
| A | 10 | 83 | 242743 | 3140.46 | 373 | 365 | 77.2 |
| A | 6 | 10 | 66112 | 851.87 | 373 | 365 | 77.2 |
| A | 13 | 248 | 28915 | 369.92 | 373 | 365 | 77.2 |
| B | 15 | 85 | 105356 | 1447.21 | 368 | 357 | 72.6 |
| B | 0 | 230 | 26249 | 356.87 | 368 | 357 | 72.6 |
| B | 5 | 200 | 17887 | 241.62 | 368 | 357 | 72.6 |
| C | 15 | 214 | 144098 | 1668.83 | 362 | 363 | 86.1 |
| C | 15 | 208 | 17227 | 195.8 | 362 | 363 | 86.1 |
| C | 3 | 233 | 8734 | 97.19 | 362 | 363 | 86.1 |
| D | 12 | 227 | 668544 | 7467.64 | 357 | 346 | 89.5 |
| D | 12 | 235 | 133747 | 1490.86 | 357 | 346 | 89.5 |
| D | 2 | 249 | 123334 | 1374.49 | 357 | 346 | 89.5 |
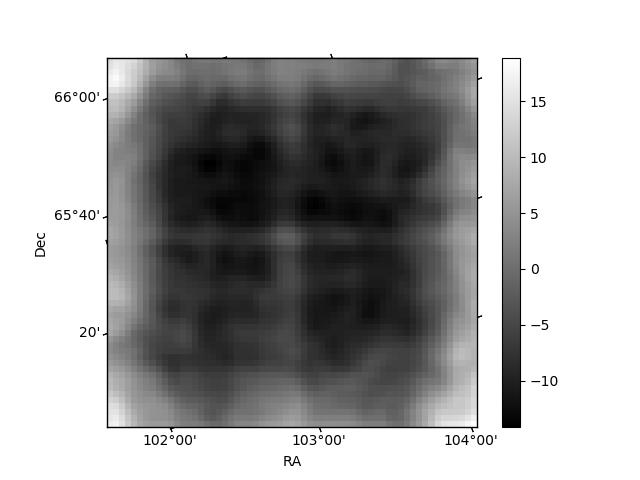
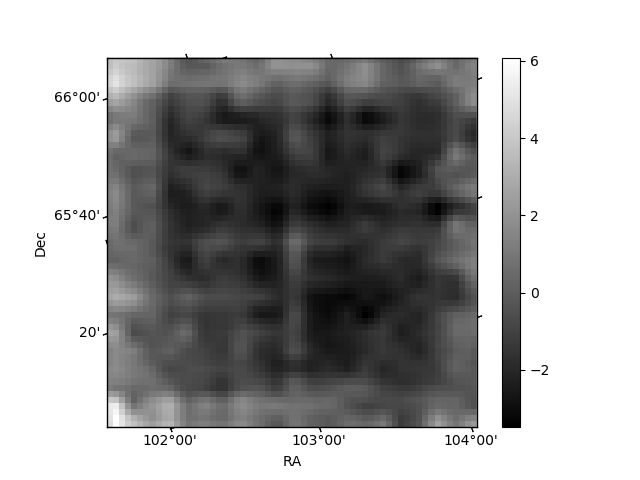
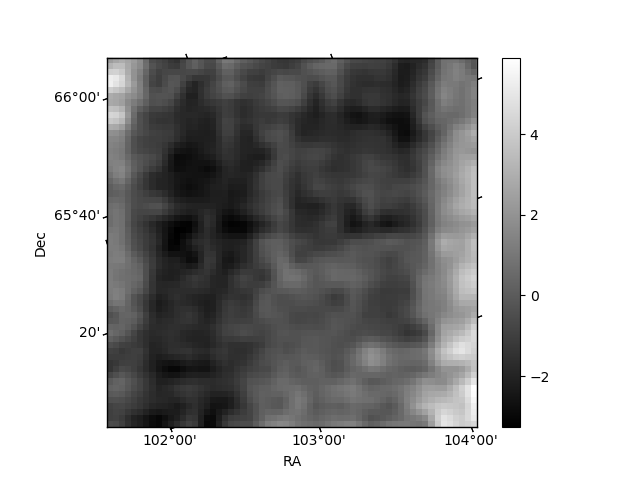
Histogram calculated using DETX and DETY for each event in the final _common_clean file
| Quadrant A | 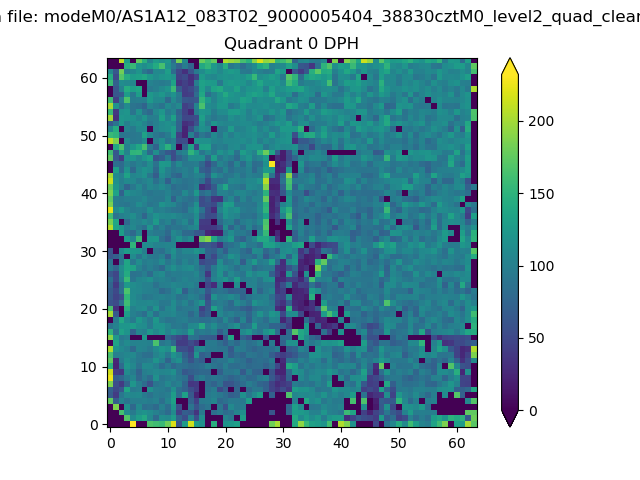 |
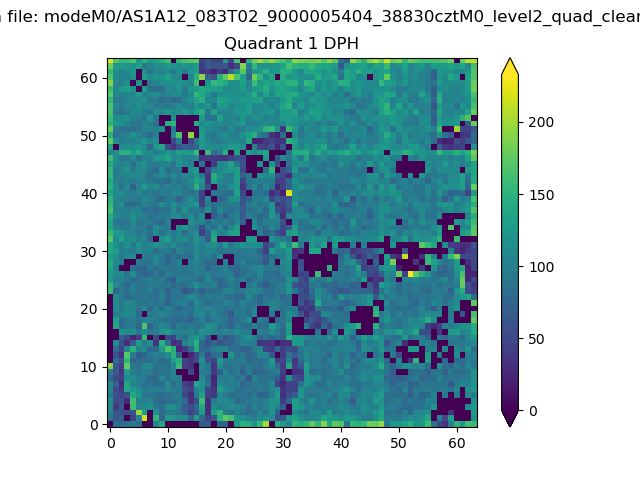 |
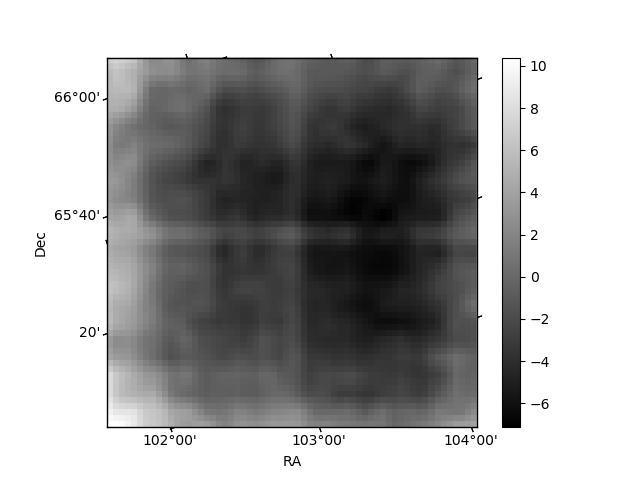
Quadrant B |
|---|---|---|---|
| Quadrant D | 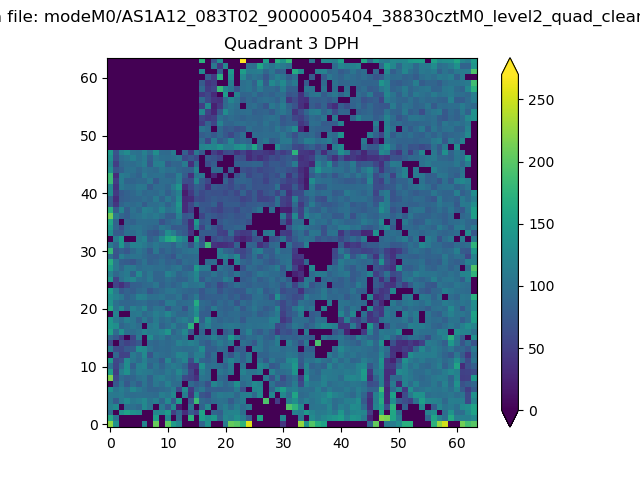 |
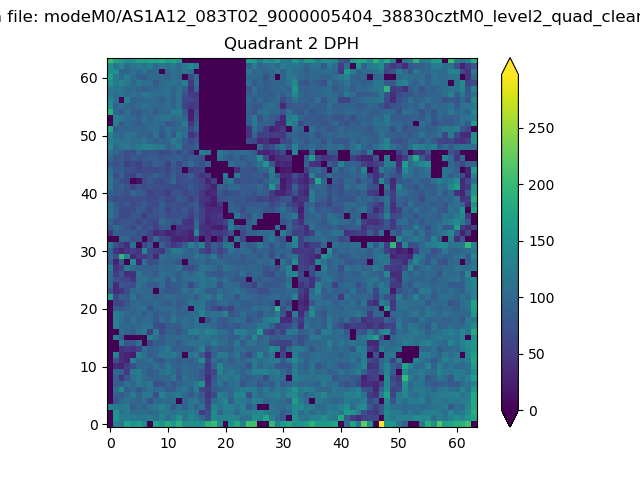 |
Quadrant C |
| Plot type | Count rate plots | Images |
|---|---|---|
| Comparison with Poisson distribution Blue bars denote a histogram of data divided into 1 sec bins. Red curve is a Poisson curve with rate = median count rate of data. |
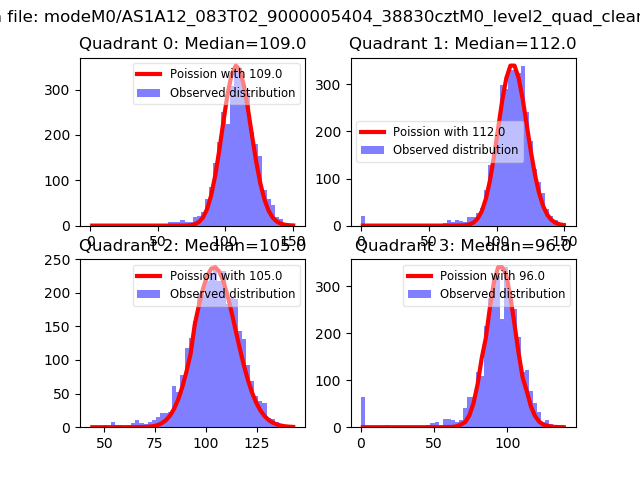 |
 |
| Quadrant-wise count rates Data is divided into 100 sec bins |
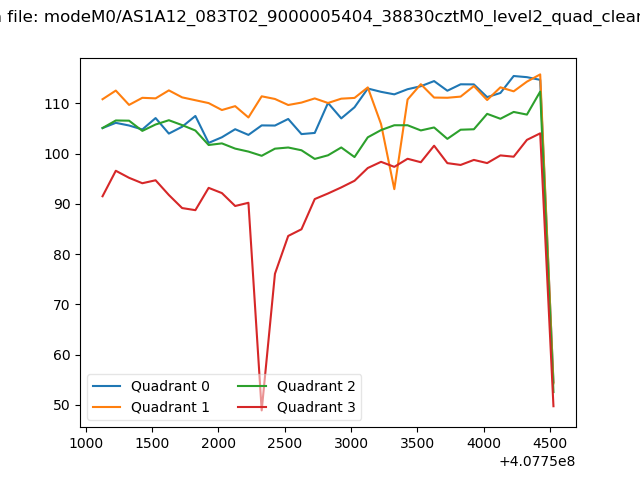 |
|
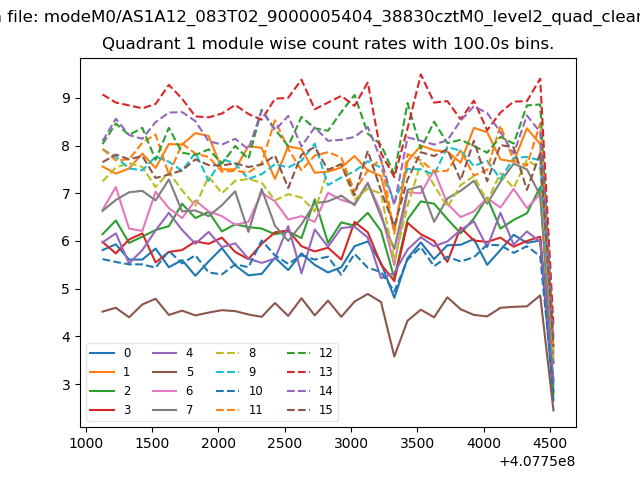
| Module-wise count rates for Quadrant A Data is divided into 100 sec bins |
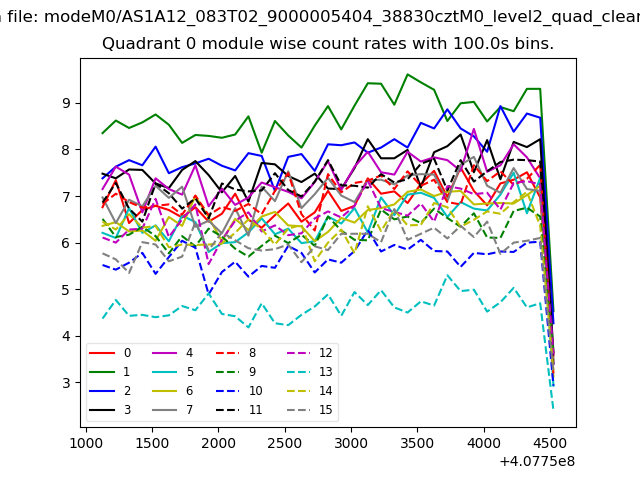 |
 |
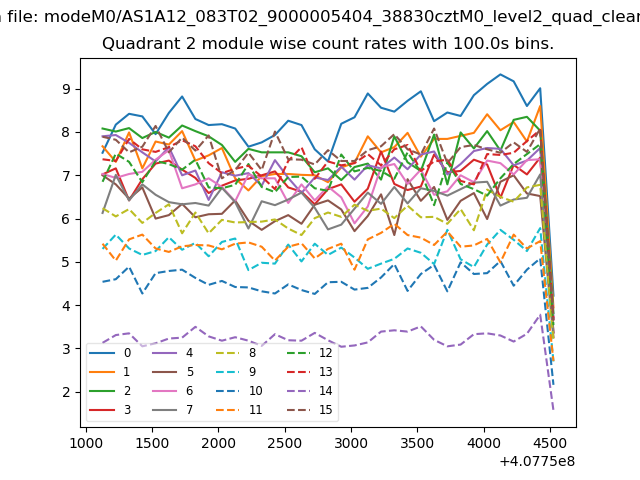
| Module-wise count rates for Quadrant B Data is divided into 100 sec bins |
 |
 |
| Module-wise count rates for Quadrant C Data is divided into 100 sec bins |
 |
 |
| Module-wise count rates for Quadrant D Data is divided into 100 sec bins |
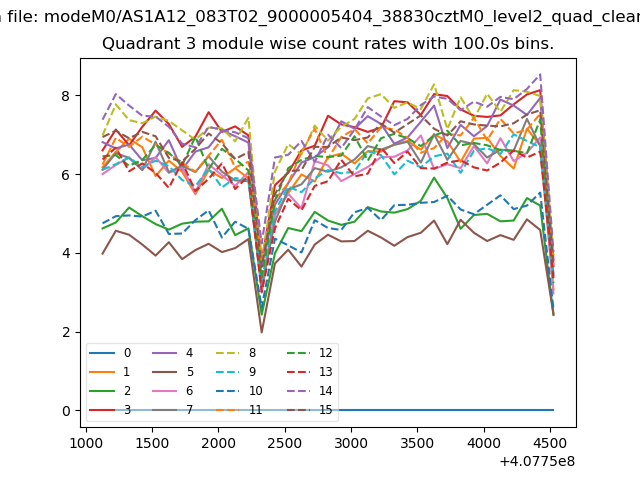 |
 |
| Parameter | Plot |
|---|---|
| CZT HV Monitor | 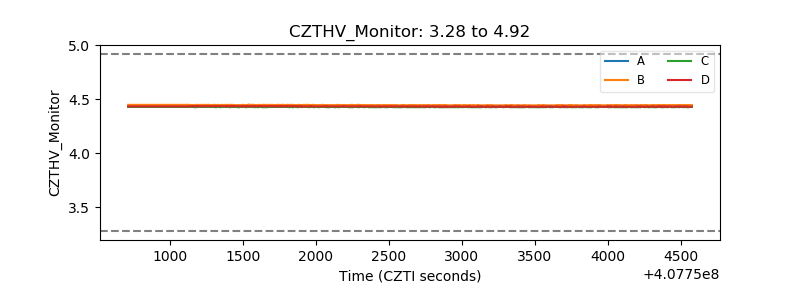 |
| D_VDD | 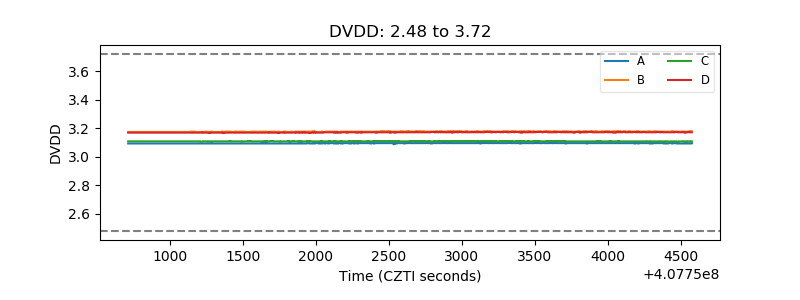 |
| Temperature 1 | 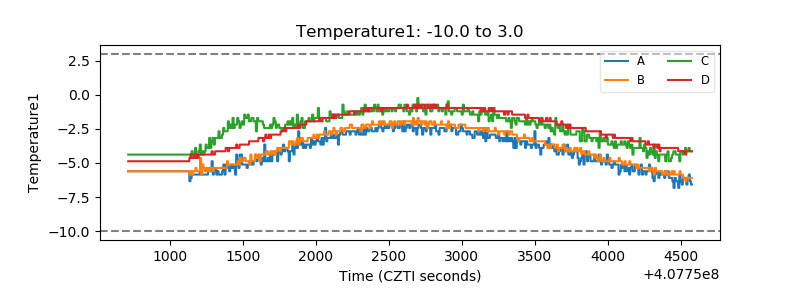 |
| Veto HV Monitor | 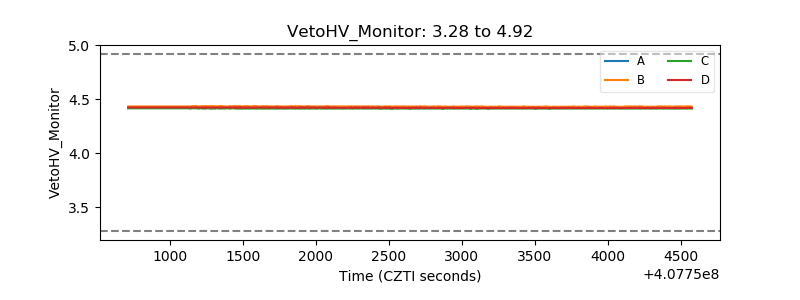 |
| Veto LLD | 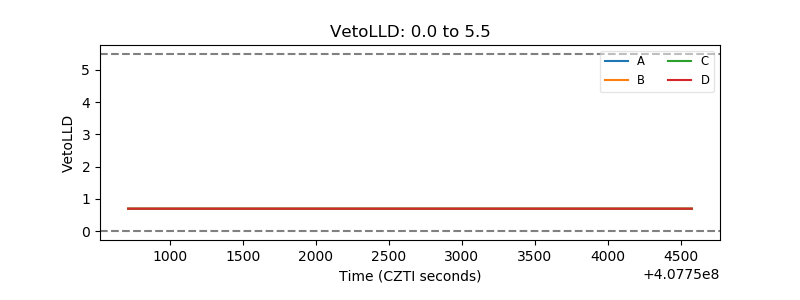 |
| Alpha Counter | 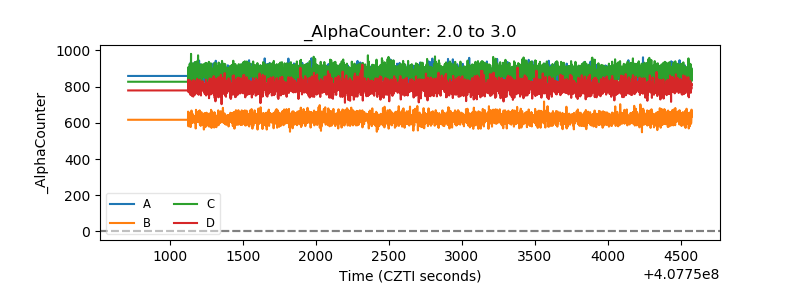 |
| _CPM_Rate | 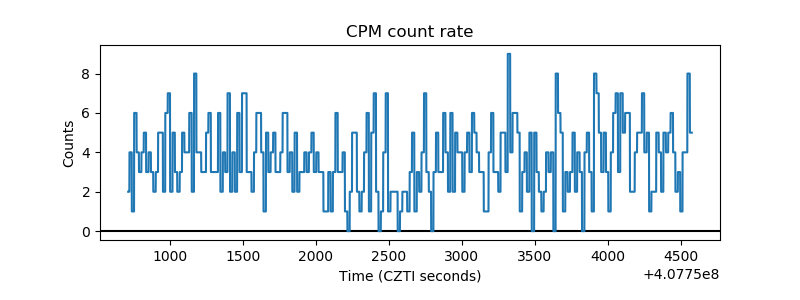 |
| CZT Counter | 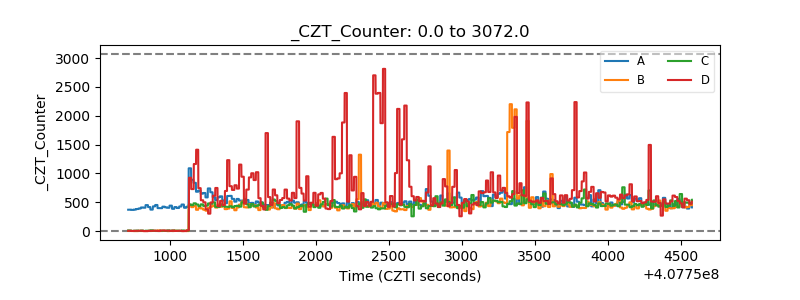 |
| +2.5 Volts monitor | 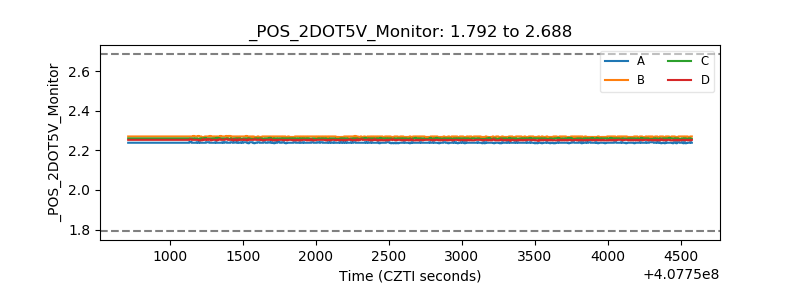 |
| +5 Volts monitor | 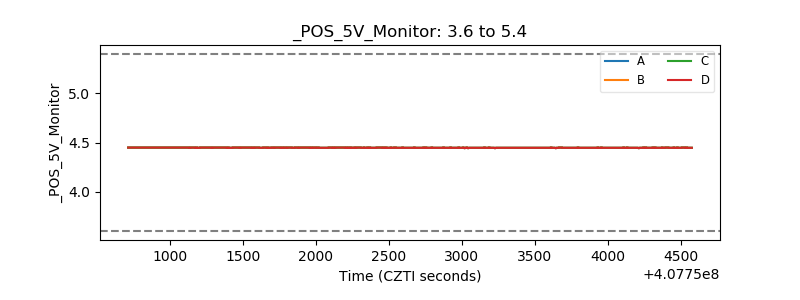 |
| _ROLL_ROT | 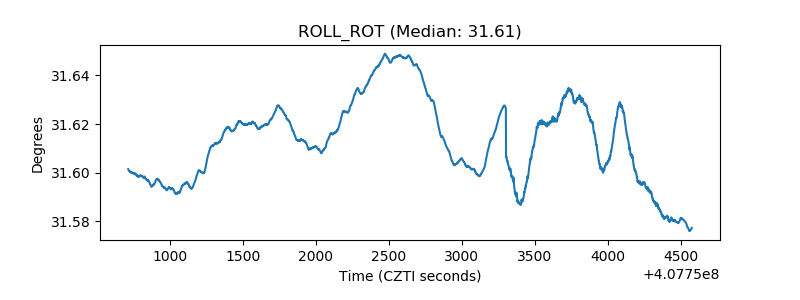 |
| _Roll_DEC | 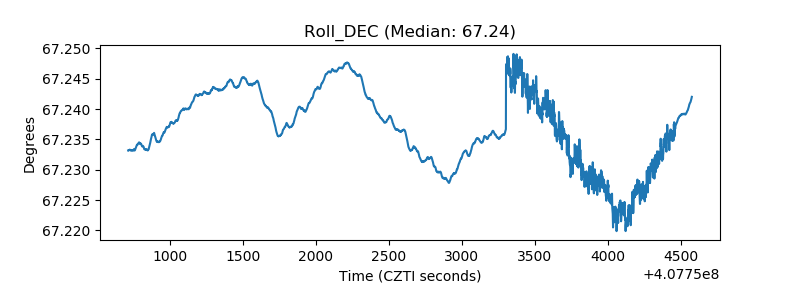 |
| _Roll_RA | 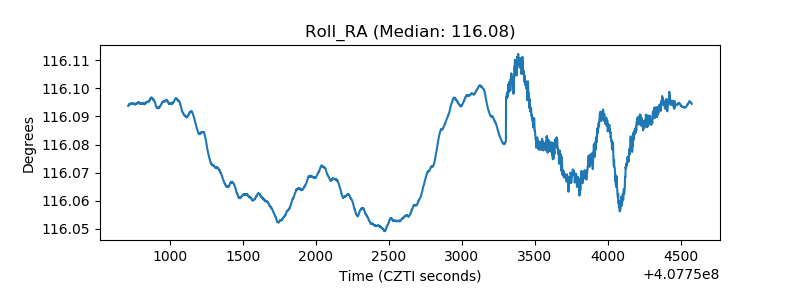 |
| Veto Counter | 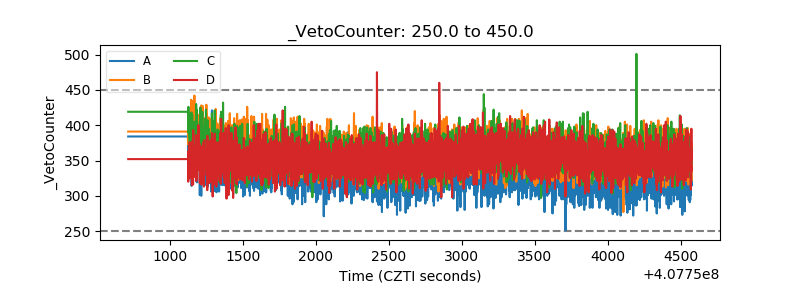 |