| Param | Original file | Final file |
|---|---|---|
| Filename | modeM0/AS1A12_077T06_9000005408_38833cztM0_level2.fits | modeM0/AS1A12_077T06_9000005408_38833cztM0_level2_quad_clean.evt |
| Size (bytes) | 183,067,200 | 52,568,640 |
| Size | 174.6 MB | 50.1 MB |
| Events in quadrant A | 1,627,919 | 354,912 |
| Events in quadrant B | 1,513,694 | 363,368 |
| Events in quadrant C | 1,525,543 | 343,613 |
| Events in quadrant D | 1,869,251 | 311,814 |
| Mode M9 | |||
|---|---|---|---|
| Quadrant | BADHDUFLAG | Total packets | Discarded packets |
| A | 0 | 15 | 0 |
| B | 0 | 15 | 0 |
| C | 0 | 15 | 0 |
| D | 0 | 15 | 0 |
| Mode SS | |||
|---|---|---|---|
| Quadrant | BADHDUFLAG | Total packets | Discarded packets |
| A | 0 | 64 | 0 |
| B | 0 | 64 | 0 |
| C | 0 | 64 | 0 |
| D | 0 | 64 | 0 |
| Mode M0 | |||
|---|---|---|---|
| Quadrant | BADHDUFLAG | Total packets | Discarded packets |
| A | 0 | 6739 | 2 |
| B | 0 | 6520 | 1 |
| C | 0 | 6415 | 1 |
| D | 0 | 7757 | 1 |
| Quadrant | Total seconds | Saturated seconds | Saturation percentage |
|---|---|---|---|
| A | 3062 | 11 | 0.359242% |
| B | 3062 | 7 | 0.228609% |
| C | 3062 | 6 | 0.195950% |
| D | 3062 | 115 | 3.755715% |
Noise dominated data is calculated using 1-second bins in cleaned event files. If a bin has >2000 counts, and if more than 50% of those come from <1% of pixels, then it is considered to be noise-dominated and hence unusable.
| Quadrant | # 1 sec bins | Bins with >0 counts | Bins with >2000 counts | High rate bins dominated by noise | Noise dominated (total time) | Noise dominated (detector-on time) | Marked lightcurve |
|---|---|---|---|---|---|---|---|
| A | 4645 | 3063 | 3 | 3 | 0.06% | 0.10% | 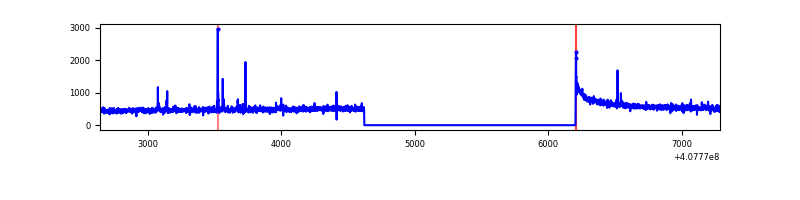 |
| B | 4645 | 3063 | 1 | 1 | 0.02% | 0.03% |  |
| C | 4645 | 3063 | 2 | 2 | 0.04% | 0.07% | 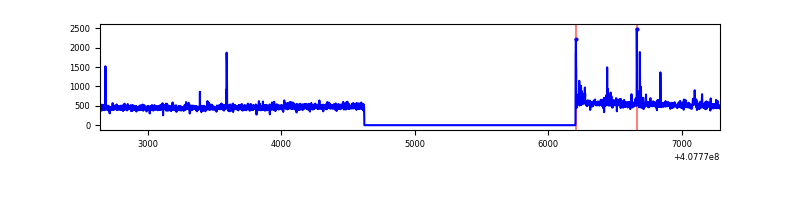 |
| D | 4645 | 3063 | 99 | 99 | 2.13% | 3.23% | 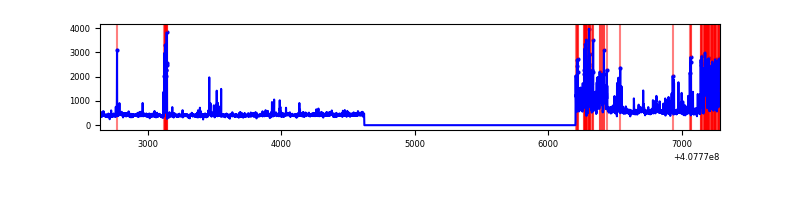 |
Top three noisy pixels from each quadrant. If the there are fewer than three noisy pixels in the level2.evt file, extra rows are filled as -1
| Pixel properties | Quadrant properties | ||||||
|---|---|---|---|---|---|---|---|
| Quadrant | DetID | PixID | Counts | Sigma | Mean | Median | Sigma |
| A | 10 | 83 | 227073 | 3085.66 | 353 | 346 | 73.5 |
| A | 9 | 143 | 23774 | 318.84 | 353 | 346 | 73.5 |
| A | 13 | 248 | 7835 | 101.92 | 353 | 346 | 73.5 |
| B | 5 | 200 | 48822 | 701.02 | 350 | 341 | 69.2 |
| B | 4 | 81 | 37878 | 542.78 | 350 | 341 | 69.2 |
| B | 5 | 184 | 26792 | 382.48 | 350 | 341 | 69.2 |
| C | 15 | 214 | 125389 | 1529.84 | 343 | 346 | 81.7 |
| C | 15 | 208 | 32564 | 394.17 | 343 | 346 | 81.7 |
| C | 3 | 233 | 14398 | 171.92 | 343 | 346 | 81.7 |
| D | 5 | 222 | 266058 | 3196.23 | 337 | 329 | 83.1 |
| D | 2 | 249 | 158854 | 1906.76 | 337 | 329 | 83.1 |
| D | 10 | 118 | 31508 | 375.03 | 337 | 329 | 83.1 |
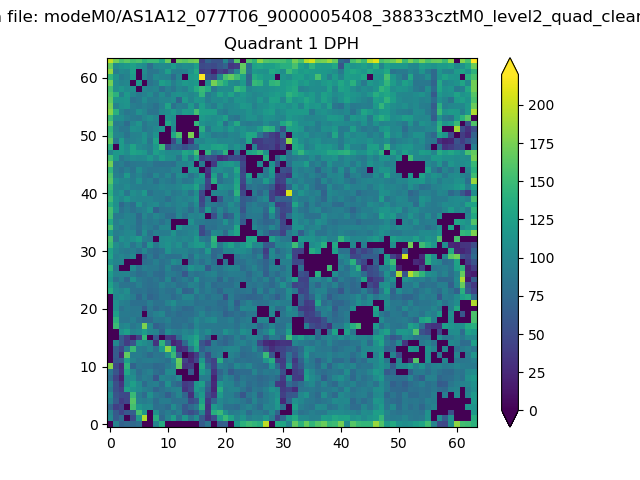
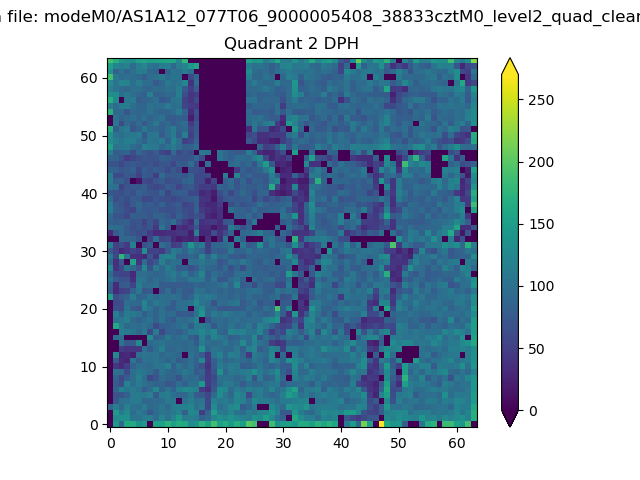
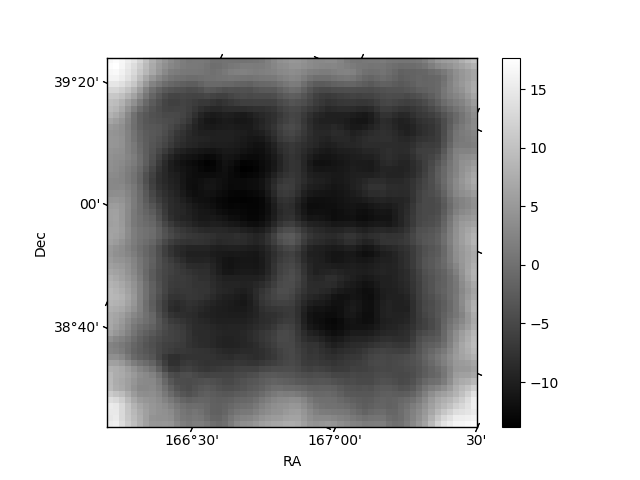
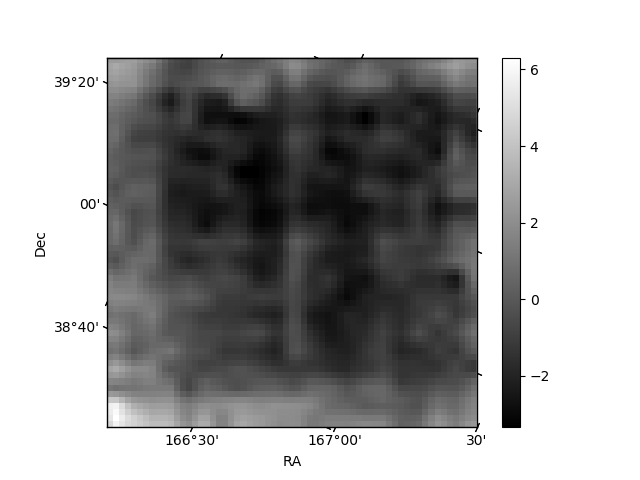
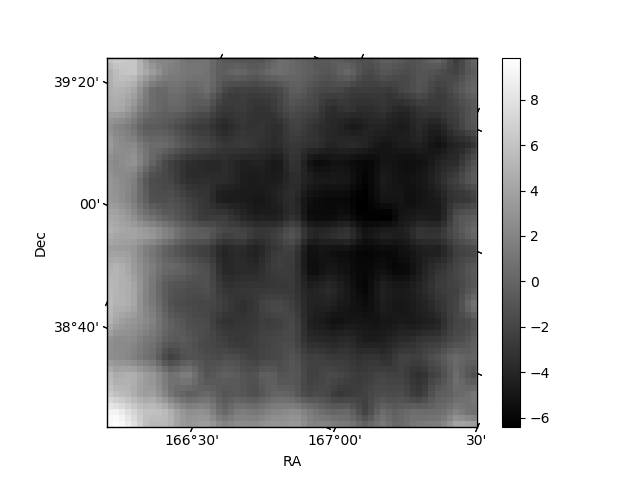
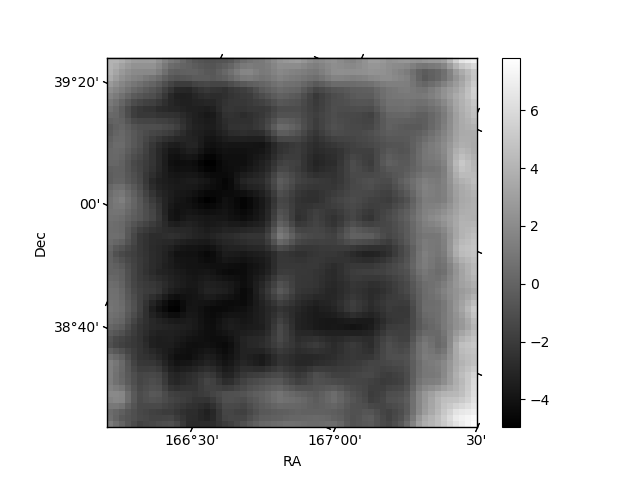
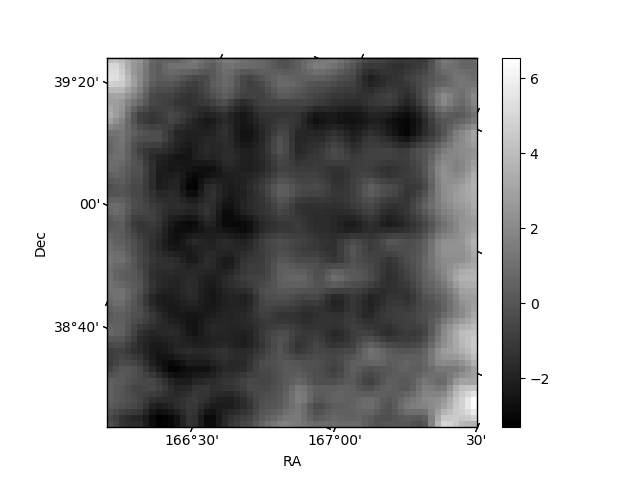
Histogram calculated using DETX and DETY for each event in the final _common_clean file
| Quadrant A | 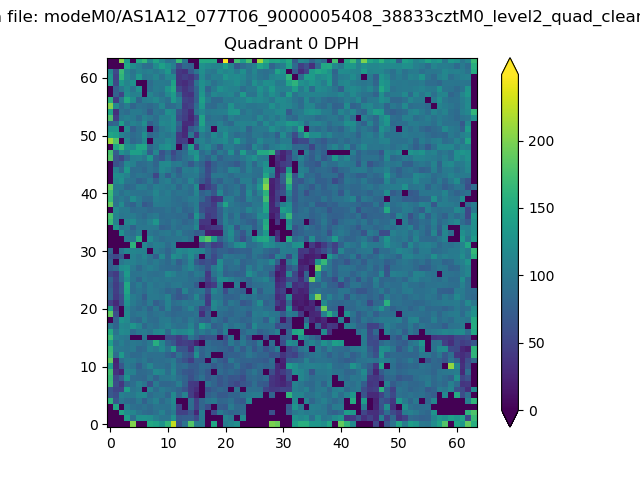 |
 |
Quadrant B |
|---|---|---|---|
| Quadrant D | 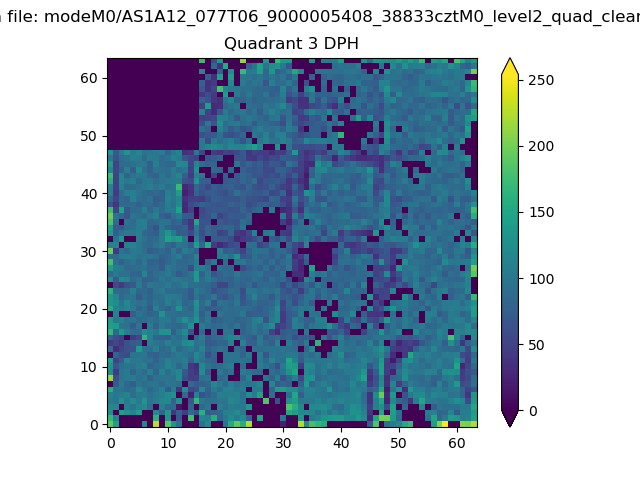 |
 |
Quadrant C |
| Plot type | Count rate plots | Images |
|---|---|---|
| Comparison with Poisson distribution Blue bars denote a histogram of data divided into 1 sec bins. Red curve is a Poisson curve with rate = median count rate of data. |
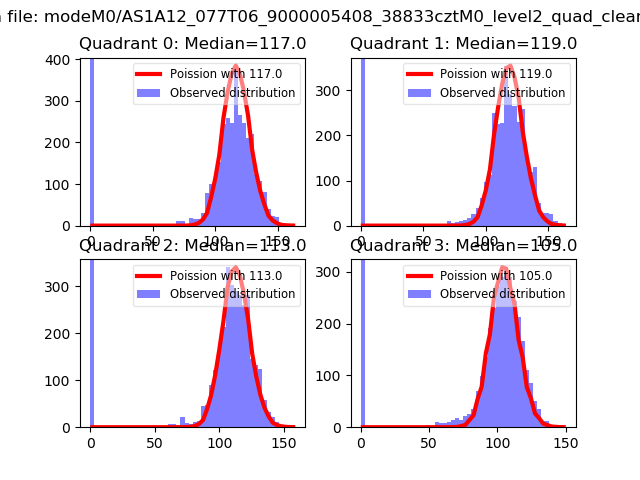 |
 |
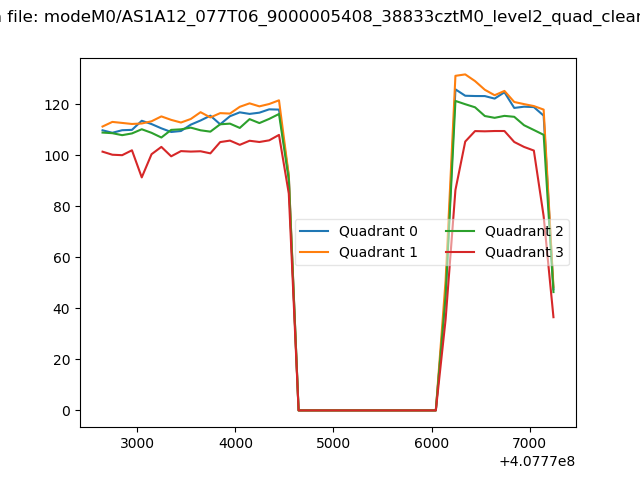
| Quadrant-wise count rates Data is divided into 100 sec bins |
 |
|
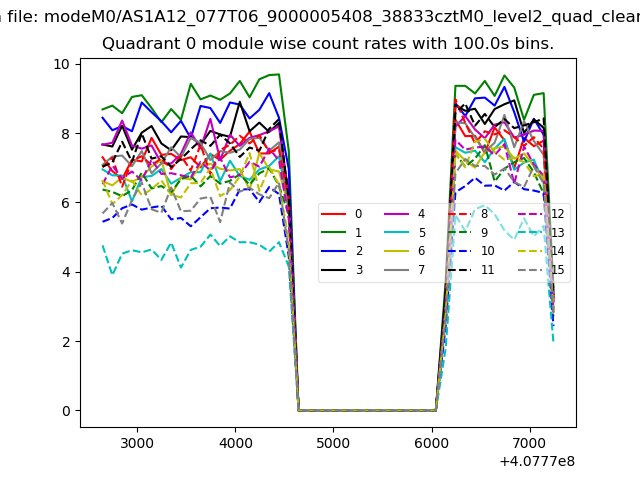
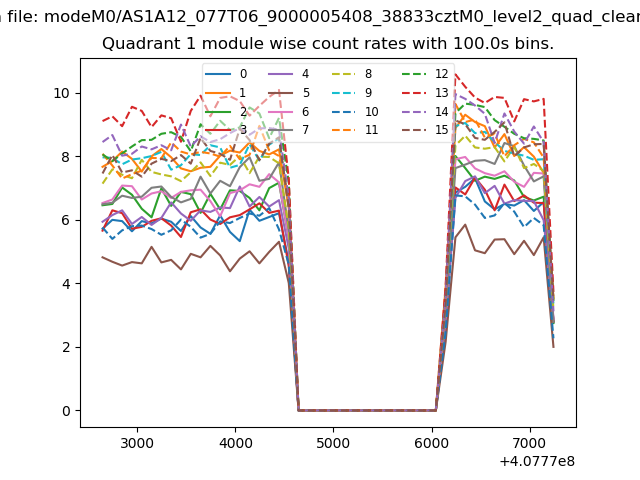
| Module-wise count rates for Quadrant A Data is divided into 100 sec bins |
 |
 |
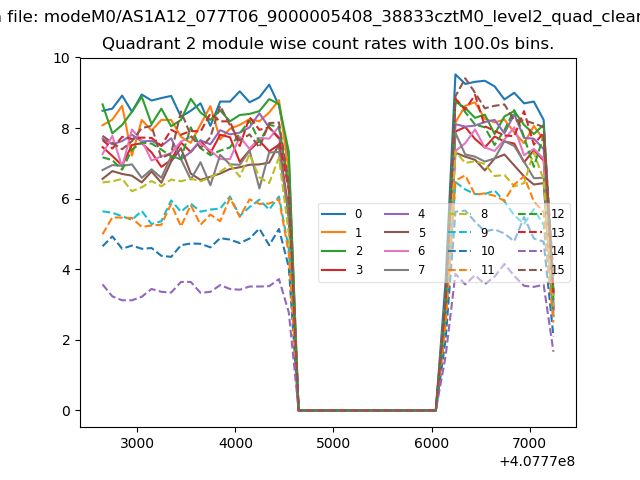
| Module-wise count rates for Quadrant B Data is divided into 100 sec bins |
 |
 |
| Module-wise count rates for Quadrant C Data is divided into 100 sec bins |
 |
 |
| Module-wise count rates for Quadrant D Data is divided into 100 sec bins |
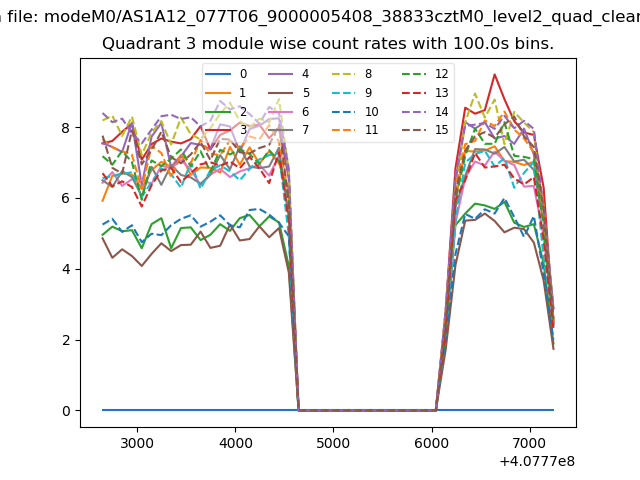 |
 |
| Parameter | Plot |
|---|---|
| CZT HV Monitor | 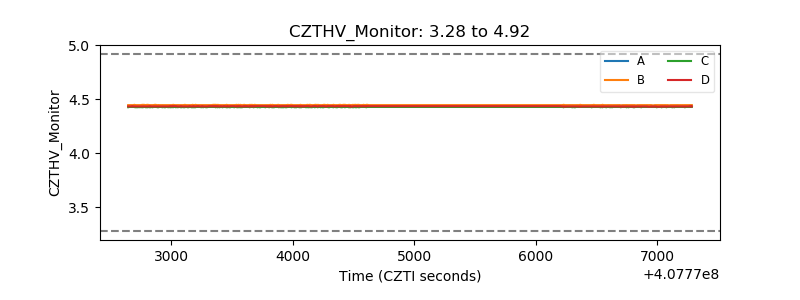 |
| D_VDD | 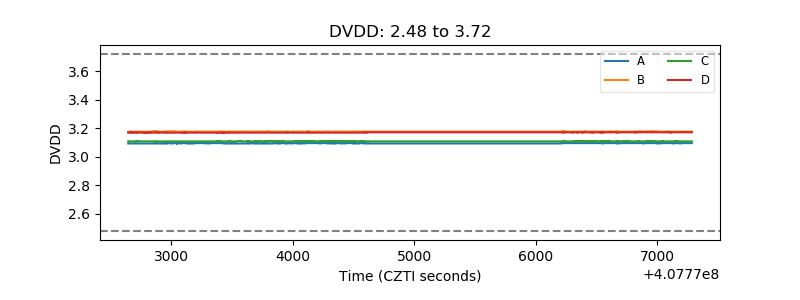 |
| Temperature 1 | 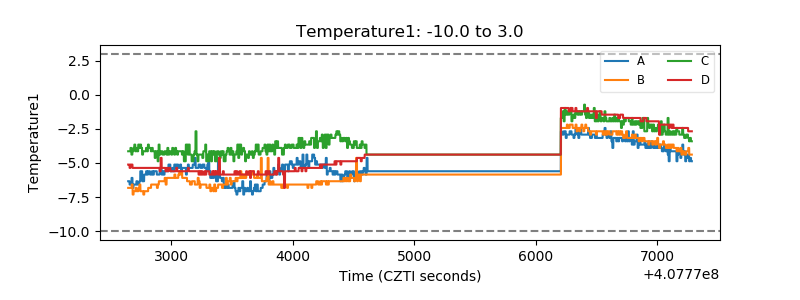 |
| Veto HV Monitor | 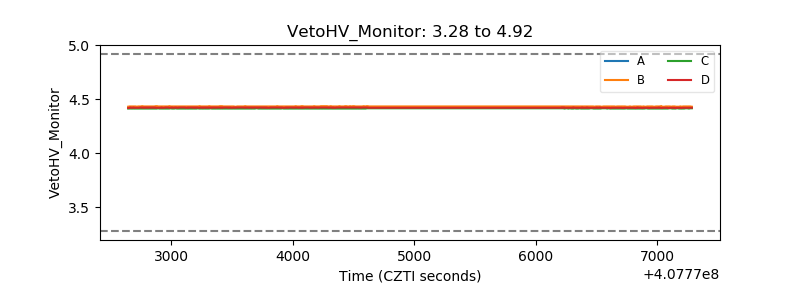 |
| Veto LLD | 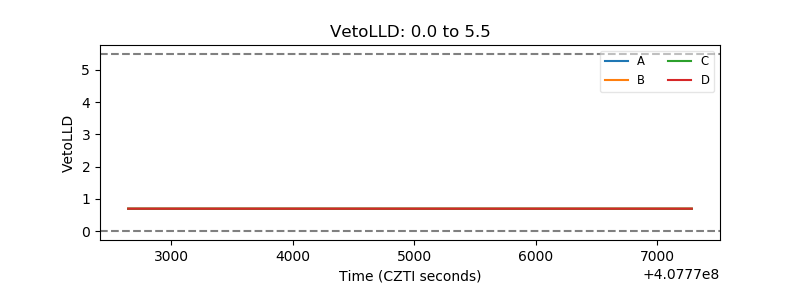 |
| Alpha Counter |  |
| _CPM_Rate |  |
| CZT Counter | 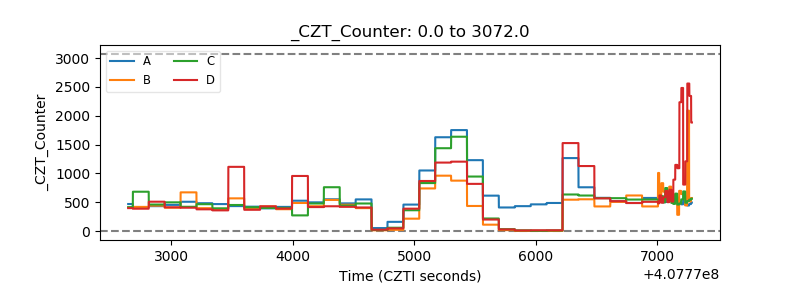 |
| +2.5 Volts monitor | 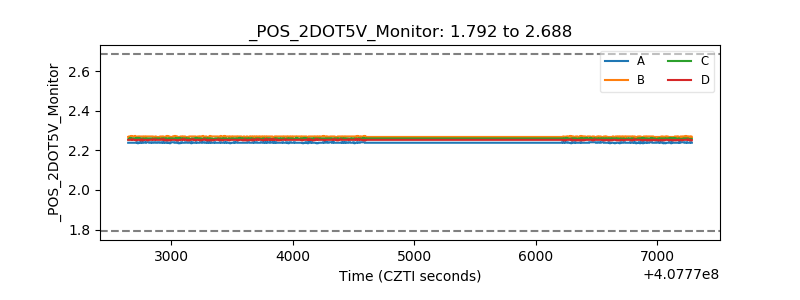 |
| +5 Volts monitor | 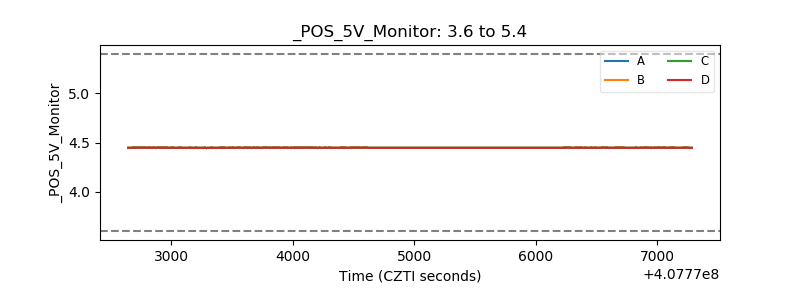 |
| _ROLL_ROT | 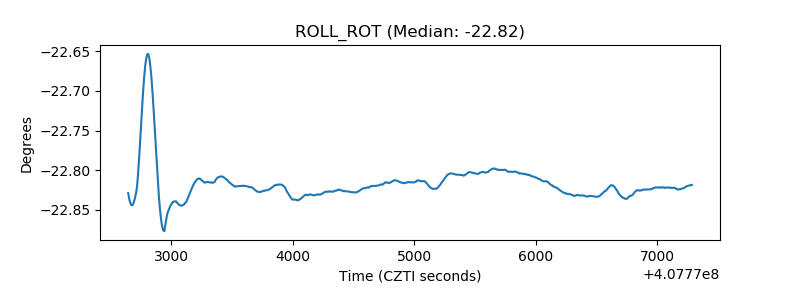 |
| _Roll_DEC | 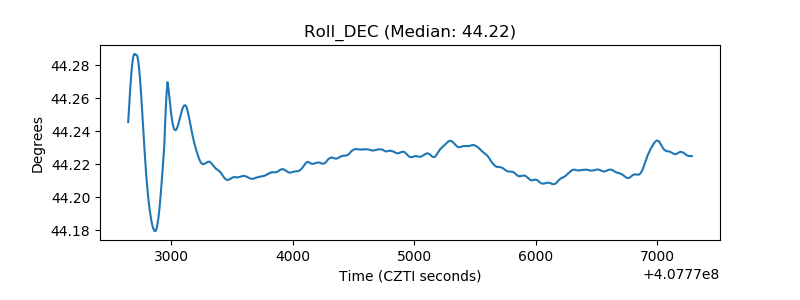 |
| _Roll_RA | 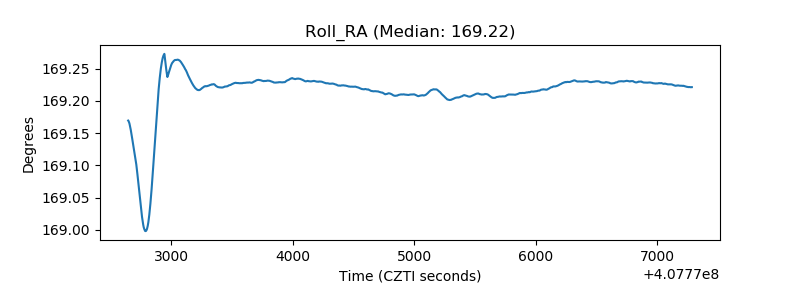 |
| Veto Counter | 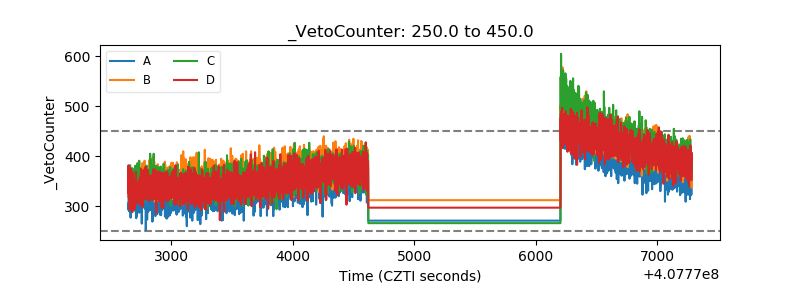 |