| Param | Original file | Final file |
|---|---|---|
| Filename | modeM0/AS1A12_077T06_9000005408_38834cztM0_level2.fits | modeM0/AS1A12_077T06_9000005408_38834cztM0_level2_quad_clean.evt |
| Size (bytes) | 345,312,000 | 92,041,920 |
| Size | 329.3 MB | 87.8 MB |
| Events in quadrant A | 2,845,399 | 633,018 |
| Events in quadrant B | 2,677,231 | 645,083 |
| Events in quadrant C | 2,737,878 | 607,806 |
| Events in quadrant D | 4,104,021 | 525,468 |
| Mode M9 | |||
|---|---|---|---|
| Quadrant | BADHDUFLAG | Total packets | Discarded packets |
| A | 0 | 17 | 0 |
| B | 0 | 17 | 0 |
| C | 0 | 17 | 0 |
| D | 0 | 17 | 0 |
| Mode SS | |||
|---|---|---|---|
| Quadrant | BADHDUFLAG | Total packets | Discarded packets |
| A | 0 | 110 | 0 |
| B | 0 | 110 | 0 |
| C | 0 | 110 | 0 |
| D | 0 | 110 | 0 |
| Mode M0 | |||
|---|---|---|---|
| Quadrant | BADHDUFLAG | Total packets | Discarded packets |
| A | 0 | 11836 | 2 |
| B | 0 | 11605 | 1 |
| C | 0 | 11441 | 1 |
| D | 0 | 15857 | 1 |
| Quadrant | Total seconds | Saturated seconds | Saturation percentage |
|---|---|---|---|
| A | 5363 | 12 | 0.223755% |
| B | 5363 | 24 | 0.447511% |
| C | 5363 | 37 | 0.689912% |
| D | 5363 | 442 | 8.241656% |
Noise dominated data is calculated using 1-second bins in cleaned event files. If a bin has >2000 counts, and if more than 50% of those come from <1% of pixels, then it is considered to be noise-dominated and hence unusable.
| Quadrant | # 1 sec bins | Bins with >0 counts | Bins with >2000 counts | High rate bins dominated by noise | Noise dominated (total time) | Noise dominated (detector-on time) | Marked lightcurve |
|---|---|---|---|---|---|---|---|
| A | 7096 | 5364 | 3 | 3 | 0.04% | 0.06% | 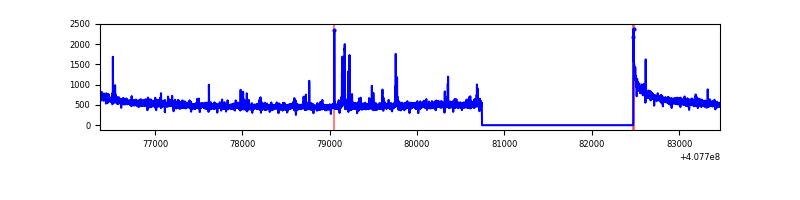 |
| B | 7096 | 5364 | 10 | 10 | 0.14% | 0.19% | 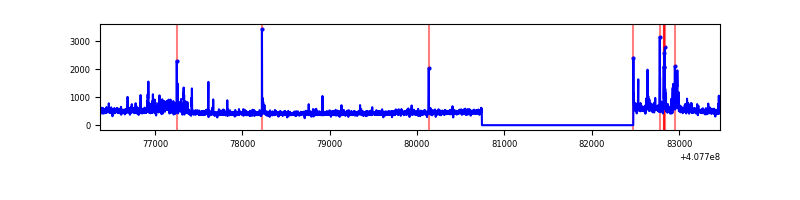 |
| C | 7096 | 5364 | 30 | 30 | 0.42% | 0.56% | 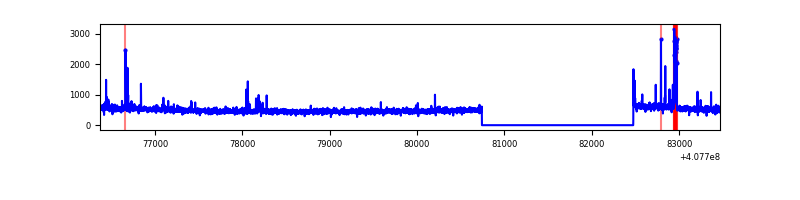 |
| D | 7096 | 5364 | 360 | 360 | 5.07% | 6.71% | 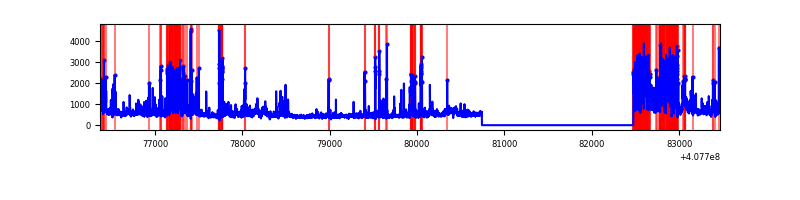 |
Top three noisy pixels from each quadrant. If the there are fewer than three noisy pixels in the level2.evt file, extra rows are filled as -1
| Pixel properties | Quadrant properties | ||||||
|---|---|---|---|---|---|---|---|
| Quadrant | DetID | PixID | Counts | Sigma | Mean | Median | Sigma |
| A | 10 | 83 | 365420 | 2906.99 | 617 | 604 | 125.5 |
| A | 13 | 248 | 51157 | 402.83 | 617 | 604 | 125.5 |
| A | 9 | 143 | 27163 | 211.63 | 617 | 604 | 125.5 |
| B | 4 | 81 | 73171 | 616.75 | 615 | 599 | 117.7 |
| B | 15 | 85 | 64625 | 544.13 | 615 | 599 | 117.7 |
| B | 5 | 184 | 45955 | 385.46 | 615 | 599 | 117.7 |
| C | 15 | 214 | 217560 | 1541.93 | 603 | 607 | 140.7 |
| C | 14 | 254 | 88877 | 627.35 | 603 | 607 | 140.7 |
| C | 3 | 233 | 28257 | 196.51 | 603 | 607 | 140.7 |
| D | 2 | 249 | 829090 | 5869.66 | 577 | 563 | 141.2 |
| D | 12 | 235 | 241871 | 1709.54 | 577 | 563 | 141.2 |
| D | 5 | 222 | 238665 | 1686.82 | 577 | 563 | 141.2 |
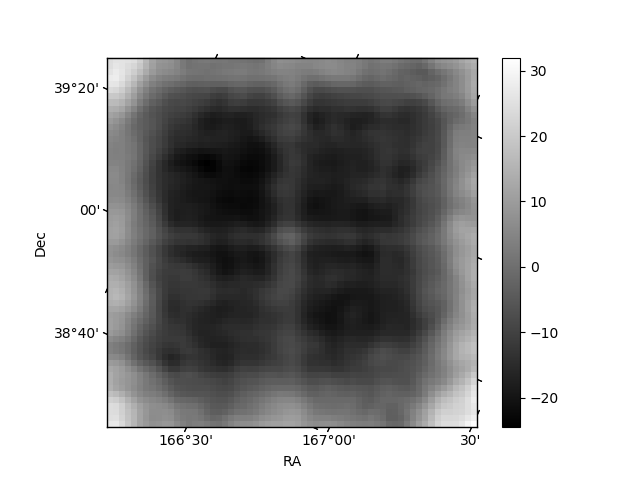
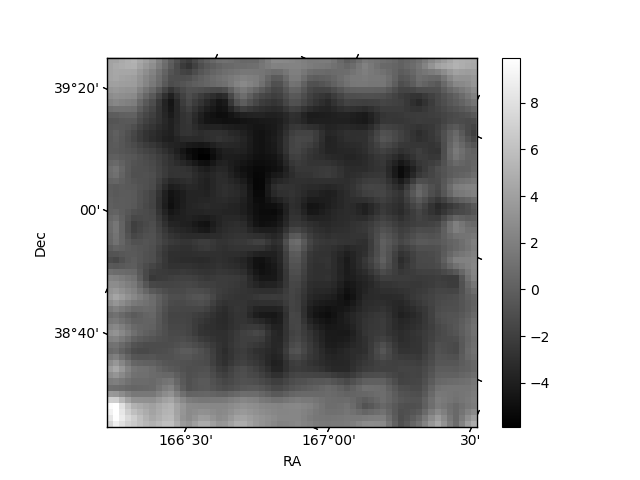
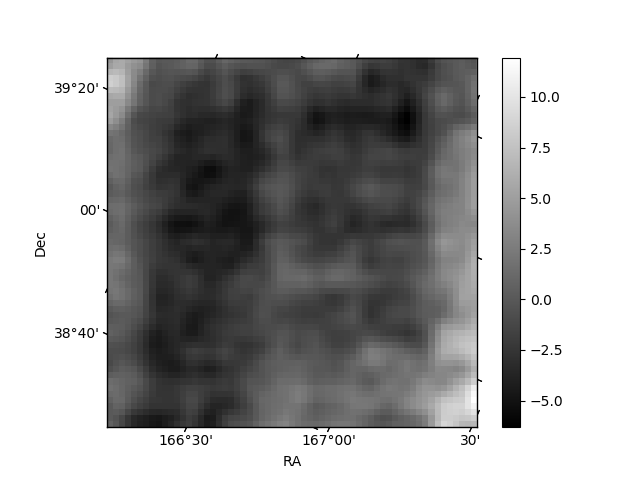
Histogram calculated using DETX and DETY for each event in the final _common_clean file
| Quadrant A | 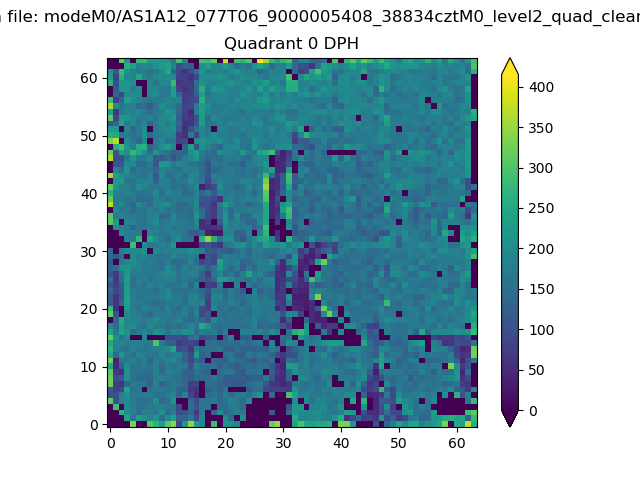 |
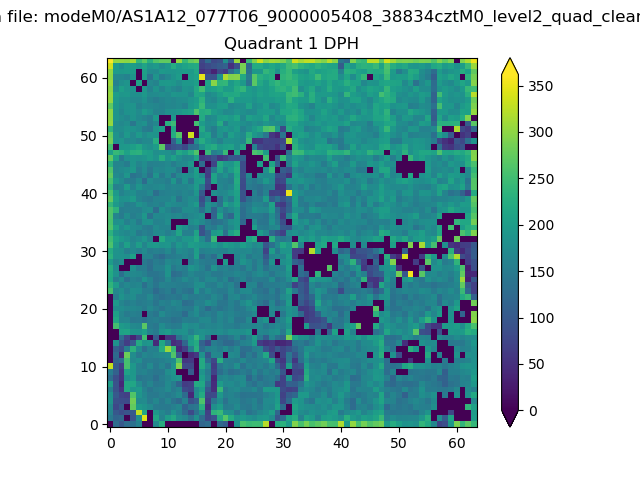 |
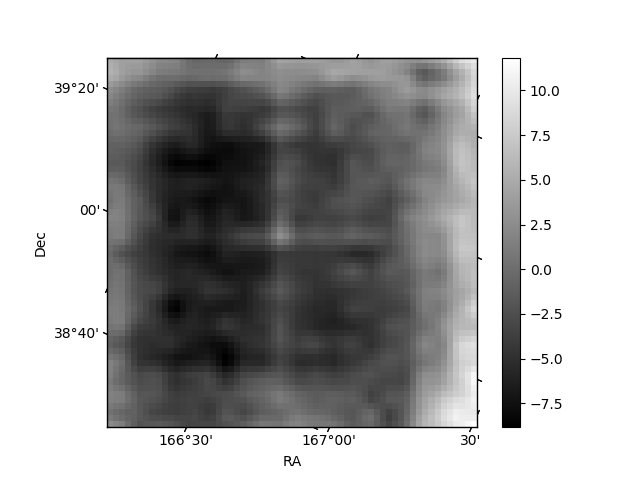
Quadrant B |
|---|---|---|---|
| Quadrant D | 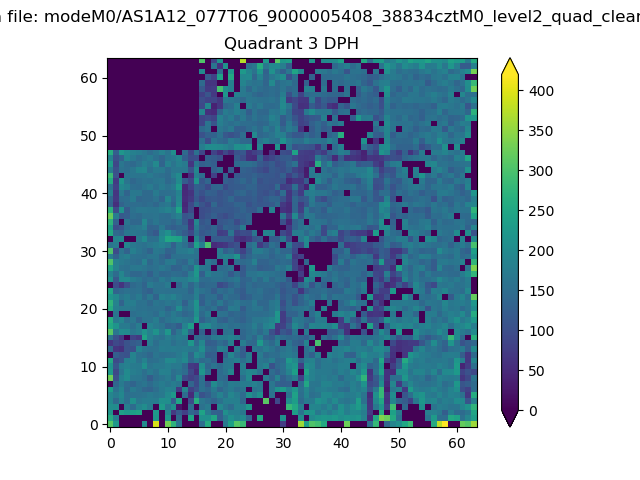 |
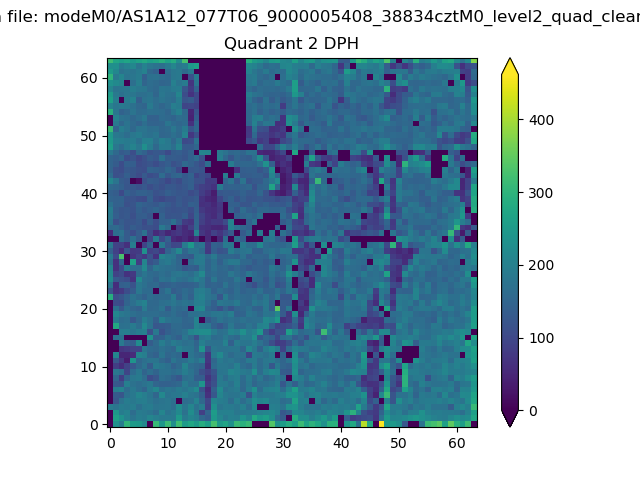 |
Quadrant C |
| Plot type | Count rate plots | Images |
|---|---|---|
| Comparison with Poisson distribution Blue bars denote a histogram of data divided into 1 sec bins. Red curve is a Poisson curve with rate = median count rate of data. |
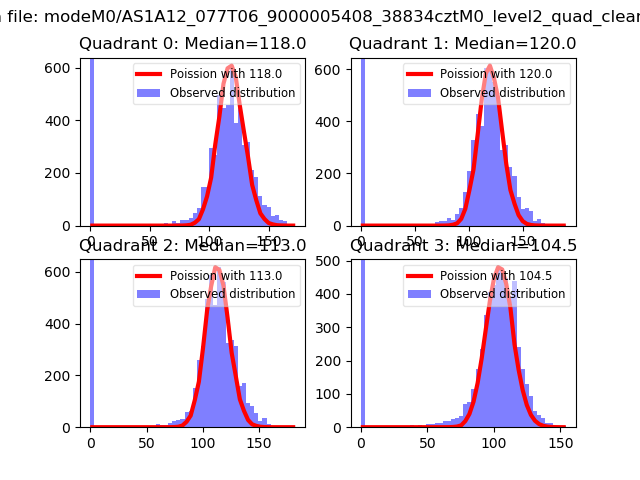 |
 |
| Quadrant-wise count rates Data is divided into 100 sec bins |
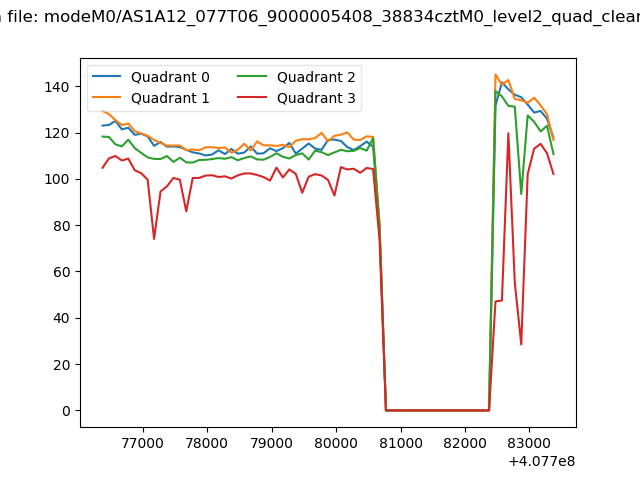 |
|
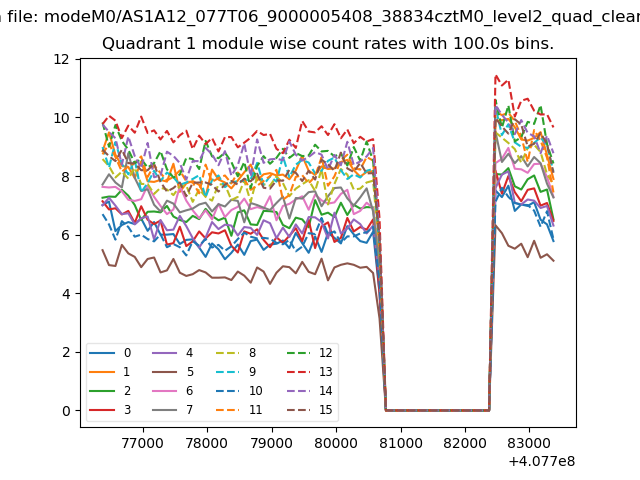
| Module-wise count rates for Quadrant A Data is divided into 100 sec bins |
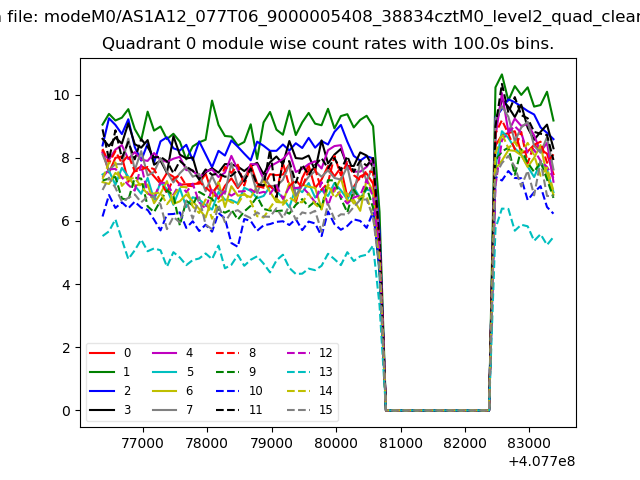 |
 |
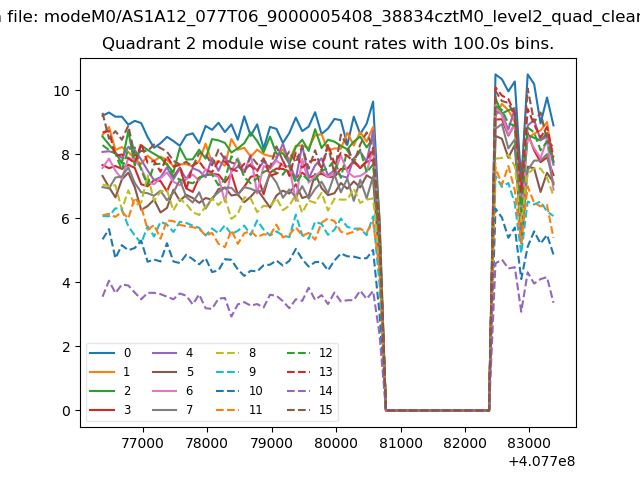
| Module-wise count rates for Quadrant B Data is divided into 100 sec bins |
 |
 |
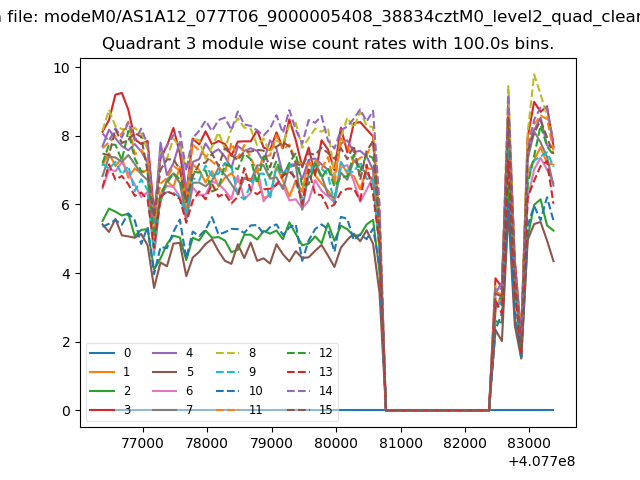
| Module-wise count rates for Quadrant C Data is divided into 100 sec bins |
 |
 |
| Module-wise count rates for Quadrant D Data is divided into 100 sec bins |
 |
 |
| Parameter | Plot |
|---|---|
| CZT HV Monitor | 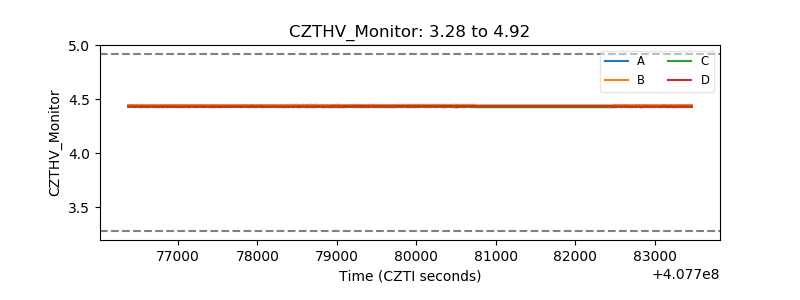 |
| D_VDD | 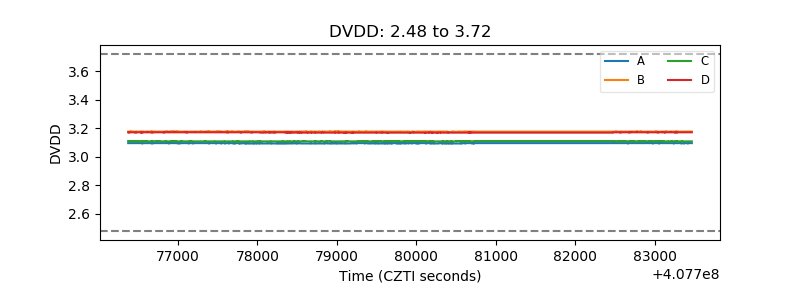 |
| Temperature 1 | 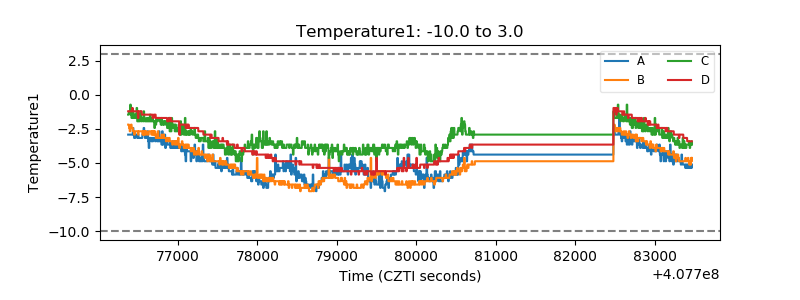 |
| Veto HV Monitor | 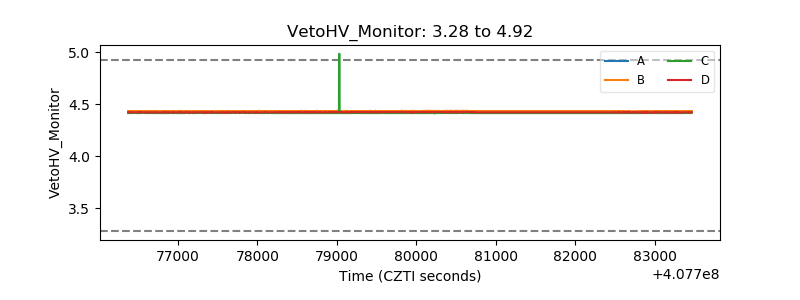 |
| Veto LLD | 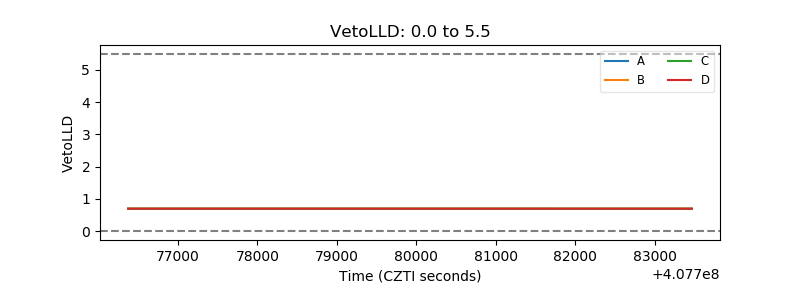 |
| Alpha Counter | 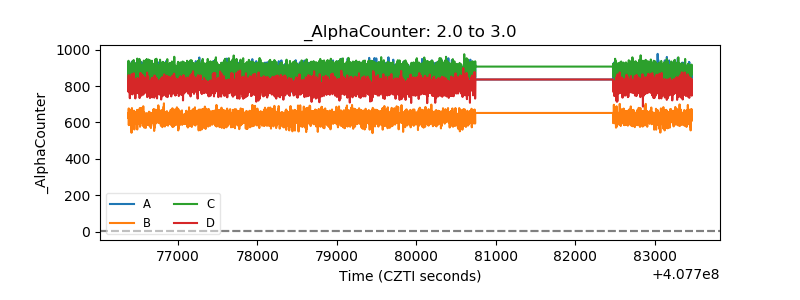 |
| _CPM_Rate | 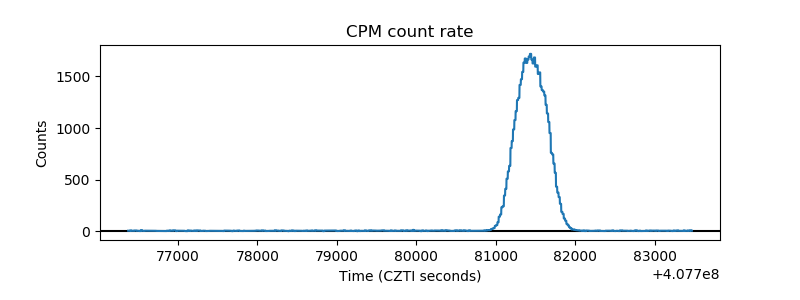 |
| CZT Counter | 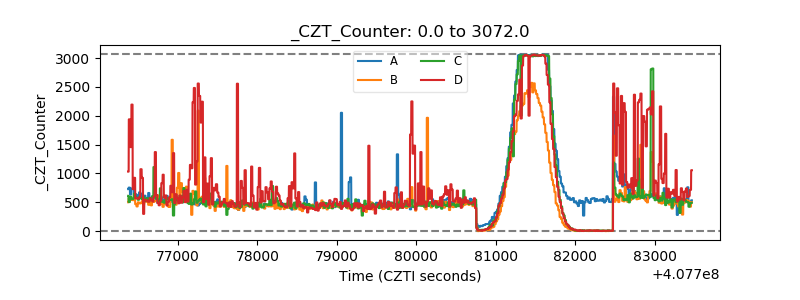 |
| +2.5 Volts monitor | 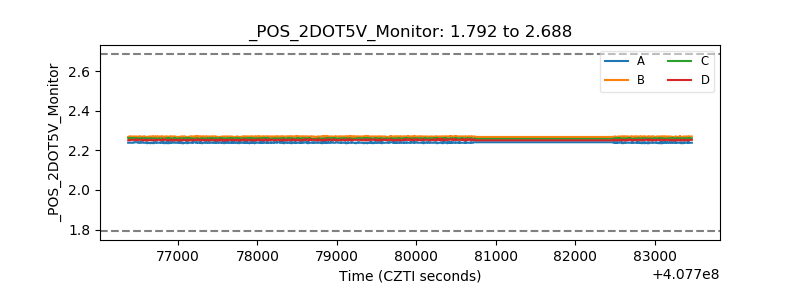 |
| +5 Volts monitor | 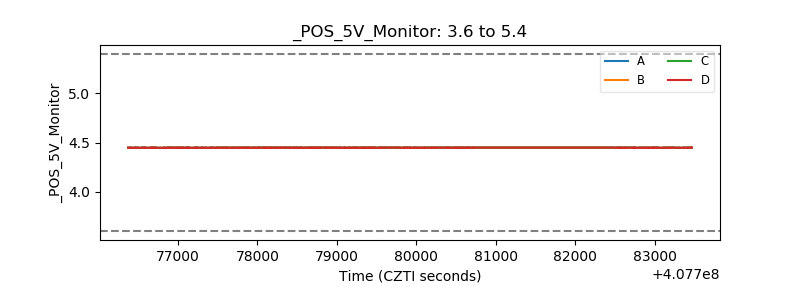 |
| _ROLL_ROT | 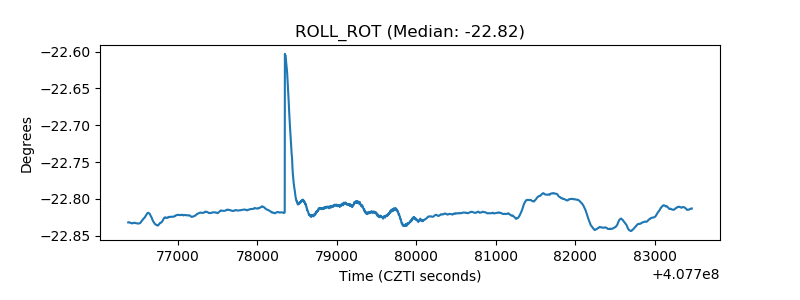 |
| _Roll_DEC | 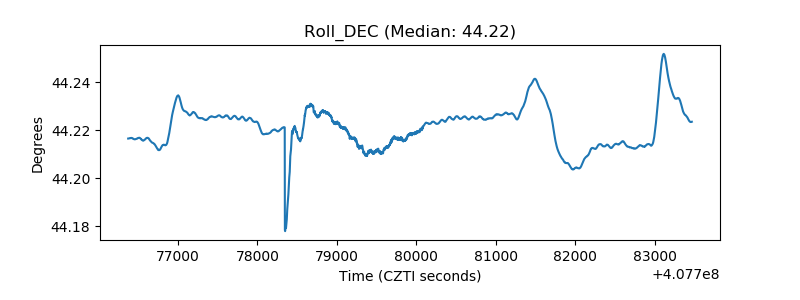 |
| _Roll_RA | 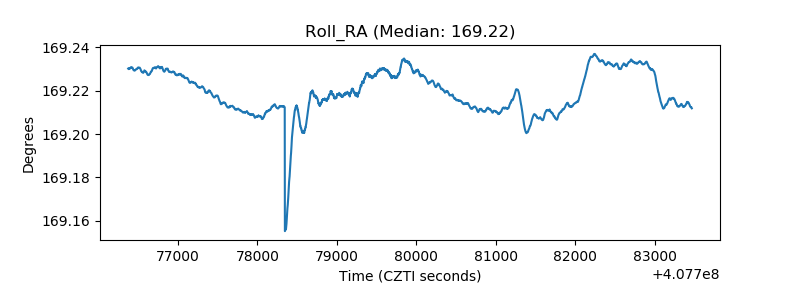 |
| Veto Counter | 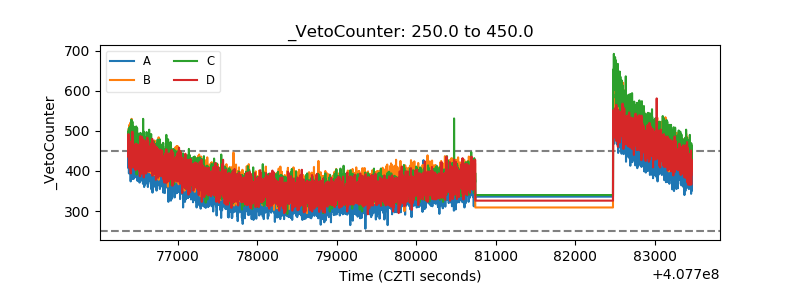 |