| Param | Original file | Final file |
|---|---|---|
| Filename | modeM0/AS1A12_077T06_9000005408_38836cztM0_level2.fits | modeM0/AS1A12_077T06_9000005408_38836cztM0_level2_quad_clean.evt |
| Size (bytes) | 350,948,160 | 92,643,840 |
| Size | 334.7 MB | 88.4 MB |
| Events in quadrant A | 2,880,990 | 645,602 |
| Events in quadrant B | 2,610,782 | 658,186 |
| Events in quadrant C | 2,794,646 | 625,963 |
| Events in quadrant D | 4,301,273 | 513,325 |
| Mode M9 | |||
|---|---|---|---|
| Quadrant | BADHDUFLAG | Total packets | Discarded packets |
| A | 0 | 27 | 0 |
| B | 0 | 27 | 0 |
| C | 0 | 27 | 0 |
| D | 0 | 28 | 0 |
| Mode SS | |||
|---|---|---|---|
| Quadrant | BADHDUFLAG | Total packets | Discarded packets |
| A | 0 | 104 | 0 |
| B | 0 | 104 | 0 |
| C | 0 | 104 | 0 |
| D | 0 | 104 | 0 |
| Mode M0 | |||
|---|---|---|---|
| Quadrant | BADHDUFLAG | Total packets | Discarded packets |
| A | 0 | 11861 | 3 |
| B | 0 | 11200 | 2 |
| C | 0 | 11513 | 2 |
| D | 0 | 16319 | 2 |
| Quadrant | Total seconds | Saturated seconds | Saturation percentage |
|---|---|---|---|
| A | 5177 | 21 | 0.405640% |
| B | 5177 | 22 | 0.424957% |
| C | 5177 | 42 | 0.811281% |
| D | 5177 | 592 | 11.435194% |
Noise dominated data is calculated using 1-second bins in cleaned event files. If a bin has >2000 counts, and if more than 50% of those come from <1% of pixels, then it is considered to be noise-dominated and hence unusable.
| Quadrant | # 1 sec bins | Bins with >0 counts | Bins with >2000 counts | High rate bins dominated by noise | Noise dominated (total time) | Noise dominated (detector-on time) | Marked lightcurve |
|---|---|---|---|---|---|---|---|
| A | 7031 | 5178 | 13 | 13 | 0.18% | 0.25% | 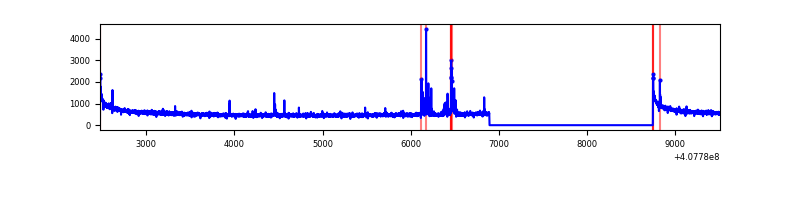 |
| B | 7031 | 5178 | 10 | 10 | 0.14% | 0.19% | 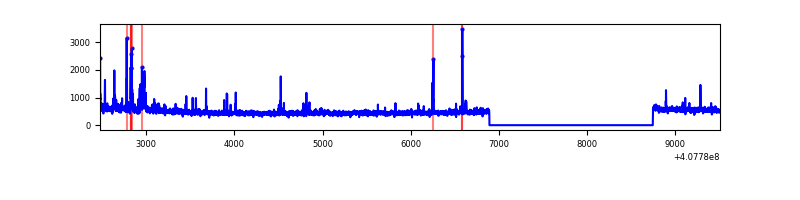 |
| C | 7031 | 5178 | 33 | 33 | 0.47% | 0.64% |  |
| D | 7031 | 5178 | 462 | 462 | 6.57% | 8.92% | 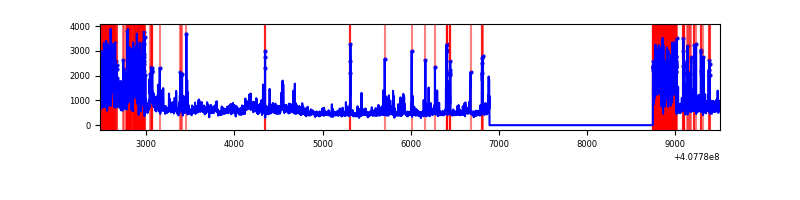 |
Top three noisy pixels from each quadrant. If the there are fewer than three noisy pixels in the level2.evt file, extra rows are filled as -1
| Pixel properties | Quadrant properties | ||||||
|---|---|---|---|---|---|---|---|
| Quadrant | DetID | PixID | Counts | Sigma | Mean | Median | Sigma |
| A | 10 | 83 | 407130 | 3294.96 | 609 | 598 | 123.4 |
| A | 13 | 248 | 75577 | 607.71 | 609 | 598 | 123.4 |
| A | 9 | 143 | 29228 | 232.05 | 609 | 598 | 123.4 |
| B | 15 | 85 | 66731 | 568.98 | 610 | 594 | 116.2 |
| B | 5 | 184 | 50063 | 425.59 | 610 | 594 | 116.2 |
| B | 4 | 81 | 32165 | 271.61 | 610 | 594 | 116.2 |
| C | 15 | 214 | 214072 | 1536.97 | 601 | 605 | 138.9 |
| C | 14 | 254 | 98113 | 702.06 | 601 | 605 | 138.9 |
| C | 3 | 233 | 77343 | 552.51 | 601 | 605 | 138.9 |
| D | 2 | 249 | 1265513 | 9323.53 | 558 | 543 | 135.7 |
| D | 12 | 235 | 496048 | 3652.15 | 558 | 543 | 135.7 |
| D | 12 | 227 | 181036 | 1330.33 | 558 | 543 | 135.7 |
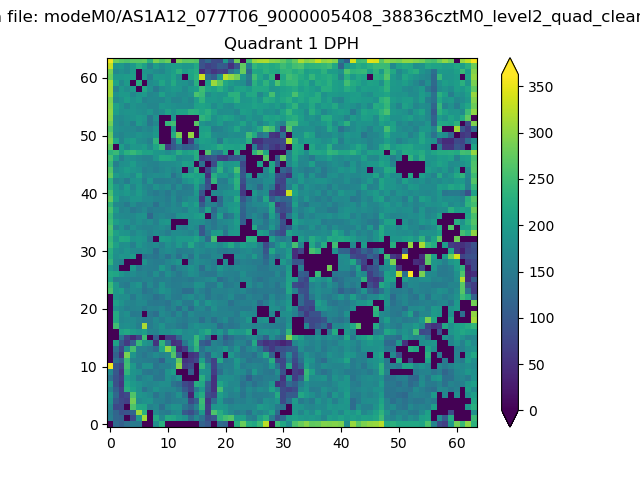
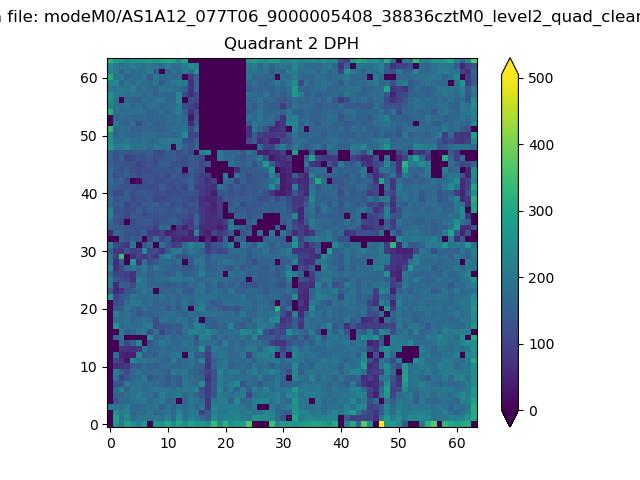
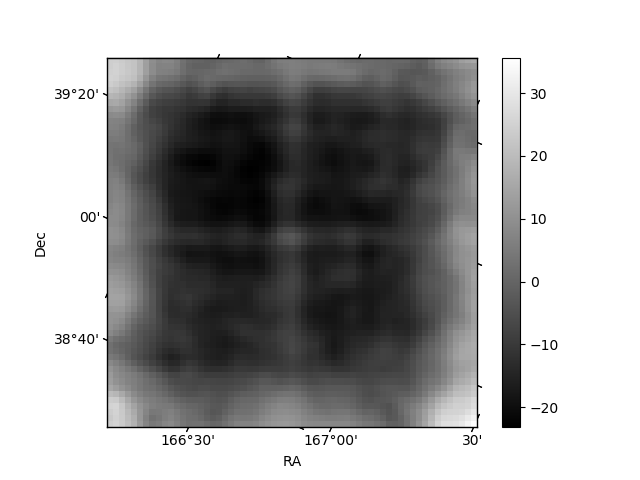
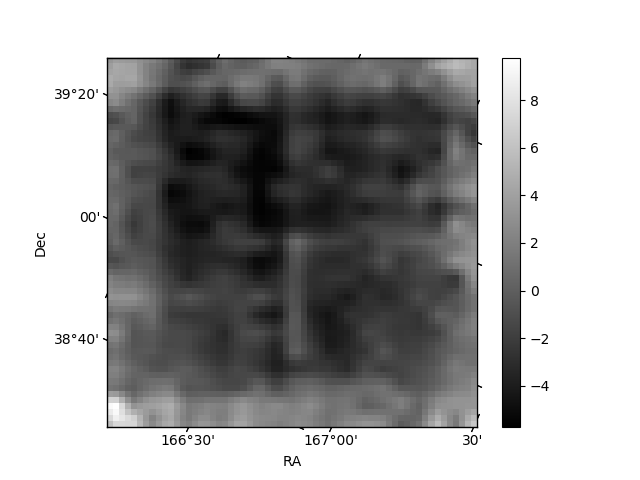
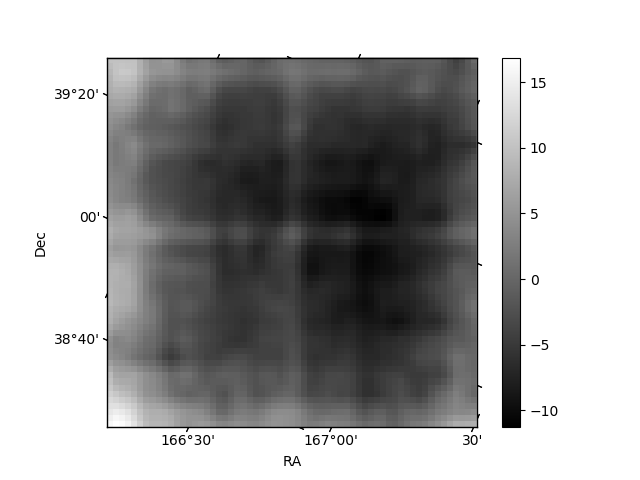
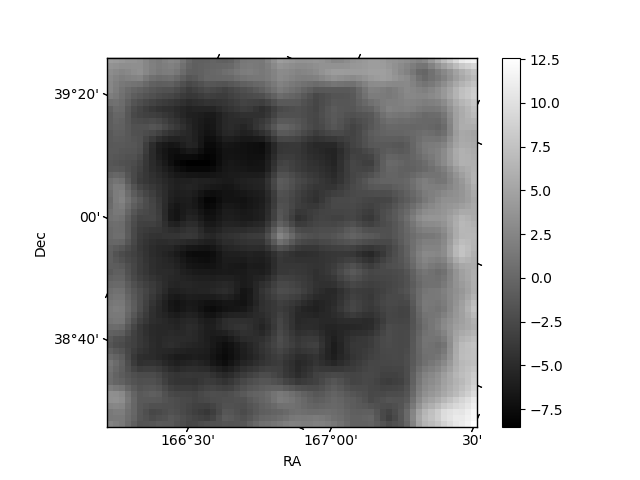
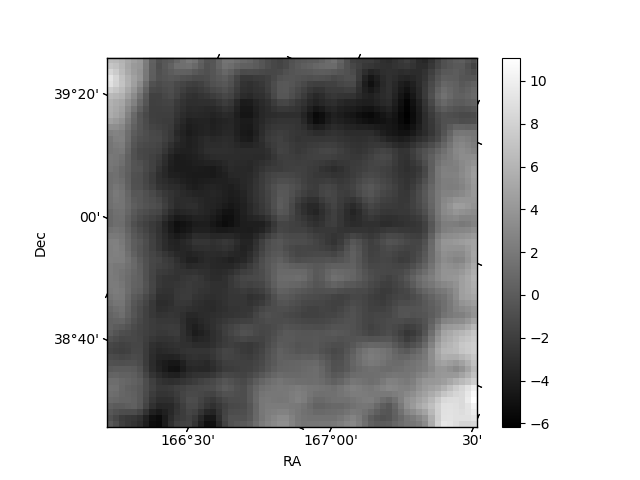
Histogram calculated using DETX and DETY for each event in the final _common_clean file
| Quadrant A | 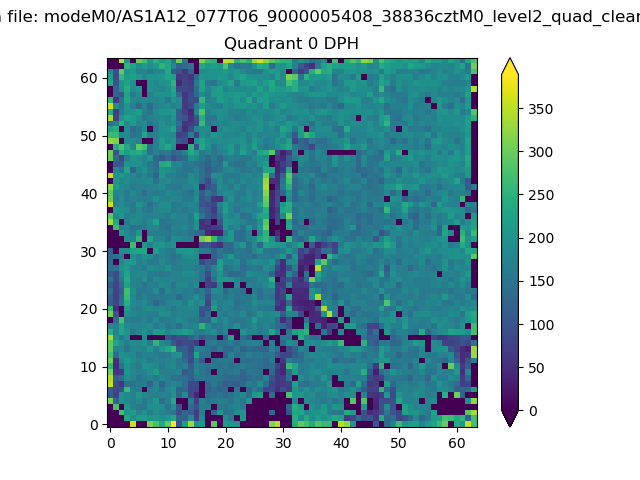 |
 |
Quadrant B |
|---|---|---|---|
| Quadrant D | 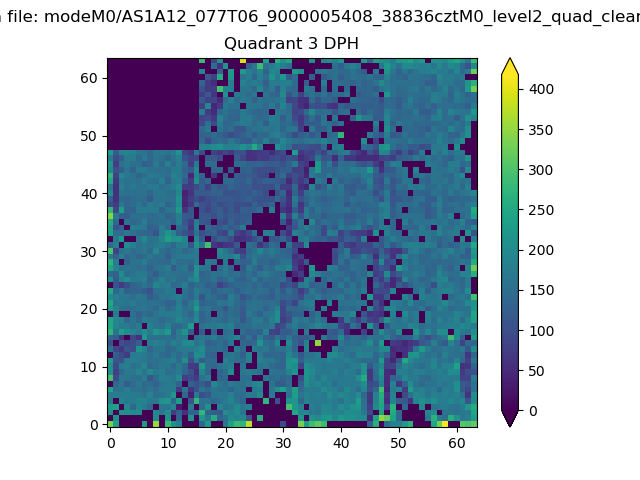 |
 |
Quadrant C |
| Plot type | Count rate plots | Images |
|---|---|---|
| Comparison with Poisson distribution Blue bars denote a histogram of data divided into 1 sec bins. Red curve is a Poisson curve with rate = median count rate of data. |
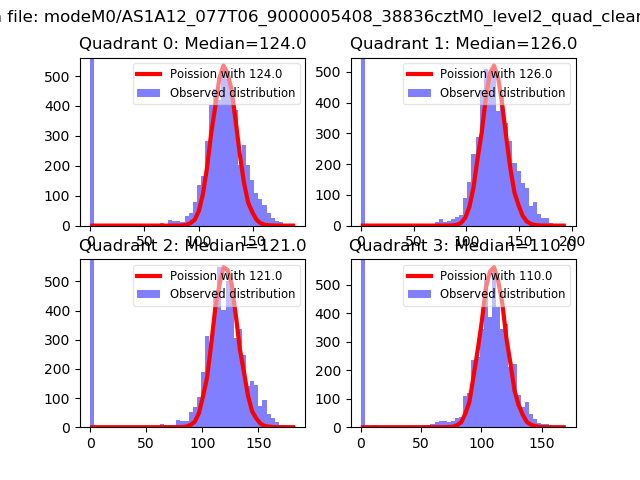 |
 |
| Quadrant-wise count rates Data is divided into 100 sec bins |
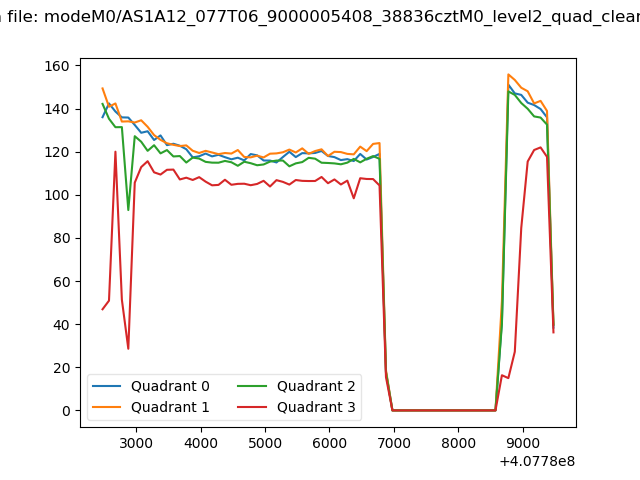 |
|
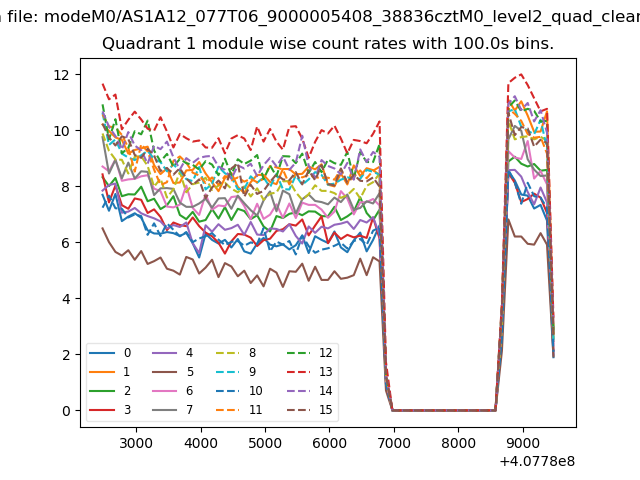
| Module-wise count rates for Quadrant A Data is divided into 100 sec bins |
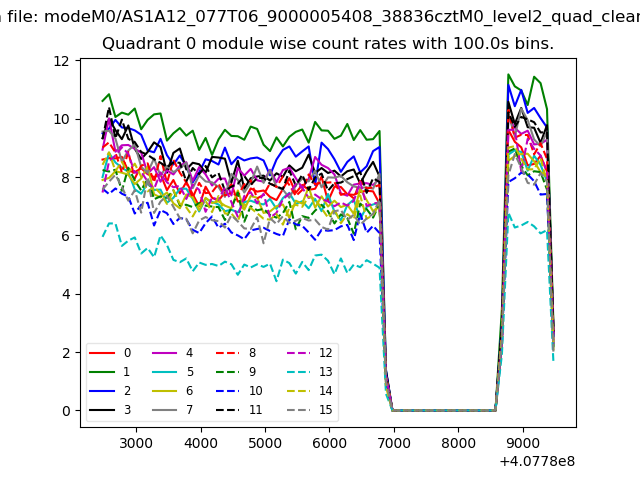 |
 |
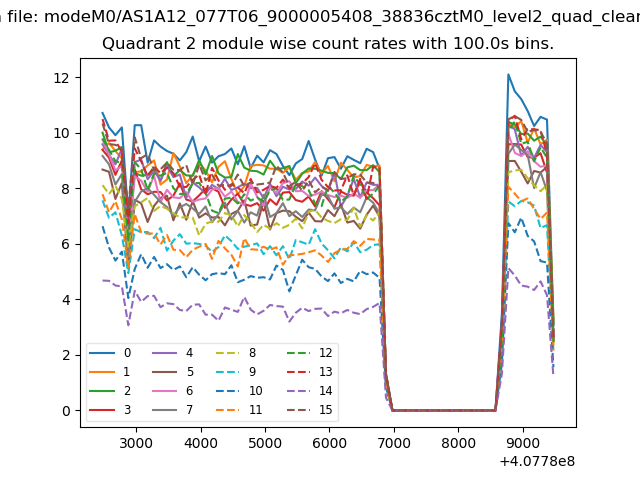
| Module-wise count rates for Quadrant B Data is divided into 100 sec bins |
 |
 |
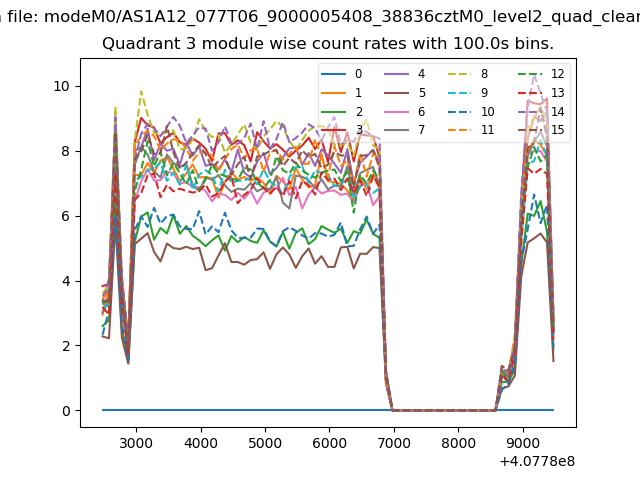
| Module-wise count rates for Quadrant C Data is divided into 100 sec bins |
 |
 |
| Module-wise count rates for Quadrant D Data is divided into 100 sec bins |
 |
 |
| Parameter | Plot |
|---|---|
| CZT HV Monitor | 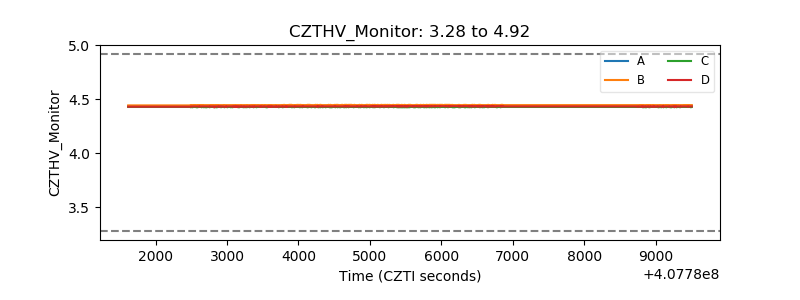 |
| D_VDD | 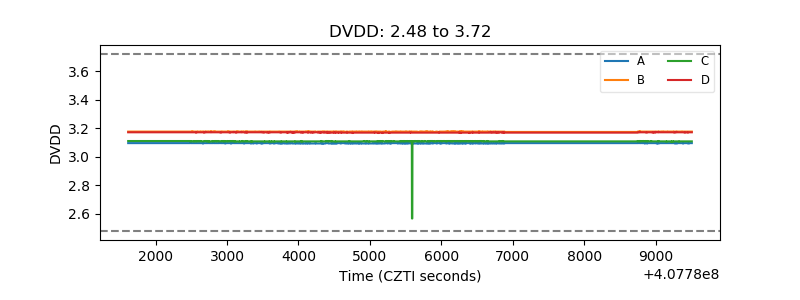 |
| Temperature 1 | 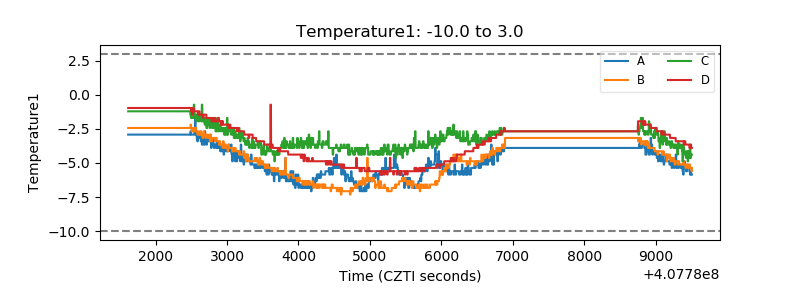 |
| Veto HV Monitor | 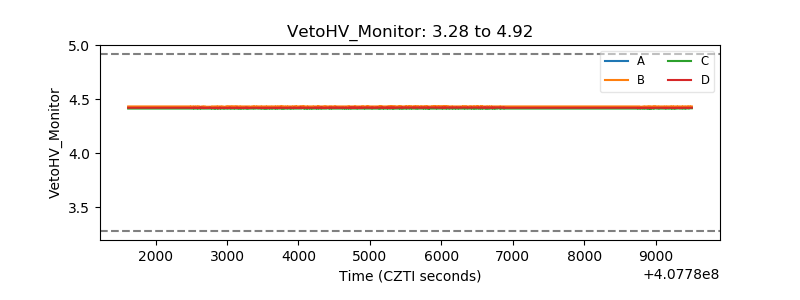 |
| Veto LLD | 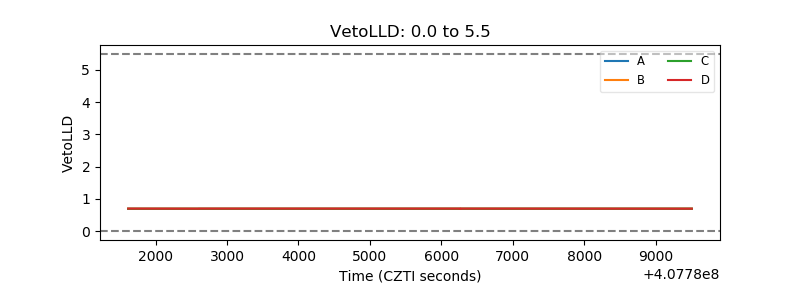 |
| Alpha Counter |  |
| _CPM_Rate | 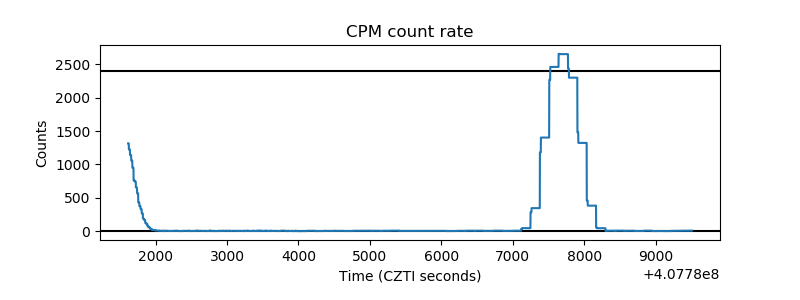 |
| CZT Counter | 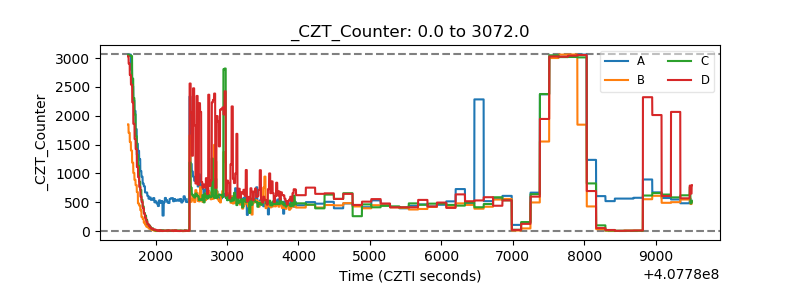 |
| +2.5 Volts monitor | 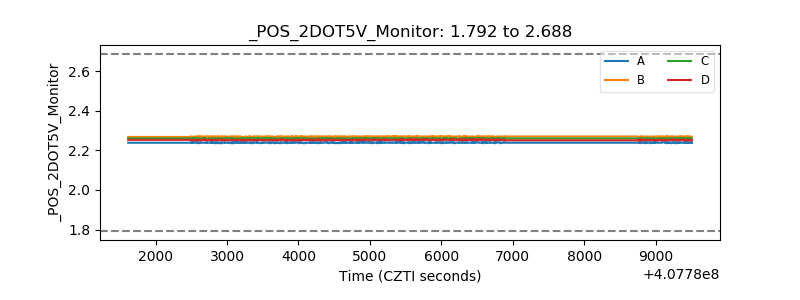 |
| +5 Volts monitor | 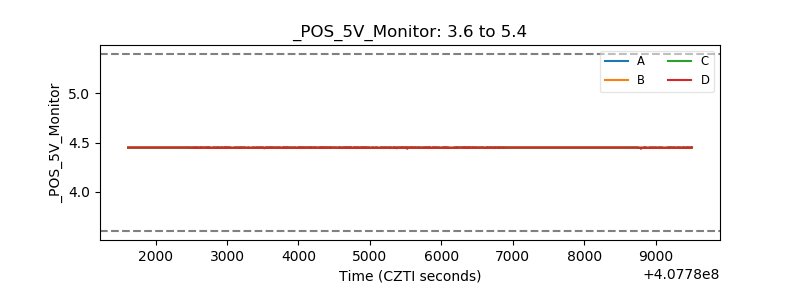 |
| _ROLL_ROT | 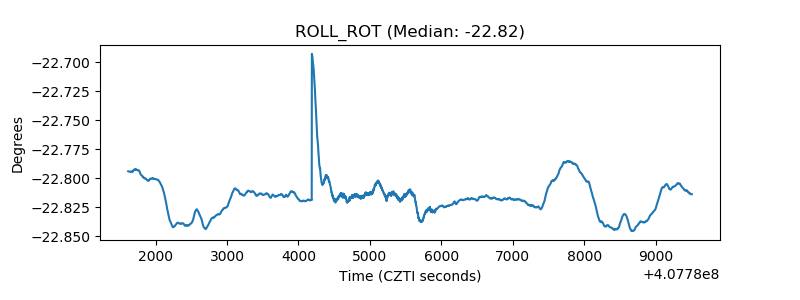 |
| _Roll_DEC | 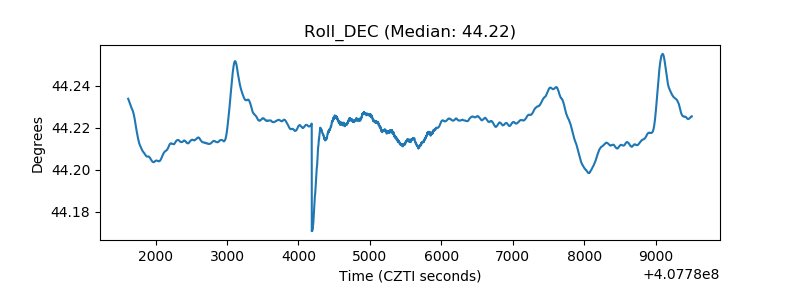 |
| _Roll_RA | 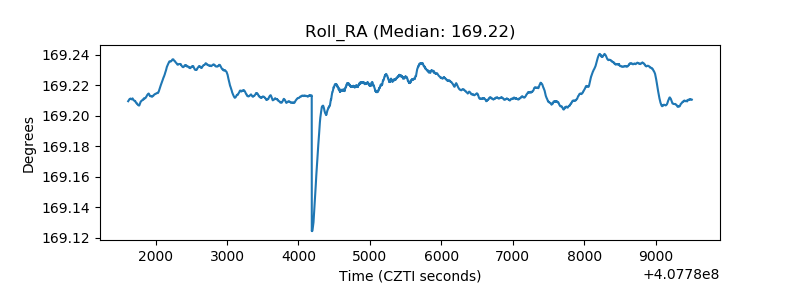 |
| Veto Counter | 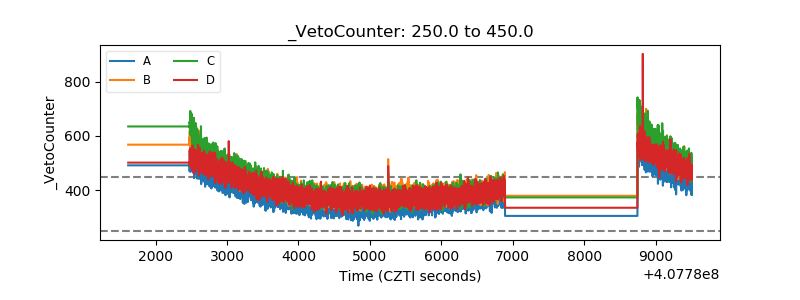 |