| Param | Original file | Final file |
|---|---|---|
| Filename | modeM0/AS1A12_077T06_9000005408_38837cztM0_level2.fits | modeM0/AS1A12_077T06_9000005408_38837cztM0_level2_quad_clean.evt |
| Size (bytes) | 342,046,080 | 97,260,480 |
| Size | 326.2 MB | 92.8 MB |
| Events in quadrant A | 2,988,284 | 668,374 |
| Events in quadrant B | 2,583,314 | 687,318 |
| Events in quadrant C | 2,732,649 | 661,072 |
| Events in quadrant D | 3,955,166 | 566,906 |
| Mode M9 | |||
|---|---|---|---|
| Quadrant | BADHDUFLAG | Total packets | Discarded packets |
| A | 0 | 34 | 0 |
| B | 0 | 34 | 0 |
| C | 0 | 34 | 0 |
| D | 0 | 35 | 0 |
| Mode SS | |||
|---|---|---|---|
| Quadrant | BADHDUFLAG | Total packets | Discarded packets |
| A | 0 | 106 | 0 |
| B | 0 | 106 | 0 |
| C | 0 | 106 | 0 |
| D | 0 | 106 | 0 |
| Mode M0 | |||
|---|---|---|---|
| Quadrant | BADHDUFLAG | Total packets | Discarded packets |
| A | 0 | 12070 | 3 |
| B | 0 | 10895 | 2 |
| C | 0 | 11224 | 2 |
| D | 0 | 15280 | 2 |
| Quadrant | Total seconds | Saturated seconds | Saturation percentage |
|---|---|---|---|
| A | 5162 | 20 | 0.387447% |
| B | 5162 | 27 | 0.523053% |
| C | 5162 | 18 | 0.348702% |
| D | 5162 | 360 | 6.974041% |
Noise dominated data is calculated using 1-second bins in cleaned event files. If a bin has >2000 counts, and if more than 50% of those come from <1% of pixels, then it is considered to be noise-dominated and hence unusable.
| Quadrant | # 1 sec bins | Bins with >0 counts | Bins with >2000 counts | High rate bins dominated by noise | Noise dominated (total time) | Noise dominated (detector-on time) | Marked lightcurve |
|---|---|---|---|---|---|---|---|
| A | 7134 | 5163 | 12 | 12 | 0.17% | 0.23% | 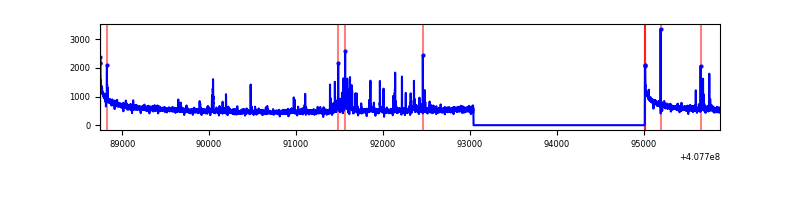 |
| B | 7134 | 5163 | 16 | 16 | 0.22% | 0.31% | 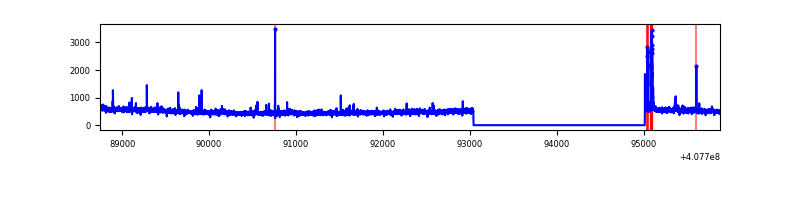 |
| C | 7134 | 5163 | 9 | 9 | 0.13% | 0.17% | 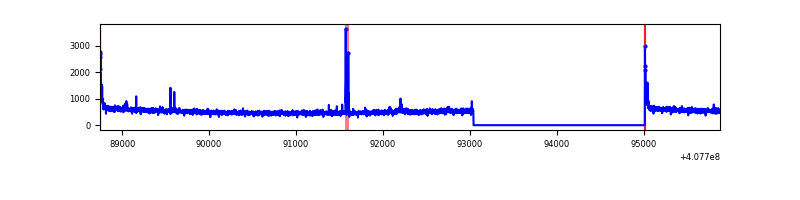 |
| D | 7134 | 5163 | 287 | 287 | 4.02% | 5.56% | 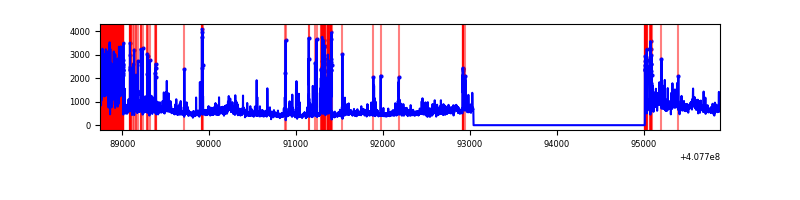 |
Top three noisy pixels from each quadrant. If the there are fewer than three noisy pixels in the level2.evt file, extra rows are filled as -1
| Pixel properties | Quadrant properties | ||||||
|---|---|---|---|---|---|---|---|
| Quadrant | DetID | PixID | Counts | Sigma | Mean | Median | Sigma |
| A | 10 | 83 | 395997 | 3184.28 | 618 | 609 | 124.2 |
| A | 13 | 248 | 117364 | 940.29 | 618 | 609 | 124.2 |
| A | 9 | 143 | 67010 | 534.76 | 618 | 609 | 124.2 |
| B | 5 | 184 | 70223 | 589.41 | 620 | 603 | 118.1 |
| B | 0 | 230 | 27840 | 230.59 | 620 | 603 | 118.1 |
| B | 5 | 172 | 15034 | 122.17 | 620 | 603 | 118.1 |
| C | 15 | 214 | 212944 | 1487.05 | 615 | 621 | 142.8 |
| C | 0 | 10 | 59609 | 413.13 | 615 | 621 | 142.8 |
| C | 3 | 233 | 27885 | 190.95 | 615 | 621 | 142.8 |
| D | 2 | 249 | 578140 | 4027.3 | 585 | 567 | 143.4 |
| D | 12 | 235 | 459259 | 3198.36 | 585 | 567 | 143.4 |
| D | 13 | 249 | 205541 | 1429.24 | 585 | 567 | 143.4 |
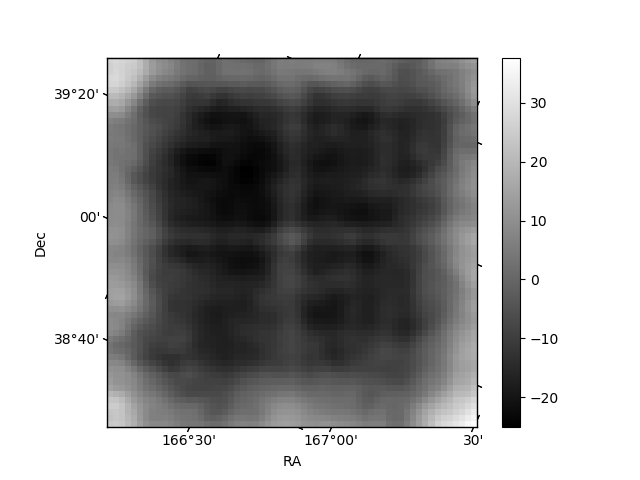
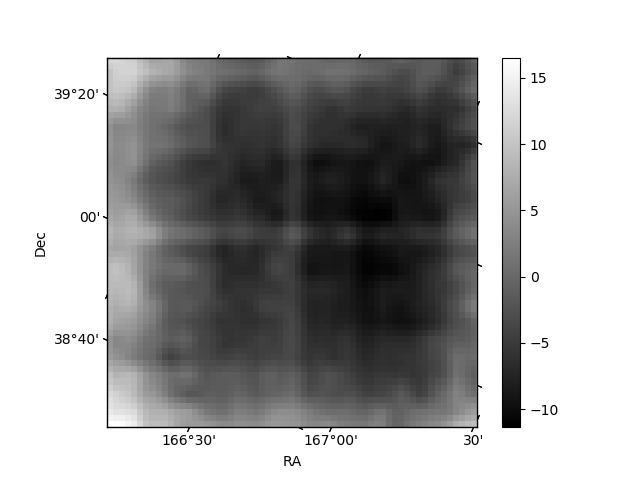
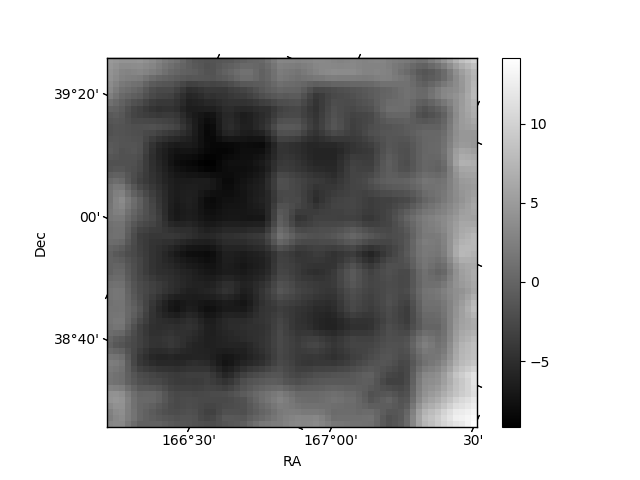
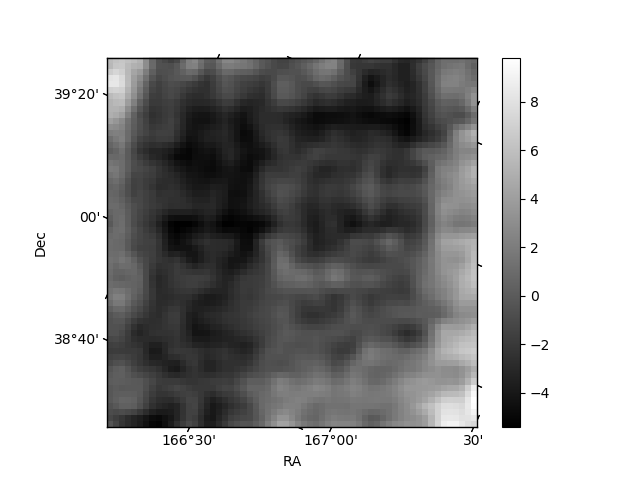
Histogram calculated using DETX and DETY for each event in the final _common_clean file
| Quadrant A | 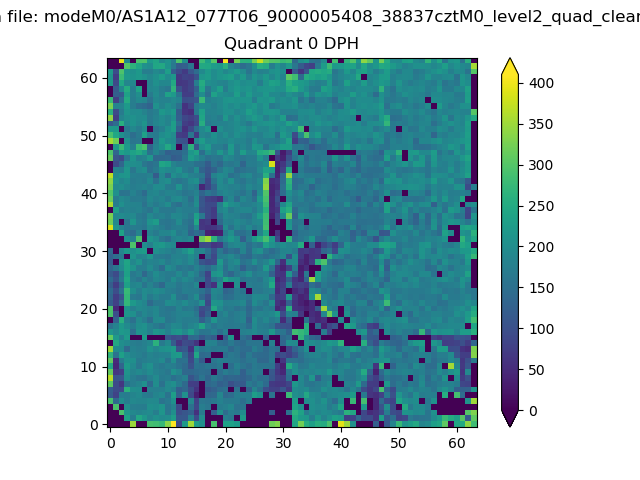 |
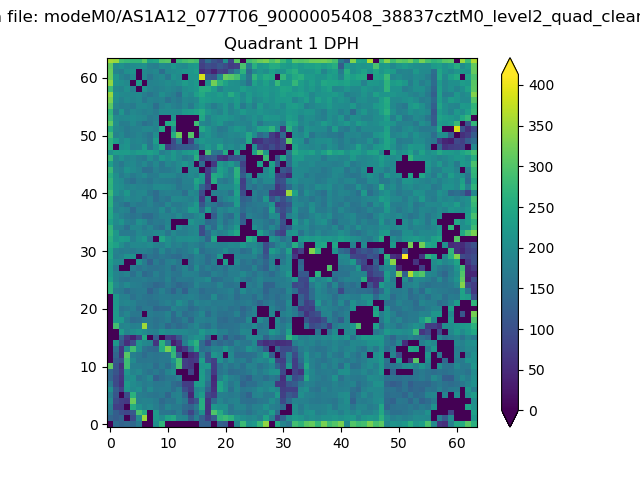 |
Quadrant B |
|---|---|---|---|
| Quadrant D | 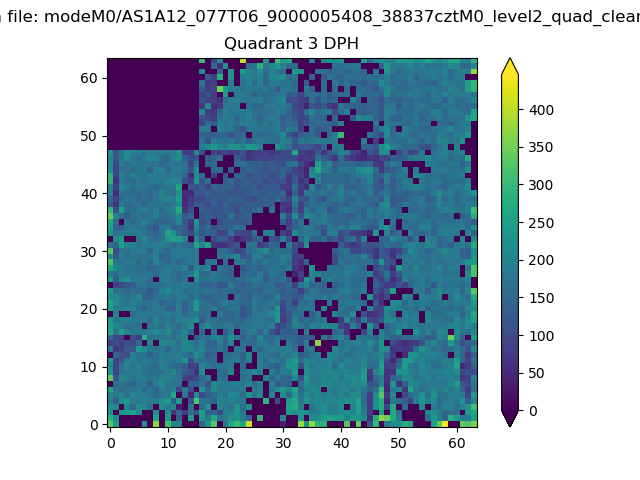 |
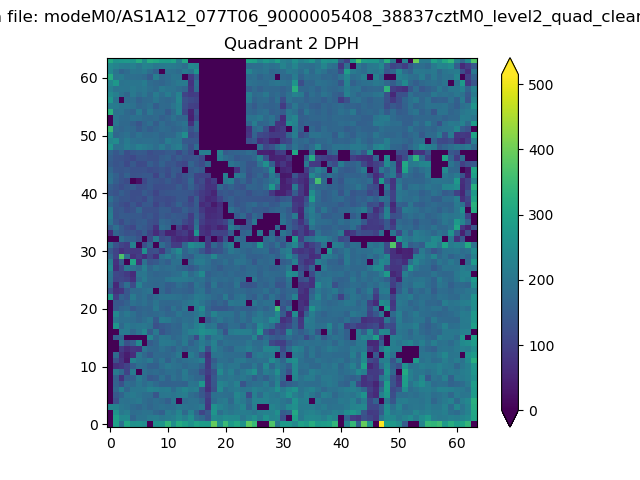 |
Quadrant C |
| Plot type | Count rate plots | Images |
|---|---|---|
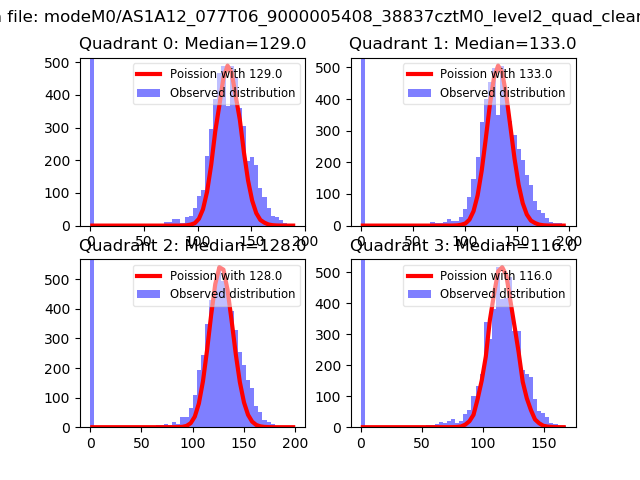
| Comparison with Poisson distribution Blue bars denote a histogram of data divided into 1 sec bins. Red curve is a Poisson curve with rate = median count rate of data. |
 |
 |
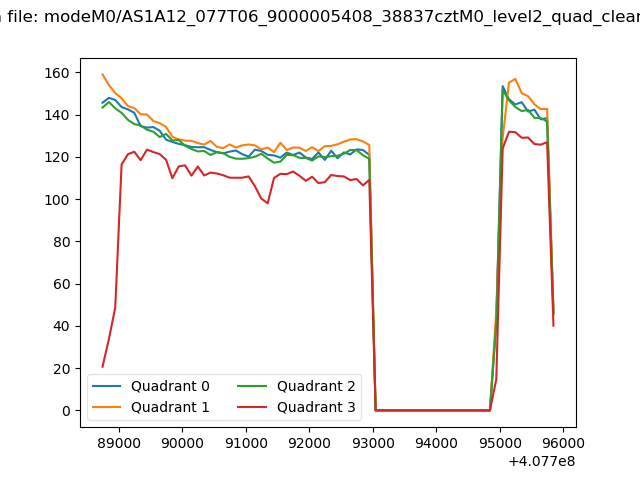
| Quadrant-wise count rates Data is divided into 100 sec bins |
 |
|
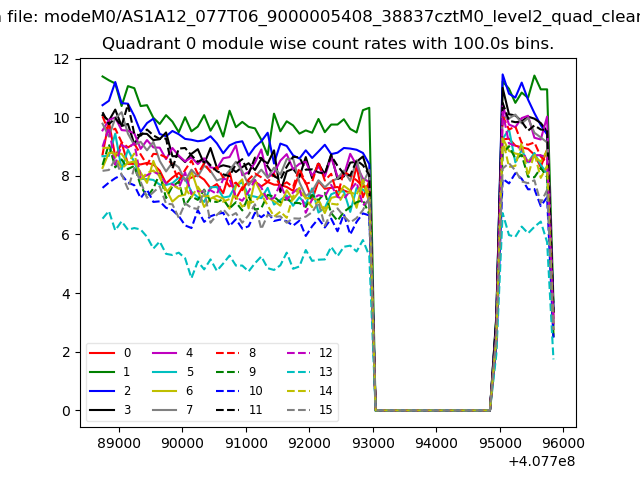
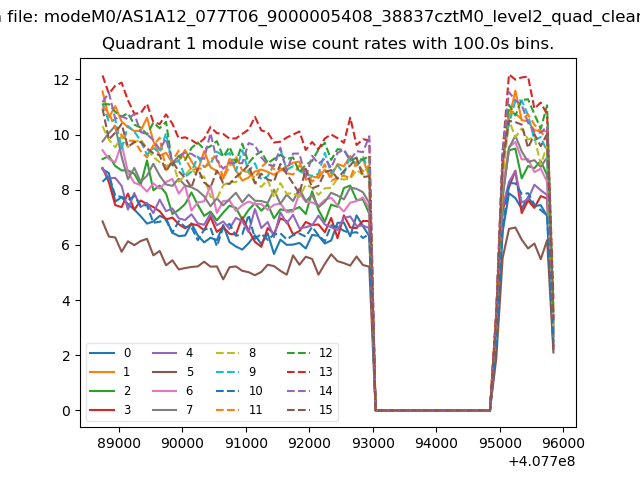
| Module-wise count rates for Quadrant A Data is divided into 100 sec bins |
 |
 |
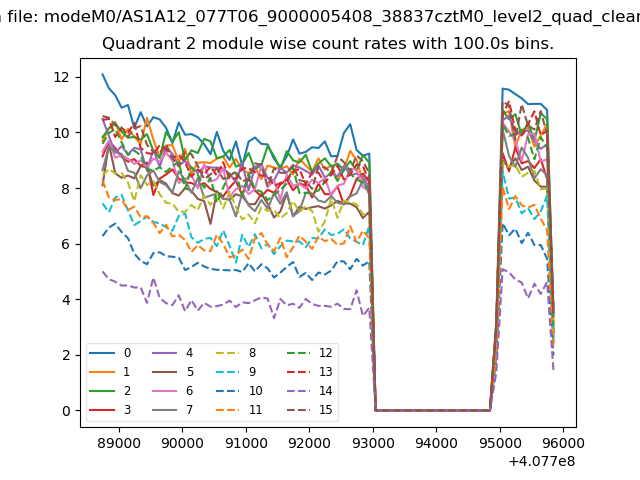
| Module-wise count rates for Quadrant B Data is divided into 100 sec bins |
 |
 |
| Module-wise count rates for Quadrant C Data is divided into 100 sec bins |
 |
 |
| Module-wise count rates for Quadrant D Data is divided into 100 sec bins |
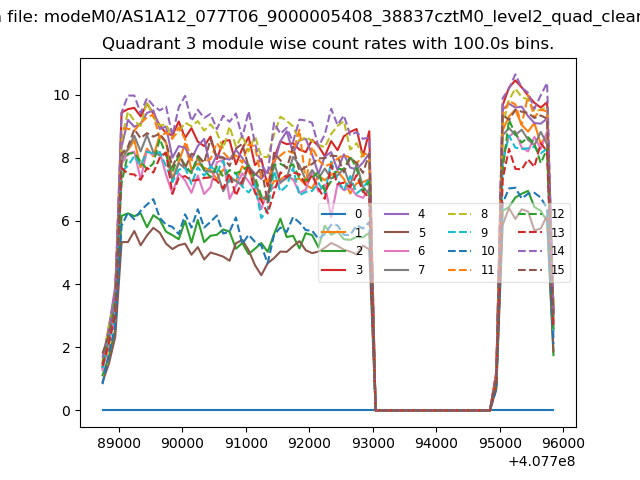 |
 |
| Parameter | Plot |
|---|---|
| CZT HV Monitor | 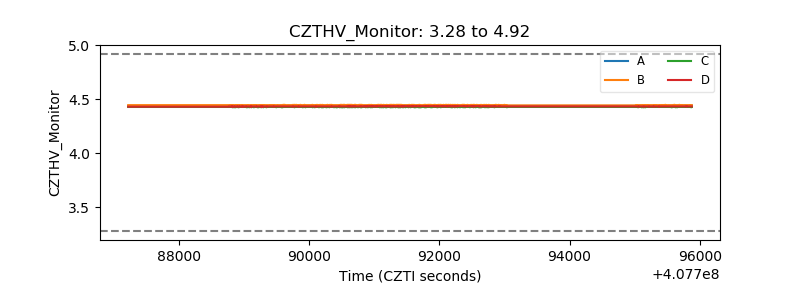 |
| D_VDD | 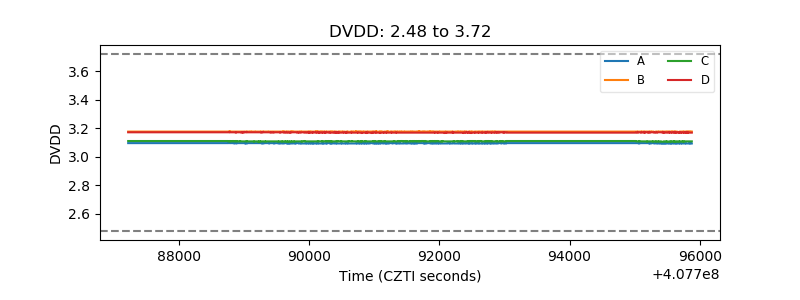 |
| Temperature 1 | 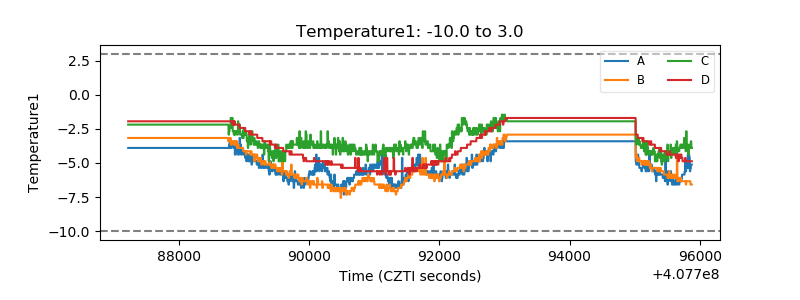 |
| Veto HV Monitor | 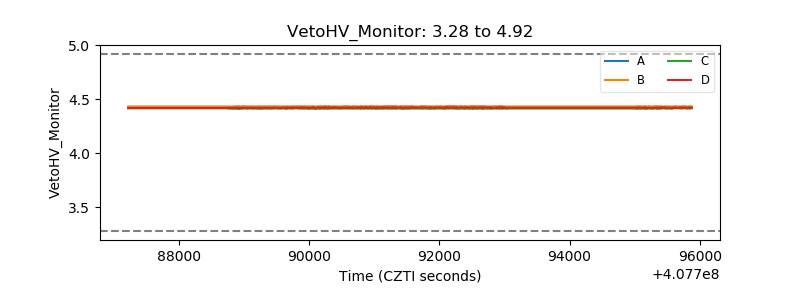 |
| Veto LLD | 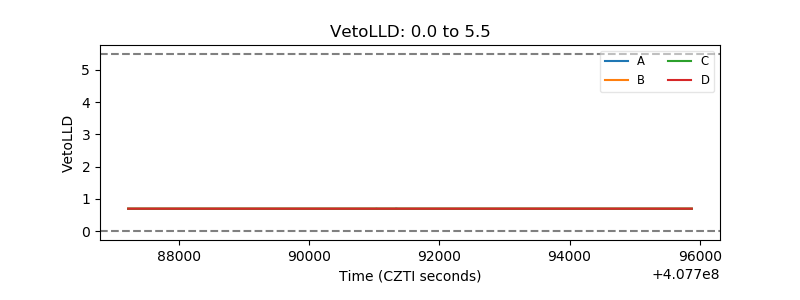 |
| Alpha Counter | 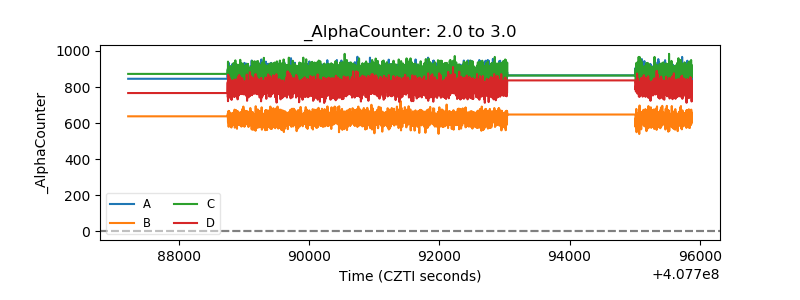 |
| _CPM_Rate | 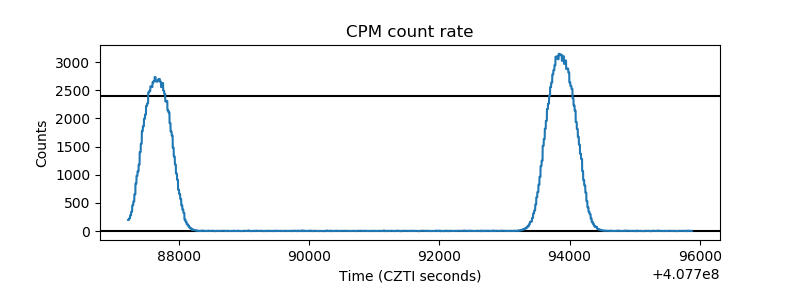 |
| CZT Counter | 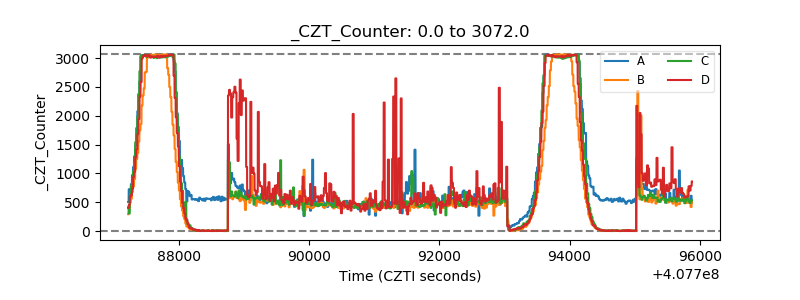 |
| +2.5 Volts monitor | 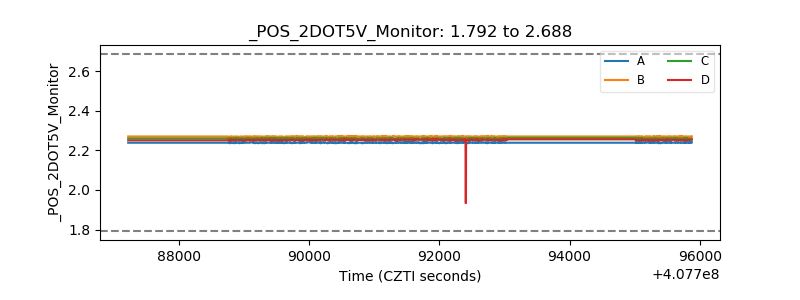 |
| +5 Volts monitor | 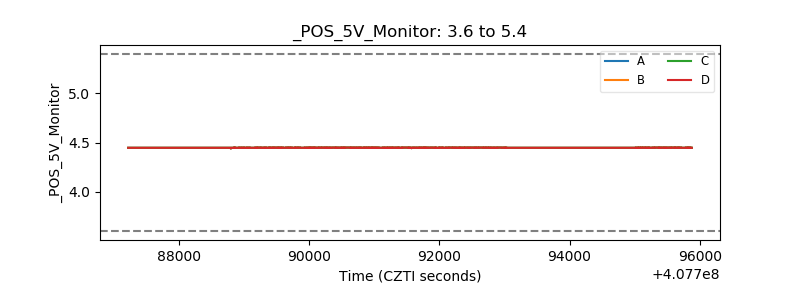 |
| _ROLL_ROT | 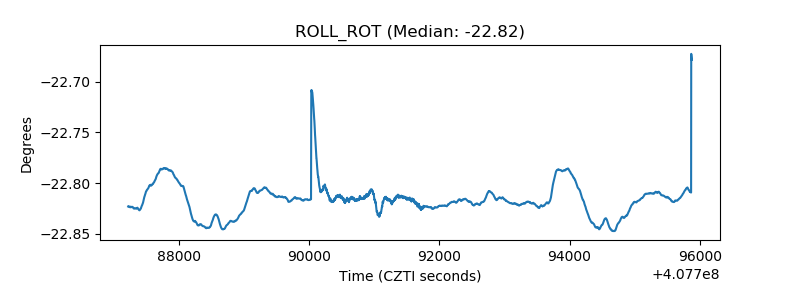 |
| _Roll_DEC | 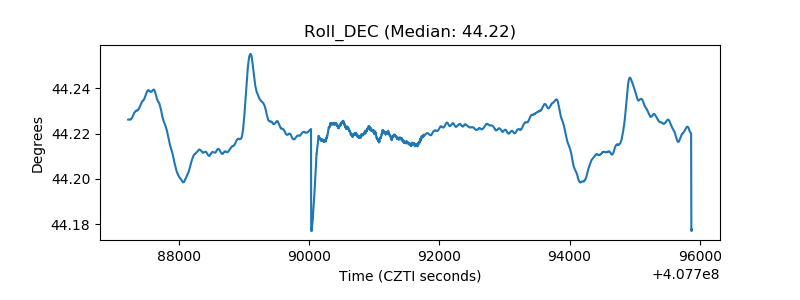 |
| _Roll_RA | 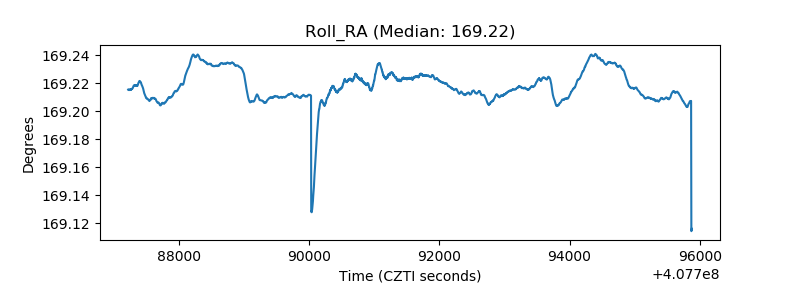 |
| Veto Counter | 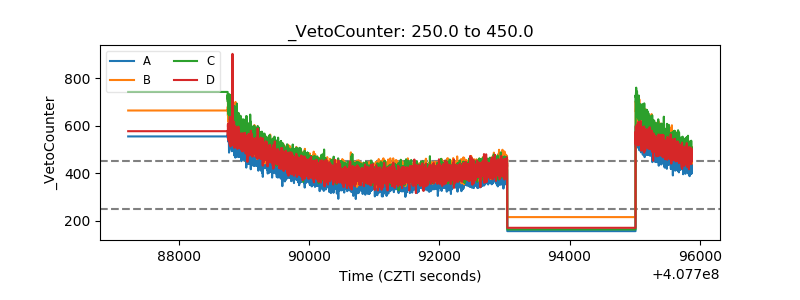 |