| Param | Original file | Final file |
|---|---|---|
| Filename | modeM0/AS1A12_077T06_9000005408_38838cztM0_level2.fits | modeM0/AS1A12_077T06_9000005408_38838cztM0_level2_quad_clean.evt |
| Size (bytes) | 329,621,760 | 95,647,680 |
| Size | 314.4 MB | 91.2 MB |
| Events in quadrant A | 2,749,103 | 651,302 |
| Events in quadrant B | 2,470,600 | 673,394 |
| Events in quadrant C | 2,577,887 | 646,721 |
| Events in quadrant D | 4,014,231 | 574,335 |
| Mode M9 | |||
|---|---|---|---|
| Quadrant | BADHDUFLAG | Total packets | Discarded packets |
| A | 0 | 25 | 0 |
| B | 0 | 25 | 0 |
| C | 0 | 25 | 0 |
| D | 0 | 26 | 0 |
| Mode SS | |||
|---|---|---|---|
| Quadrant | BADHDUFLAG | Total packets | Discarded packets |
| A | 0 | 102 | 0 |
| B | 0 | 102 | 0 |
| C | 0 | 102 | 0 |
| D | 0 | 102 | 0 |
| Mode M0 | |||
|---|---|---|---|
| Quadrant | BADHDUFLAG | Total packets | Discarded packets |
| A | 0 | 11175 | 3 |
| B | 0 | 10392 | 2 |
| C | 0 | 10586 | 2 |
| D | 0 | 15455 | 2 |
| Quadrant | Total seconds | Saturated seconds | Saturation percentage |
|---|---|---|---|
| A | 5005 | 17 | 0.339660% |
| B | 5005 | 25 | 0.499500% |
| C | 5005 | 14 | 0.279720% |
| D | 5005 | 202 | 4.035964% |
Noise dominated data is calculated using 1-second bins in cleaned event files. If a bin has >2000 counts, and if more than 50% of those come from <1% of pixels, then it is considered to be noise-dominated and hence unusable.
| Quadrant | # 1 sec bins | Bins with >0 counts | Bins with >2000 counts | High rate bins dominated by noise | Noise dominated (total time) | Noise dominated (detector-on time) | Marked lightcurve |
|---|---|---|---|---|---|---|---|
| A | 7097 | 5006 | 13 | 13 | 0.18% | 0.26% | 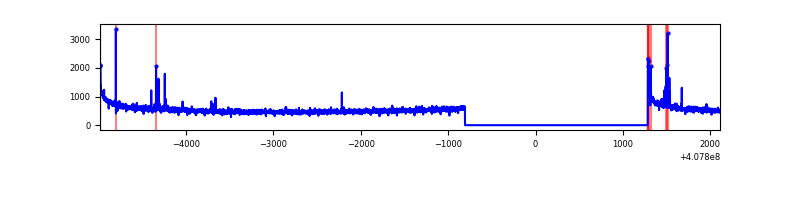 |
| B | 7097 | 5006 | 15 | 15 | 0.21% | 0.30% | 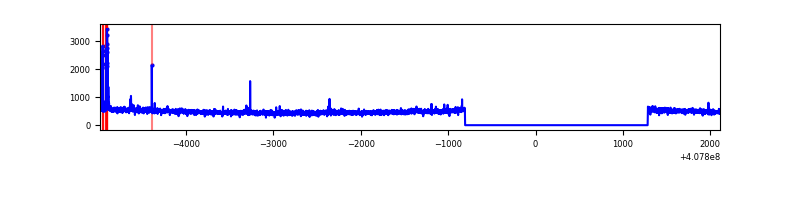 |
| C | 7097 | 5006 | 8 | 8 | 0.11% | 0.16% | 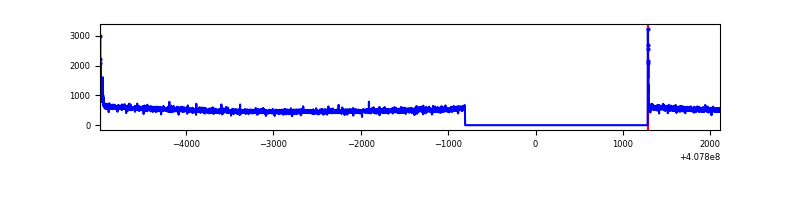 |
| D | 7097 | 5006 | 203 | 203 | 2.86% | 4.06% | 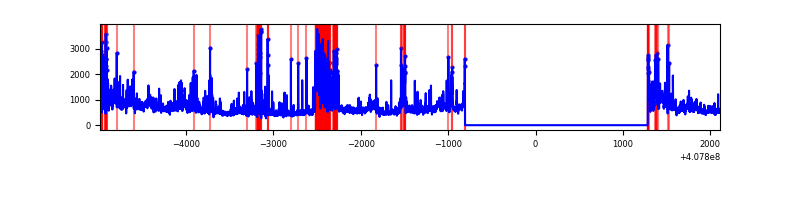 |
Top three noisy pixels from each quadrant. If the there are fewer than three noisy pixels in the level2.evt file, extra rows are filled as -1
| Pixel properties | Quadrant properties | ||||||
|---|---|---|---|---|---|---|---|
| Quadrant | DetID | PixID | Counts | Sigma | Mean | Median | Sigma |
| A | 10 | 83 | 385987 | 3223.74 | 595 | 585 | 119.6 |
| A | 13 | 248 | 31880 | 261.77 | 595 | 585 | 119.6 |
| A | 9 | 143 | 18570 | 150.44 | 595 | 585 | 119.6 |
| B | 5 | 184 | 62862 | 545.86 | 600 | 584 | 114.1 |
| B | 0 | 230 | 26380 | 226.1 | 600 | 584 | 114.1 |
| B | 12 | 111 | 14063 | 118.14 | 600 | 584 | 114.1 |
| C | 15 | 214 | 206790 | 1501.52 | 593 | 598 | 137.3 |
| C | 0 | 10 | 48145 | 346.24 | 593 | 598 | 137.3 |
| C | 14 | 254 | 4170 | 26.01 | 593 | 598 | 137.3 |
| D | 13 | 249 | 454031 | 3254.31 | 576 | 560 | 139.3 |
| D | 12 | 235 | 445576 | 3193.63 | 576 | 560 | 139.3 |
| D | 12 | 227 | 369577 | 2648.23 | 576 | 560 | 139.3 |
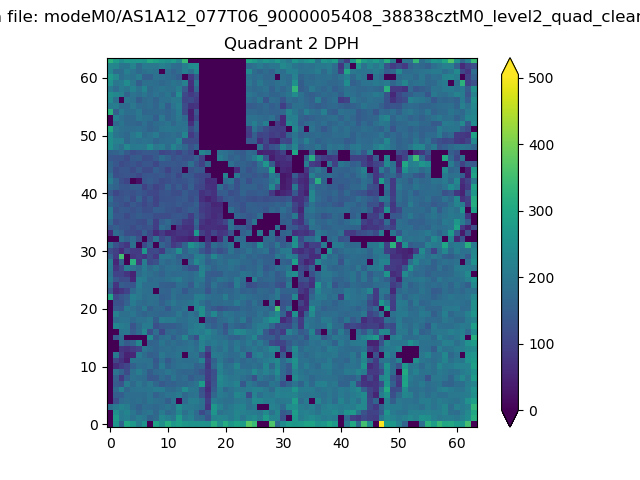
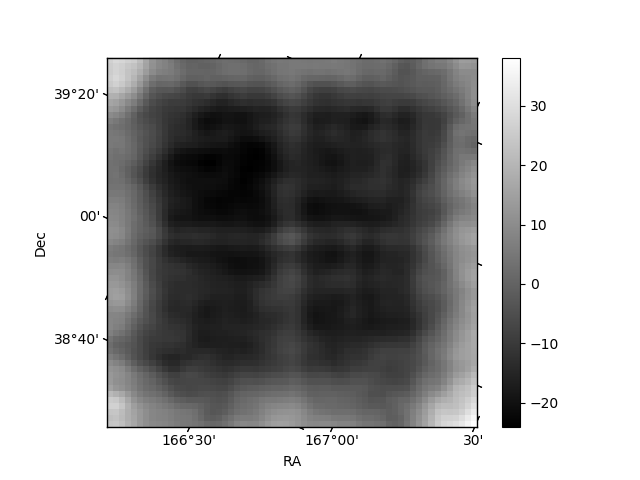
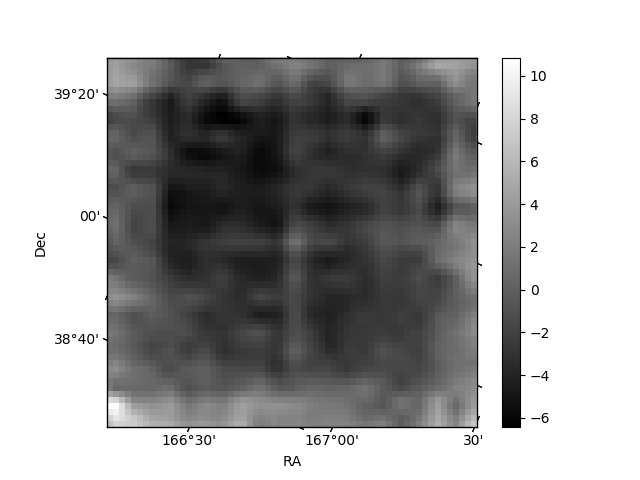
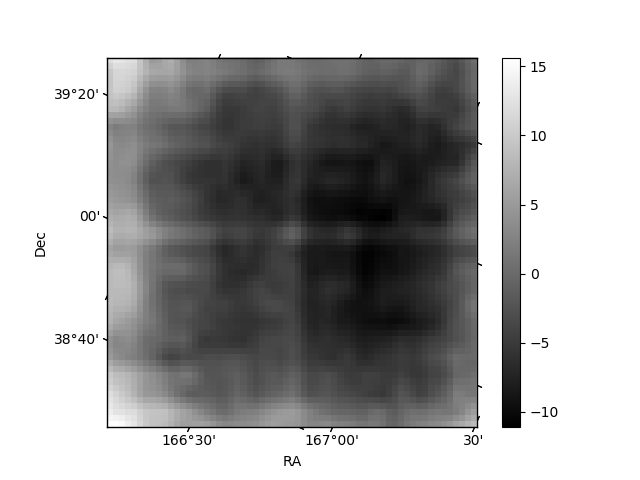
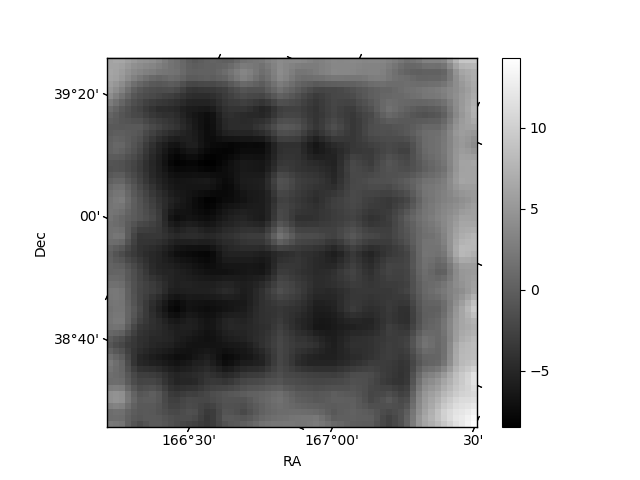
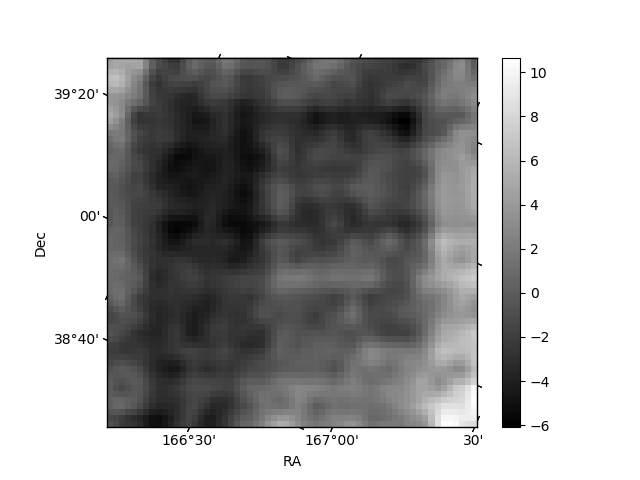
Histogram calculated using DETX and DETY for each event in the final _common_clean file
| Quadrant A | 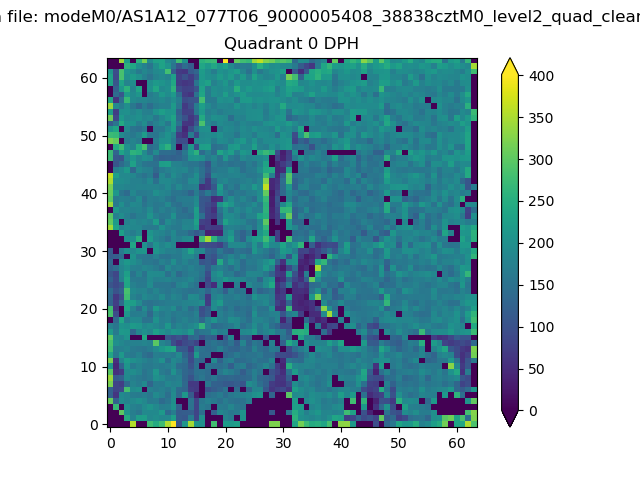 |
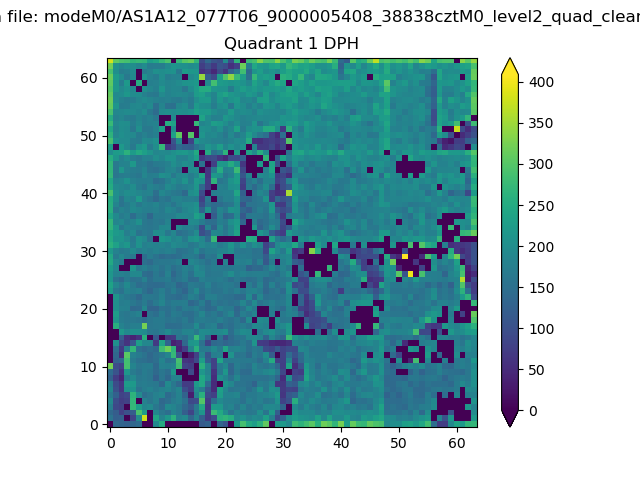 |
Quadrant B |
|---|---|---|---|
| Quadrant D | 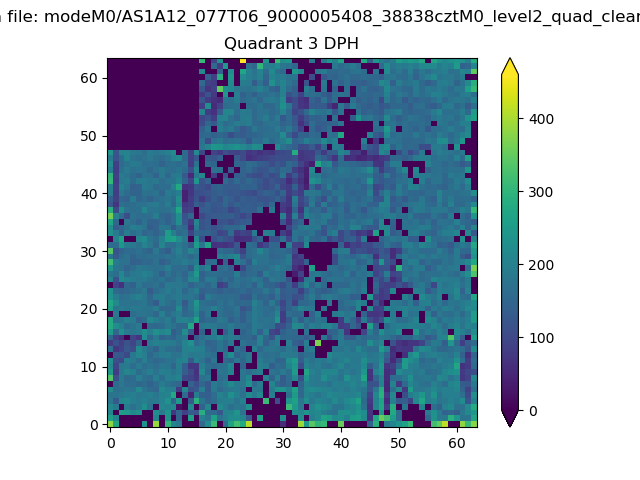 |
 |
Quadrant C |
| Plot type | Count rate plots | Images |
|---|---|---|
| Comparison with Poisson distribution Blue bars denote a histogram of data divided into 1 sec bins. Red curve is a Poisson curve with rate = median count rate of data. |
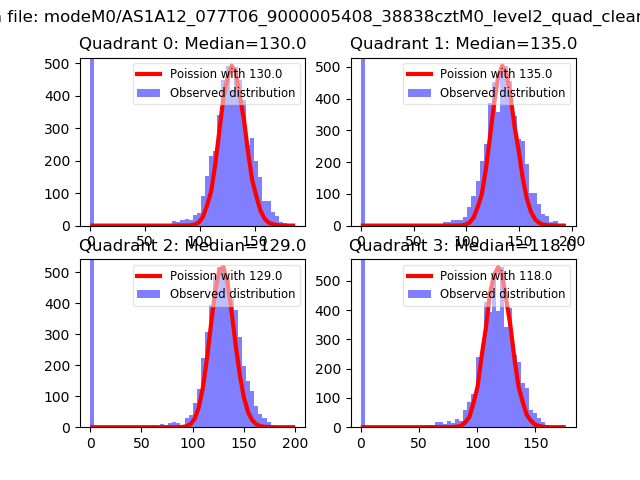 |
 |
| Quadrant-wise count rates Data is divided into 100 sec bins |
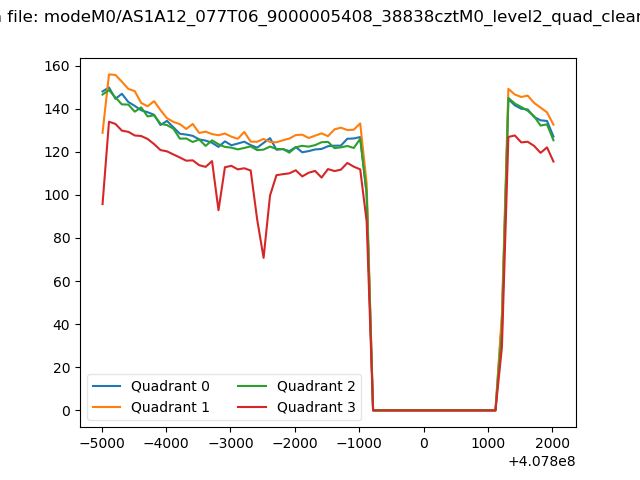 |
|
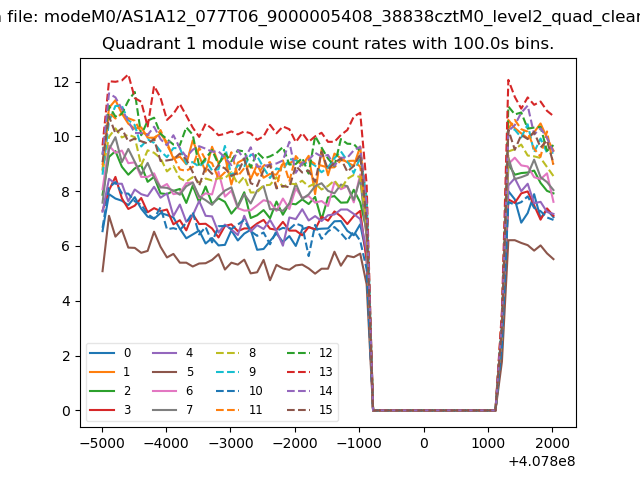
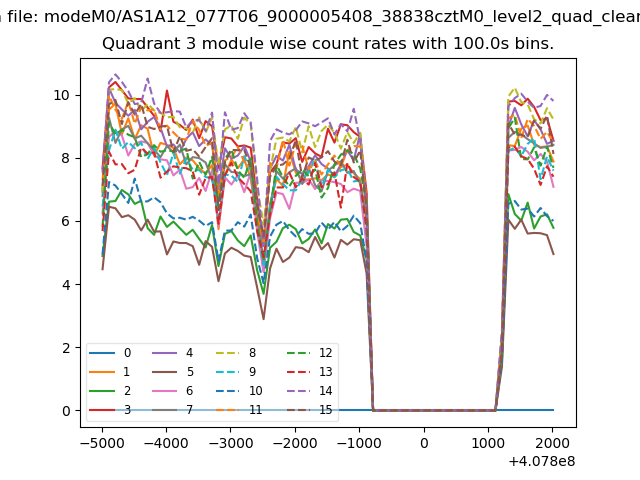
| Module-wise count rates for Quadrant A Data is divided into 100 sec bins |
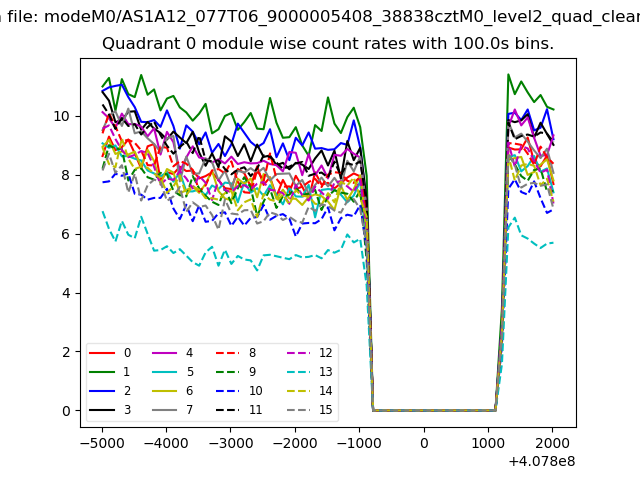 |
 |
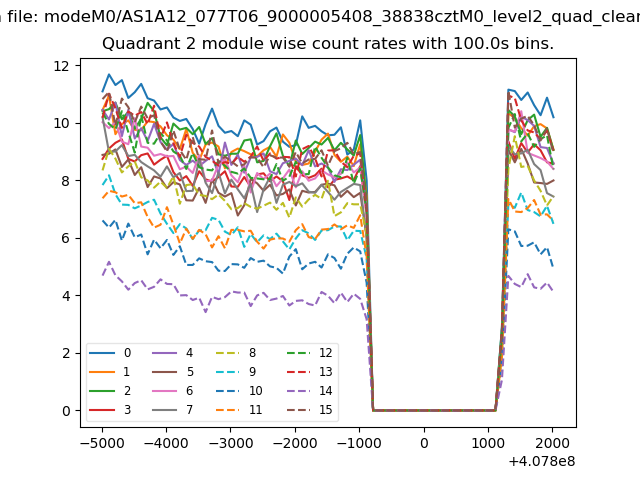
| Module-wise count rates for Quadrant B Data is divided into 100 sec bins |
 |
 |
| Module-wise count rates for Quadrant C Data is divided into 100 sec bins |
 |
 |
| Module-wise count rates for Quadrant D Data is divided into 100 sec bins |
 |
 |
| Parameter | Plot |
|---|---|
| CZT HV Monitor | 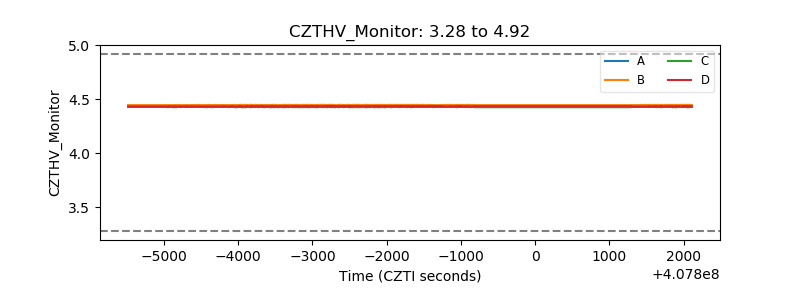 |
| D_VDD | 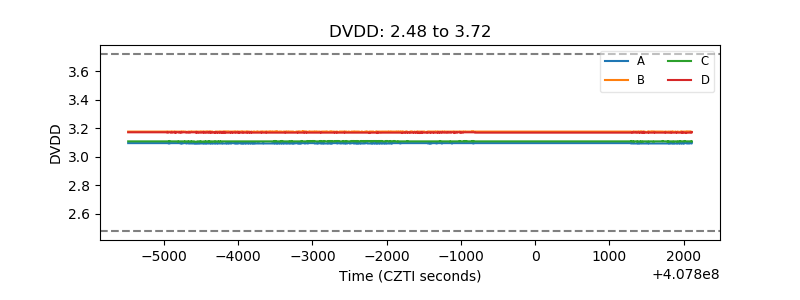 |
| Temperature 1 | 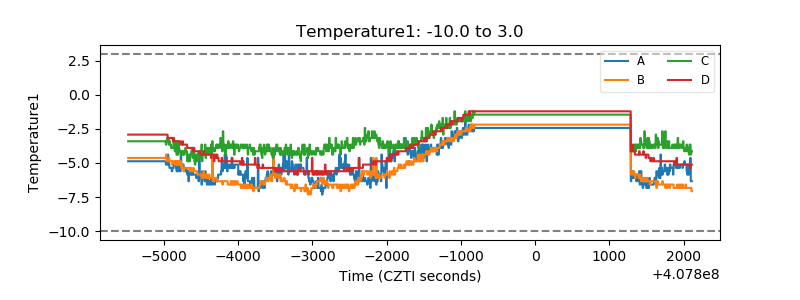 |
| Veto HV Monitor | 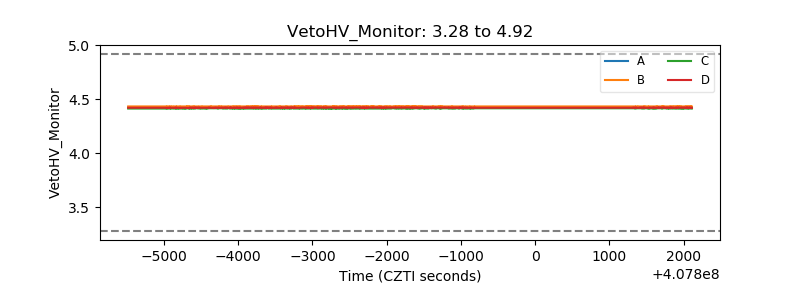 |
| Veto LLD | 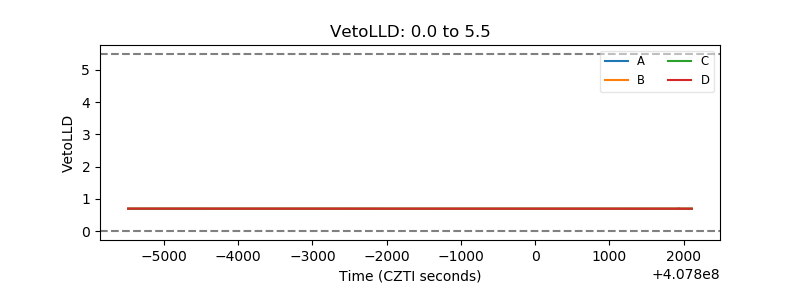 |
| Alpha Counter | 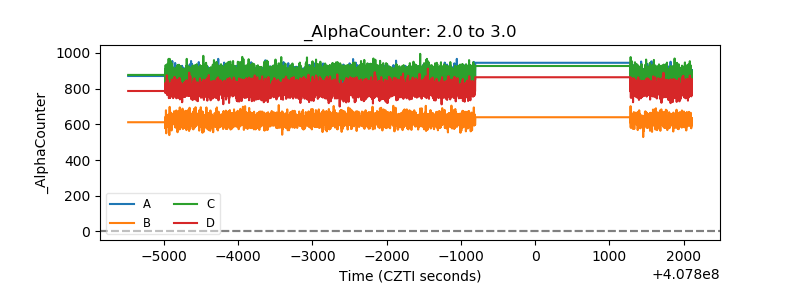 |
| _CPM_Rate | 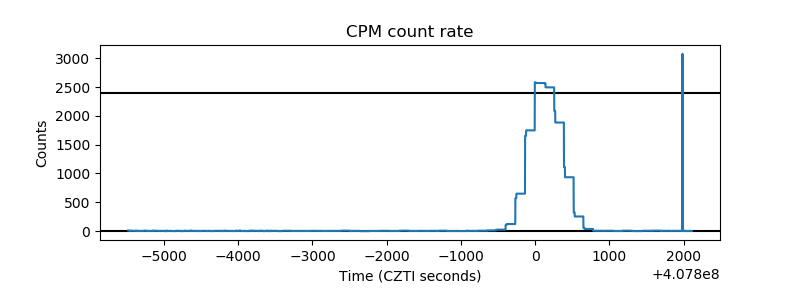 |
| CZT Counter | 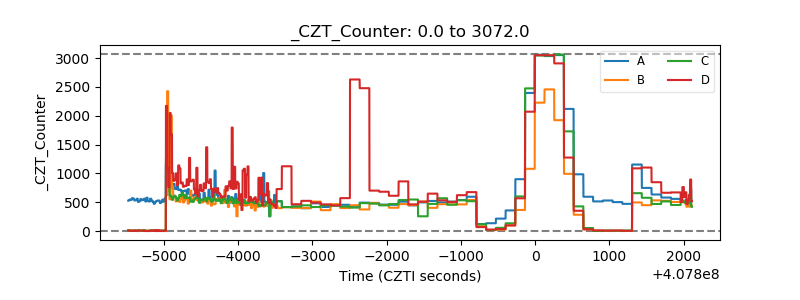 |
| +2.5 Volts monitor | 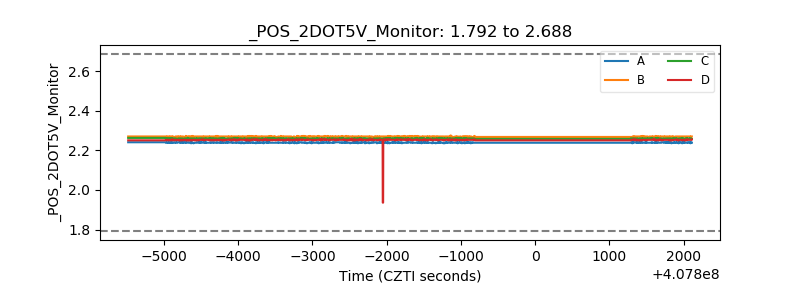 |
| +5 Volts monitor | 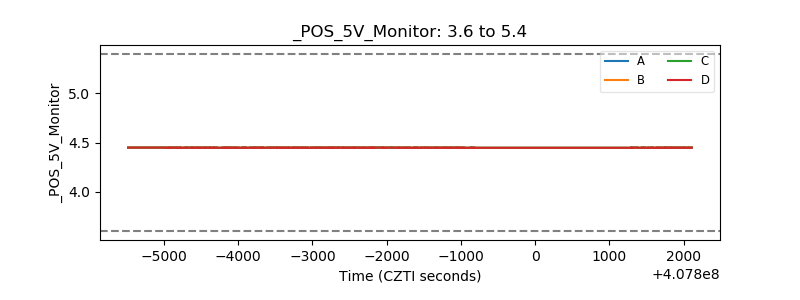 |
| _ROLL_ROT | 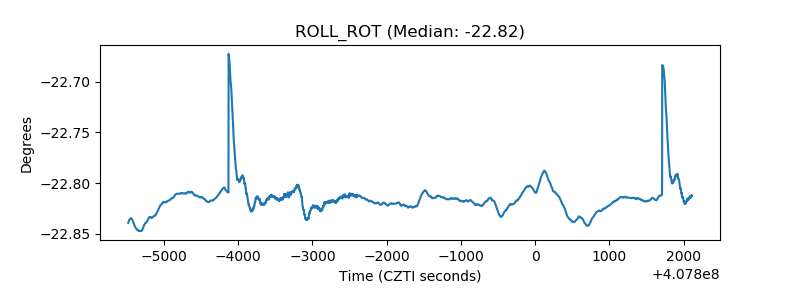 |
| _Roll_DEC | 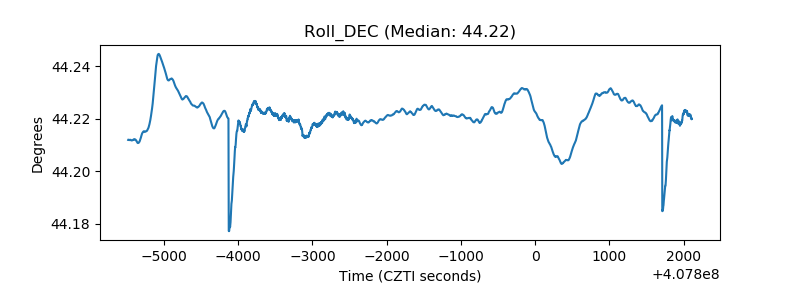 |
| _Roll_RA | 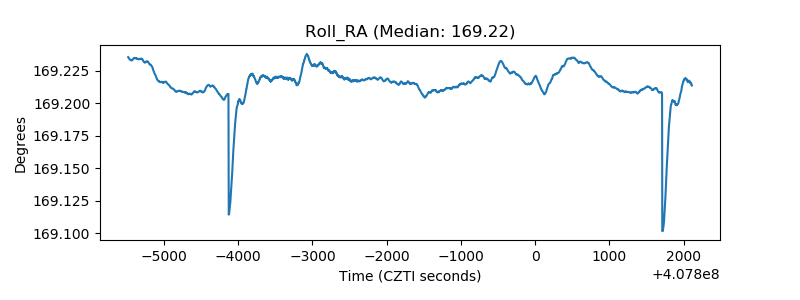 |
| Veto Counter | 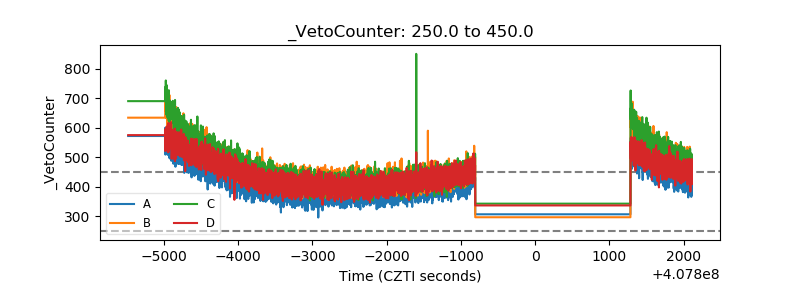 |