| Param | Original file | Final file |
|---|---|---|
| Filename | modeM0/AS1A12_077T06_9000005408_38839cztM0_level2.fits | modeM0/AS1A12_077T06_9000005408_38839cztM0_level2_quad_clean.evt |
| Size (bytes) | 311,927,040 | 91,621,440 |
| Size | 297.5 MB | 87.4 MB |
| Events in quadrant A | 2,665,100 | 621,126 |
| Events in quadrant B | 2,309,807 | 645,728 |
| Events in quadrant C | 2,467,171 | 615,169 |
| Events in quadrant D | 3,719,822 | 546,674 |
| Mode M9 | |||
|---|---|---|---|
| Quadrant | BADHDUFLAG | Total packets | Discarded packets |
| A | 0 | 32 | 0 |
| B | 0 | 32 | 0 |
| C | 0 | 32 | 0 |
| D | 0 | 33 | 0 |
| Mode SS | |||
|---|---|---|---|
| Quadrant | BADHDUFLAG | Total packets | Discarded packets |
| A | 0 | 100 | 0 |
| B | 0 | 100 | 0 |
| C | 0 | 100 | 0 |
| D | 0 | 100 | 0 |
| Mode M0 | |||
|---|---|---|---|
| Quadrant | BADHDUFLAG | Total packets | Discarded packets |
| A | 0 | 10886 | 3 |
| B | 0 | 10037 | 2 |
| C | 0 | 10280 | 2 |
| D | 0 | 14434 | 2 |
| Quadrant | Total seconds | Saturated seconds | Saturation percentage |
|---|---|---|---|
| A | 4935 | 15 | 0.303951% |
| B | 4935 | 14 | 0.283688% |
| C | 4935 | 18 | 0.364742% |
| D | 4935 | 149 | 3.019250% |
Noise dominated data is calculated using 1-second bins in cleaned event files. If a bin has >2000 counts, and if more than 50% of those come from <1% of pixels, then it is considered to be noise-dominated and hence unusable.
| Quadrant | # 1 sec bins | Bins with >0 counts | Bins with >2000 counts | High rate bins dominated by noise | Noise dominated (total time) | Noise dominated (detector-on time) | Marked lightcurve |
|---|---|---|---|---|---|---|---|
| A | 7088 | 4936 | 9 | 9 | 0.13% | 0.18% | 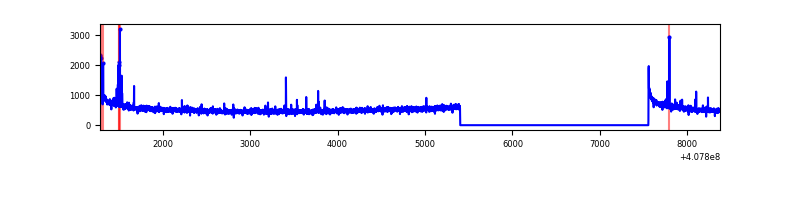 |
| B | 7088 | 4936 | 7 | 7 | 0.10% | 0.14% | 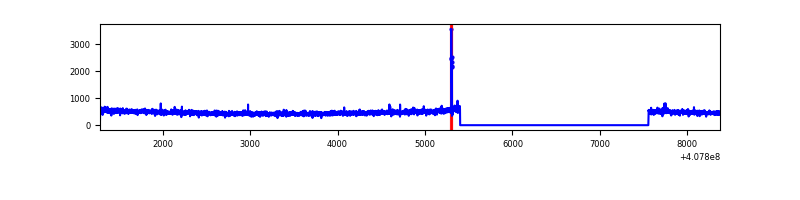 |
| C | 7088 | 4936 | 12 | 12 | 0.17% | 0.24% |  |
| D | 7088 | 4936 | 136 | 136 | 1.92% | 2.76% | 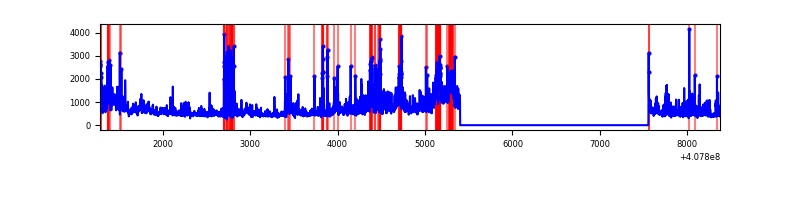 |
Top three noisy pixels from each quadrant. If the there are fewer than three noisy pixels in the level2.evt file, extra rows are filled as -1
| Pixel properties | Quadrant properties | ||||||
|---|---|---|---|---|---|---|---|
| Quadrant | DetID | PixID | Counts | Sigma | Mean | Median | Sigma |
| A | 10 | 83 | 382077 | 3291.86 | 572 | 562 | 115.9 |
| A | 13 | 248 | 31242 | 264.72 | 572 | 562 | 115.9 |
| A | 9 | 143 | 19759 | 165.64 | 572 | 562 | 115.9 |
| B | 5 | 172 | 26703 | 241.22 | 574 | 559 | 108.4 |
| B | 12 | 111 | 13719 | 121.42 | 574 | 559 | 108.4 |
| B | 0 | 190 | 13094 | 115.65 | 574 | 559 | 108.4 |
| C | 15 | 214 | 203024 | 1550.02 | 564 | 569 | 130.6 |
| C | 0 | 10 | 23075 | 172.31 | 564 | 569 | 130.6 |
| C | 1 | 23 | 18626 | 138.25 | 564 | 569 | 130.6 |
| D | 12 | 227 | 665392 | 4956.26 | 550 | 535 | 134.1 |
| D | 12 | 235 | 368989 | 2746.69 | 550 | 535 | 134.1 |
| D | 5 | 222 | 186666 | 1387.54 | 550 | 535 | 134.1 |
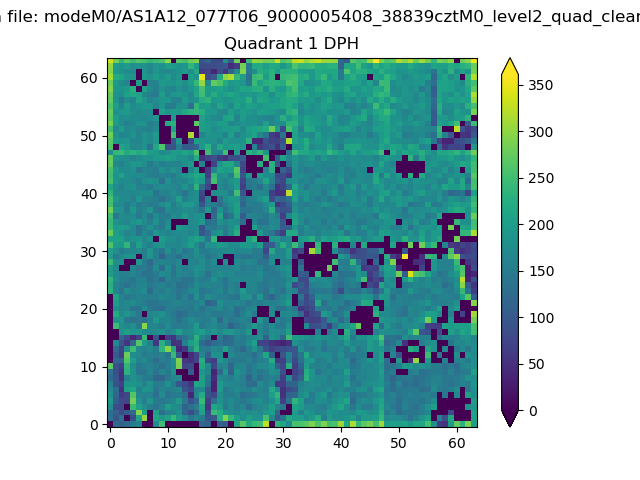
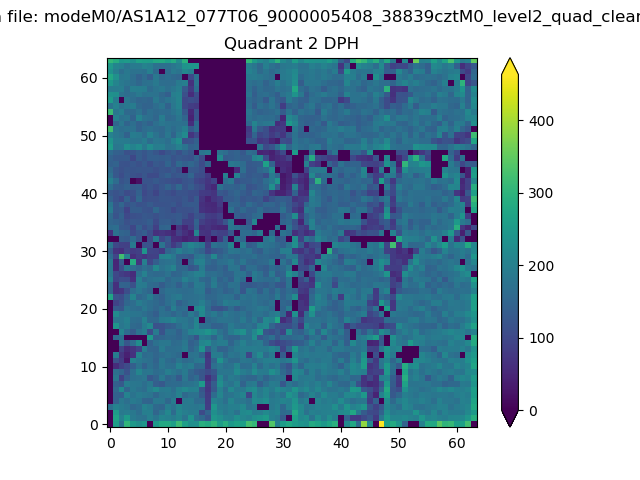
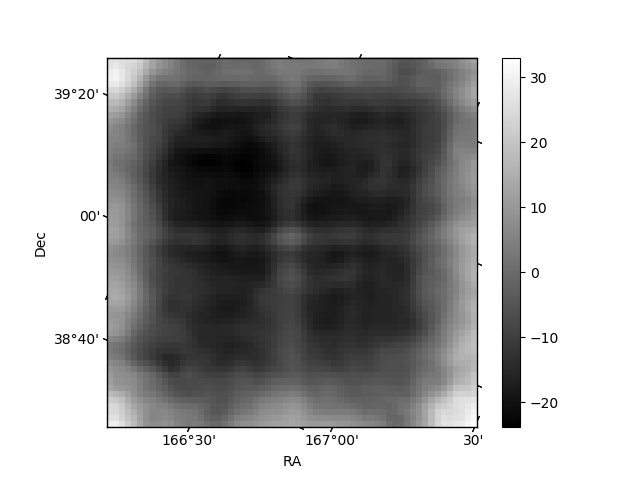
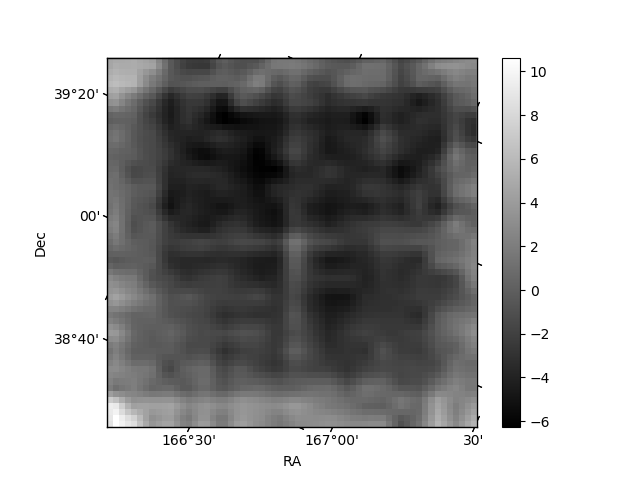
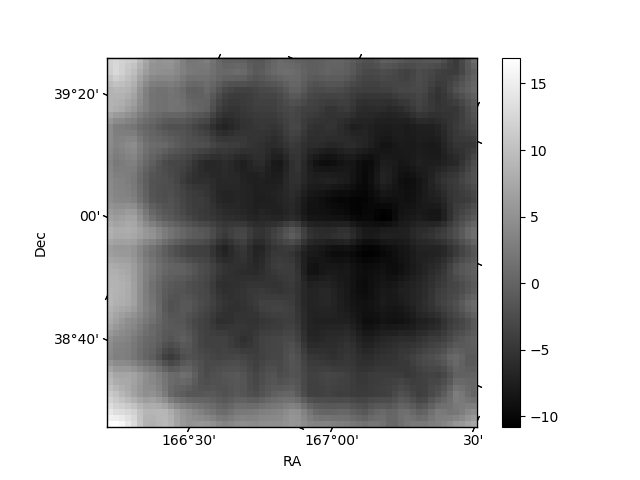
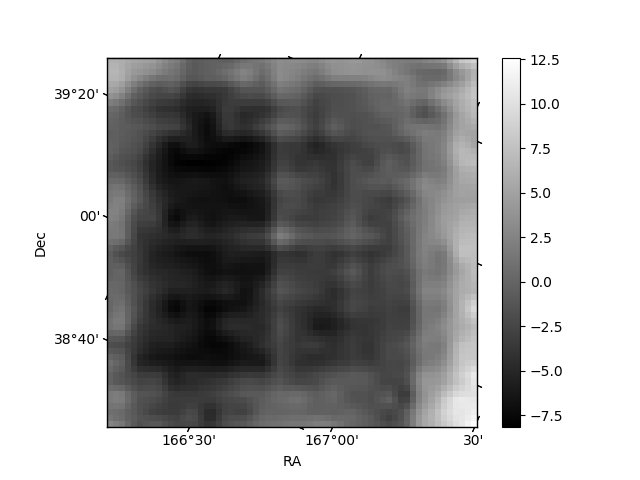
Histogram calculated using DETX and DETY for each event in the final _common_clean file
| Quadrant A | 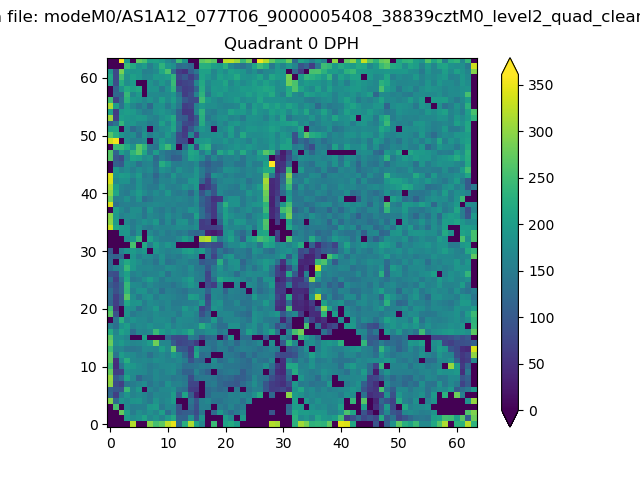 |
 |
Quadrant B |
|---|---|---|---|
| Quadrant D | 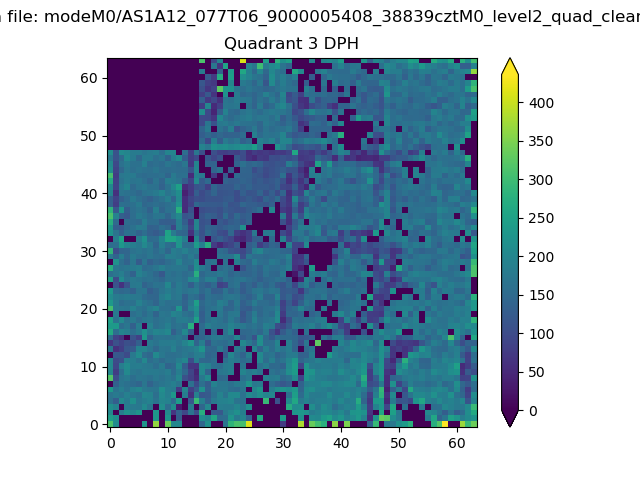 |
 |
Quadrant C |
| Plot type | Count rate plots | Images |
|---|---|---|
| Comparison with Poisson distribution Blue bars denote a histogram of data divided into 1 sec bins. Red curve is a Poisson curve with rate = median count rate of data. |
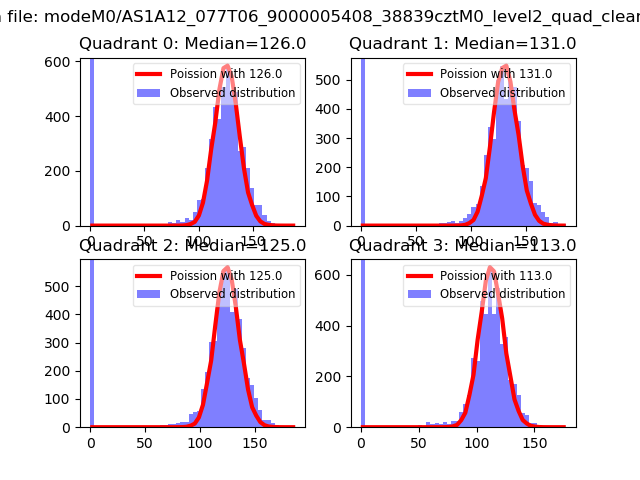 |
 |
| Quadrant-wise count rates Data is divided into 100 sec bins |
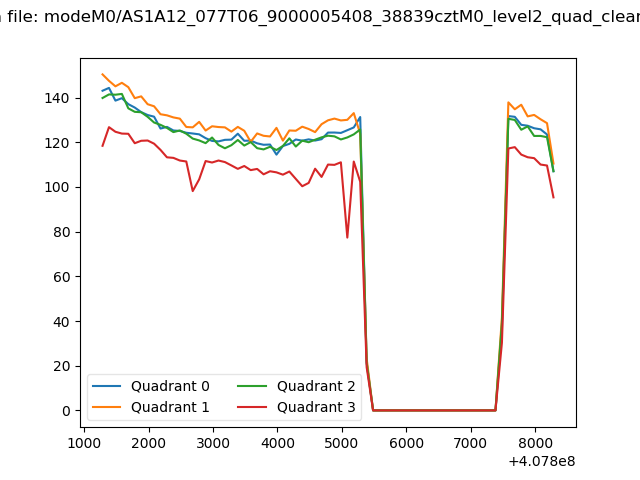 |
|
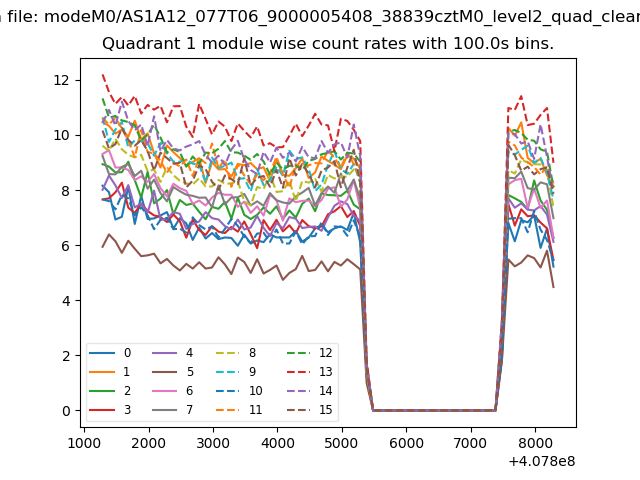
| Module-wise count rates for Quadrant A Data is divided into 100 sec bins |
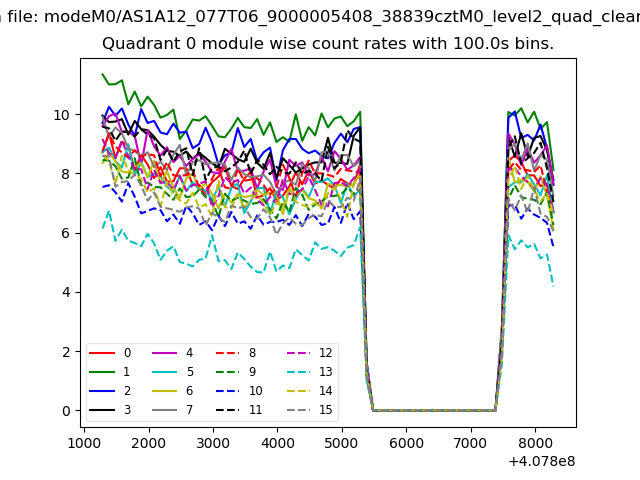 |
 |
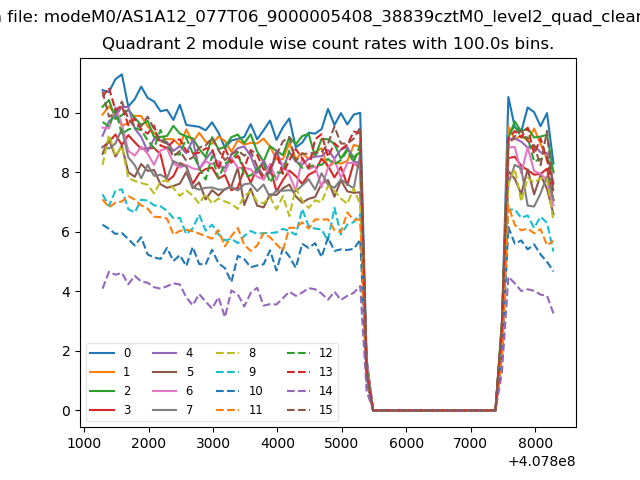
| Module-wise count rates for Quadrant B Data is divided into 100 sec bins |
 |
 |
| Module-wise count rates for Quadrant C Data is divided into 100 sec bins |
 |
 |
| Module-wise count rates for Quadrant D Data is divided into 100 sec bins |
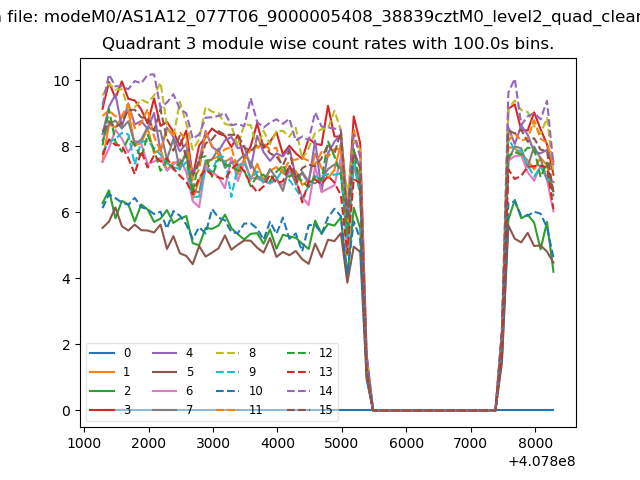 |
 |
| Parameter | Plot |
|---|---|
| CZT HV Monitor | 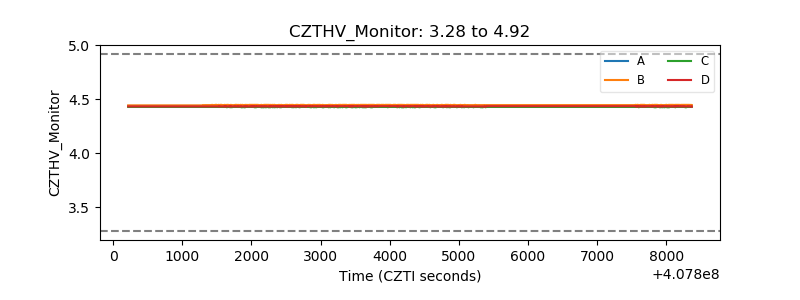 |
| D_VDD | 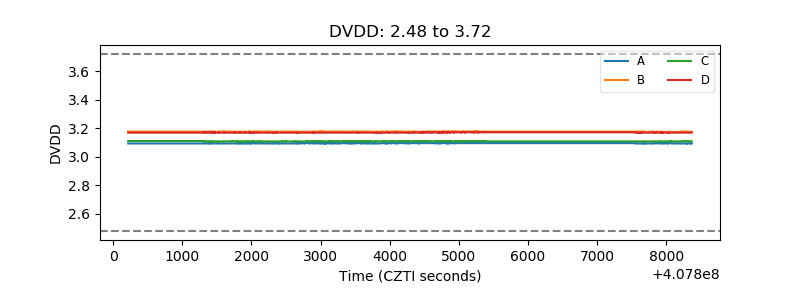 |
| Temperature 1 | 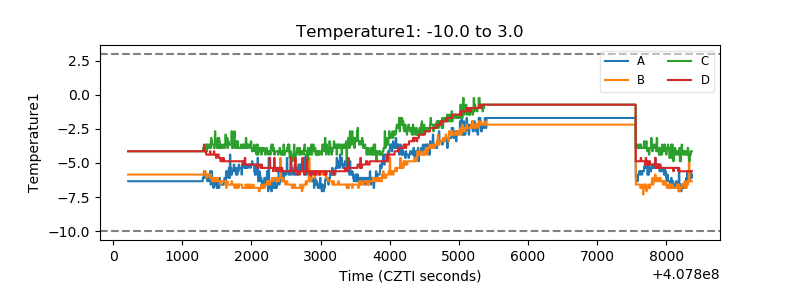 |
| Veto HV Monitor | 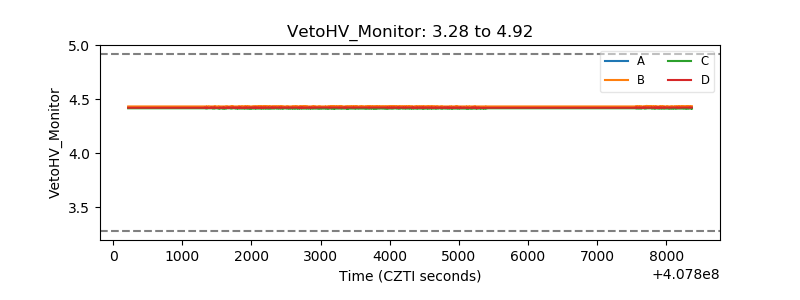 |
| Veto LLD | 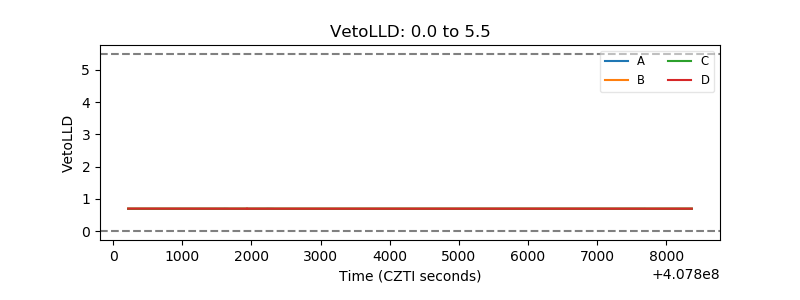 |
| Alpha Counter | 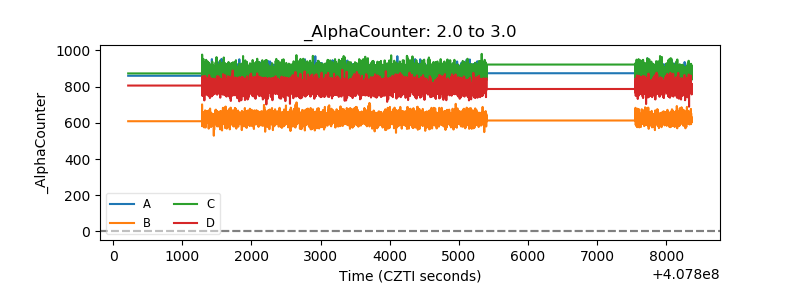 |
| _CPM_Rate | 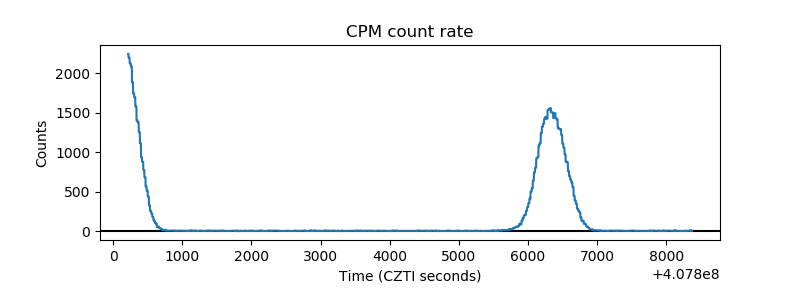 |
| CZT Counter | 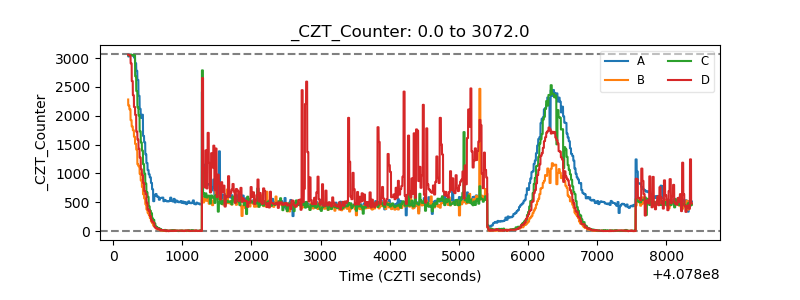 |
| +2.5 Volts monitor | 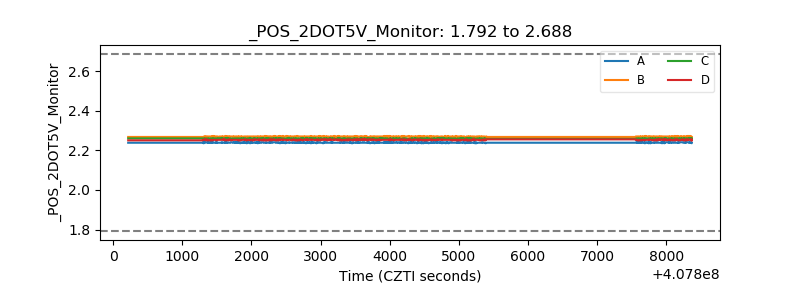 |
| +5 Volts monitor | 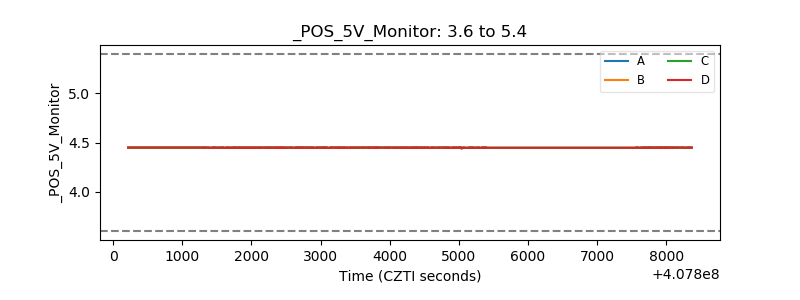 |
| _ROLL_ROT | 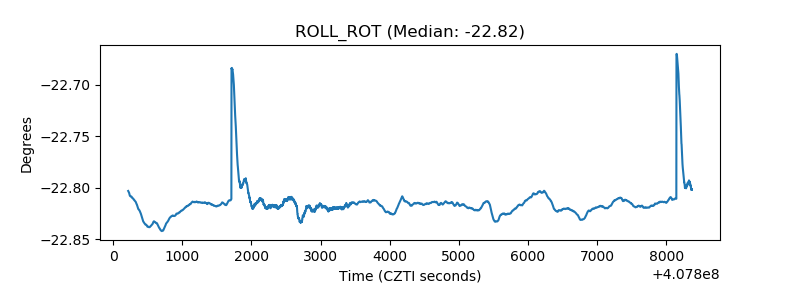 |
| _Roll_DEC | 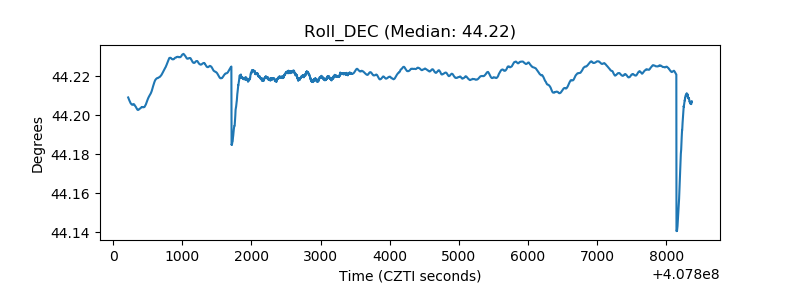 |
| _Roll_RA | 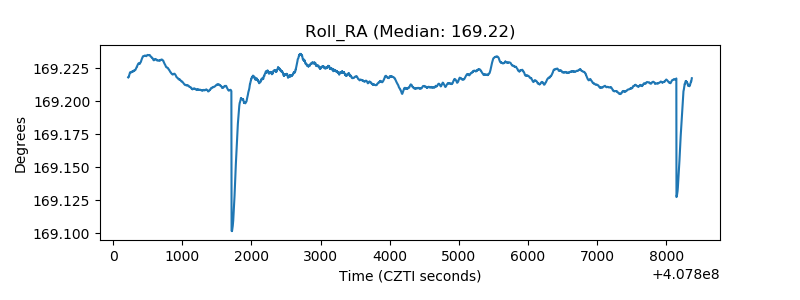 |
| Veto Counter | 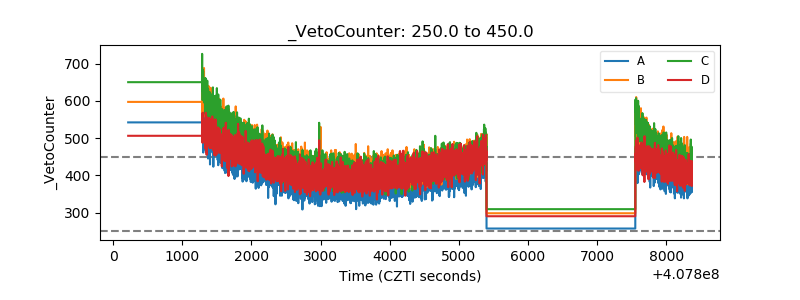 |