| Param | Original file | Final file |
|---|---|---|
| Filename | modeM0/AS1A12_077T06_9000005408_38840cztM0_level2.fits | modeM0/AS1A12_077T06_9000005408_38840cztM0_level2_quad_clean.evt |
| Size (bytes) | 317,168,640 | 91,172,160 |
| Size | 302.5 MB | 86.9 MB |
| Events in quadrant A | 2,687,601 | 615,869 |
| Events in quadrant B | 2,371,632 | 639,074 |
| Events in quadrant C | 2,453,084 | 607,110 |
| Events in quadrant D | 3,826,114 | 537,675 |
| Mode M9 | |||
|---|---|---|---|
| Quadrant | BADHDUFLAG | Total packets | Discarded packets |
| A | 0 | 38 | 0 |
| B | 0 | 38 | 0 |
| C | 0 | 38 | 0 |
| D | 0 | 39 | 0 |
| Mode SS | |||
|---|---|---|---|
| Quadrant | BADHDUFLAG | Total packets | Discarded packets |
| A | 0 | 104 | 0 |
| B | 0 | 104 | 0 |
| C | 0 | 104 | 0 |
| D | 0 | 104 | 0 |
| Mode M0 | |||
|---|---|---|---|
| Quadrant | BADHDUFLAG | Total packets | Discarded packets |
| A | 0 | 11179 | 3 |
| B | 0 | 10549 | 2 |
| C | 0 | 10466 | 2 |
| D | 0 | 15008 | 2 |
| Quadrant | Total seconds | Saturated seconds | Saturation percentage |
|---|---|---|---|
| A | 5159 | 13 | 0.251987% |
| B | 5159 | 9 | 0.174452% |
| C | 5159 | 2 | 0.038767% |
| D | 5159 | 208 | 4.031789% |
Noise dominated data is calculated using 1-second bins in cleaned event files. If a bin has >2000 counts, and if more than 50% of those come from <1% of pixels, then it is considered to be noise-dominated and hence unusable.
| Quadrant | # 1 sec bins | Bins with >0 counts | Bins with >2000 counts | High rate bins dominated by noise | Noise dominated (total time) | Noise dominated (detector-on time) | Marked lightcurve |
|---|---|---|---|---|---|---|---|
| A | 7281 | 5160 | 5 | 5 | 0.07% | 0.10% | 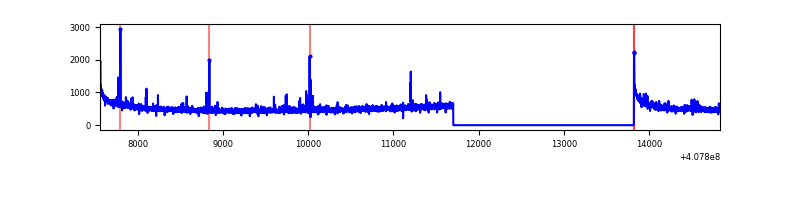 |
| B | 7281 | 5160 | 2 | 2 | 0.03% | 0.04% | 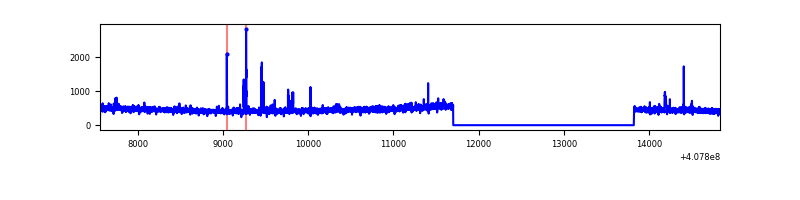 |
| C | 7281 | 5160 | 0 | 0 | 0.00% | 0.00% | 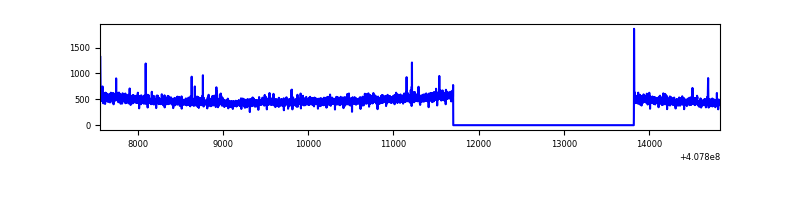 |
| D | 7281 | 5160 | 202 | 202 | 2.77% | 3.91% | 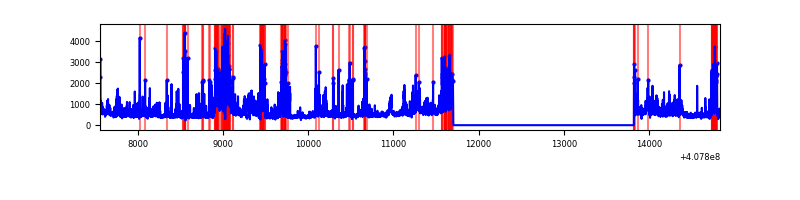 |
Top three noisy pixels from each quadrant. If the there are fewer than three noisy pixels in the level2.evt file, extra rows are filled as -1
| Pixel properties | Quadrant properties | ||||||
|---|---|---|---|---|---|---|---|
| Quadrant | DetID | PixID | Counts | Sigma | Mean | Median | Sigma |
| A | 10 | 83 | 384643 | 3295.33 | 577 | 566 | 116.6 |
| A | 9 | 143 | 33075 | 278.92 | 577 | 566 | 116.6 |
| A | 13 | 248 | 22013 | 184.01 | 577 | 566 | 116.6 |
| B | 0 | 190 | 37144 | 327.4 | 579 | 565 | 111.7 |
| B | 0 | 230 | 17718 | 153.53 | 579 | 565 | 111.7 |
| B | 12 | 111 | 13778 | 118.26 | 579 | 565 | 111.7 |
| C | 15 | 214 | 214926 | 1635.68 | 566 | 569 | 131.1 |
| C | 3 | 233 | 17522 | 129.36 | 566 | 569 | 131.1 |
| C | 0 | 10 | 7981 | 56.56 | 566 | 569 | 131.1 |
| D | 12 | 227 | 457133 | 3387.62 | 549 | 532 | 134.8 |
| D | 2 | 249 | 414958 | 3074.71 | 549 | 532 | 134.8 |
| D | 5 | 222 | 205631 | 1521.67 | 549 | 532 | 134.8 |
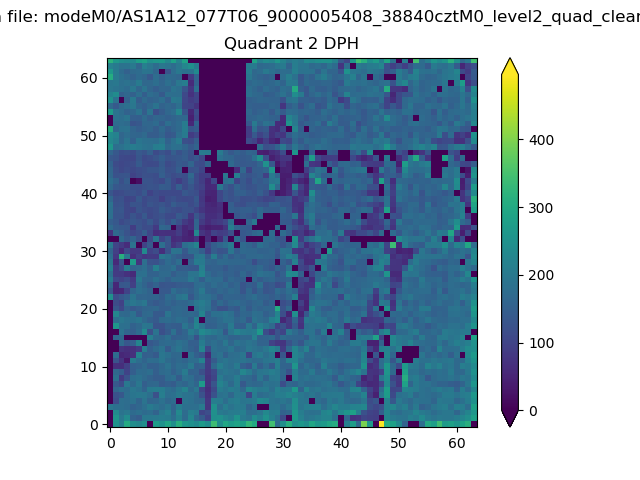
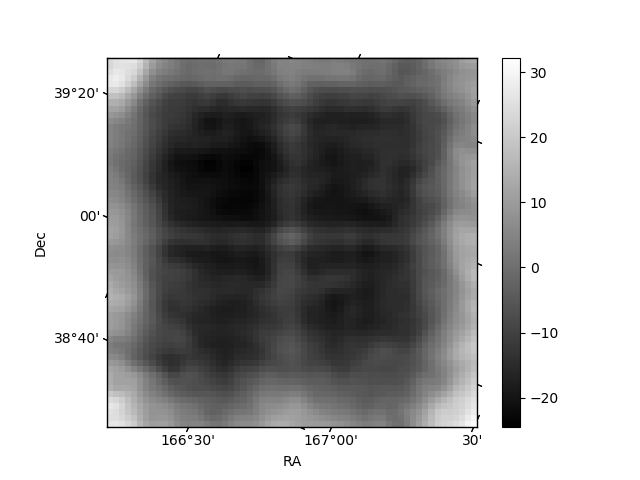
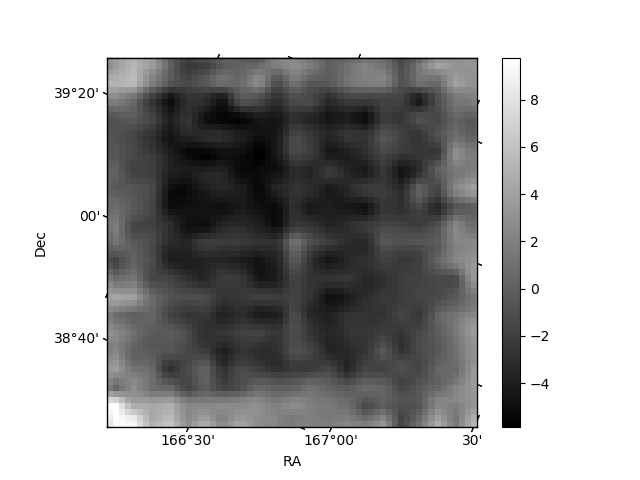
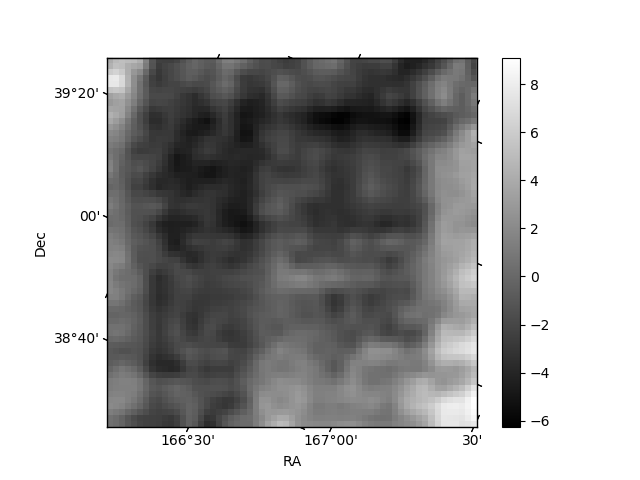
Histogram calculated using DETX and DETY for each event in the final _common_clean file
| Quadrant A | 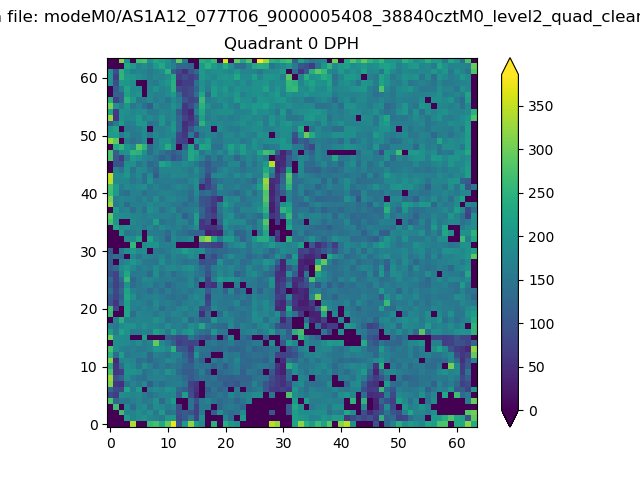 |
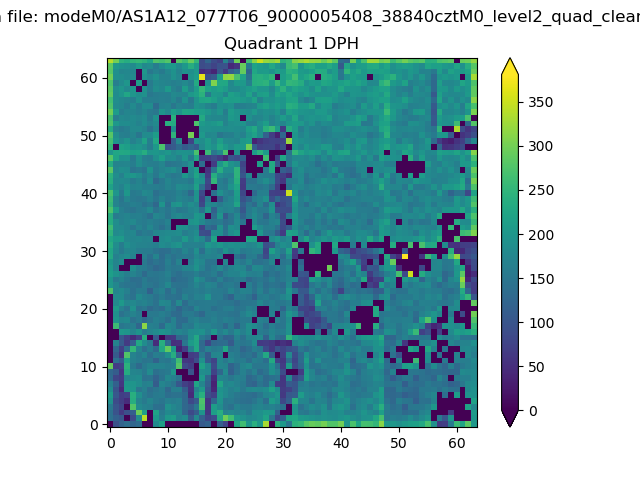 |
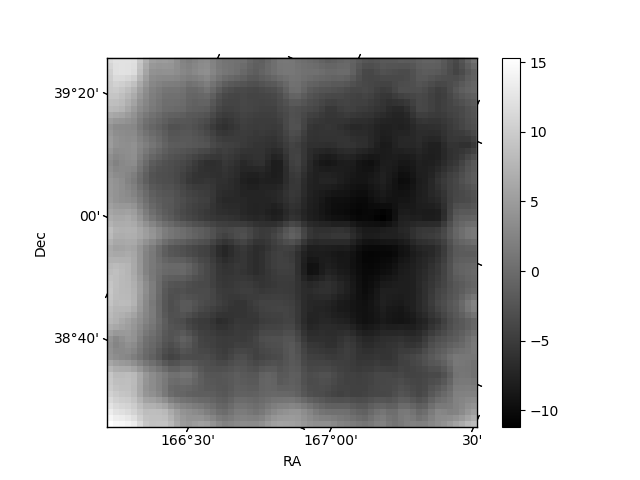
Quadrant B |
|---|---|---|---|
| Quadrant D | 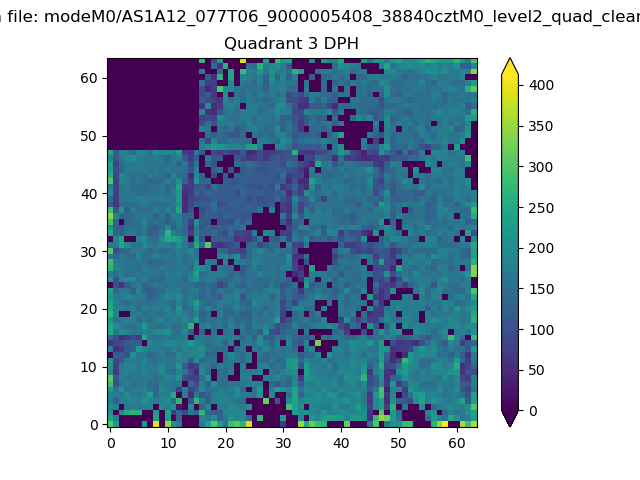 |
 |
Quadrant C |
| Plot type | Count rate plots | Images |
|---|---|---|
| Comparison with Poisson distribution Blue bars denote a histogram of data divided into 1 sec bins. Red curve is a Poisson curve with rate = median count rate of data. |
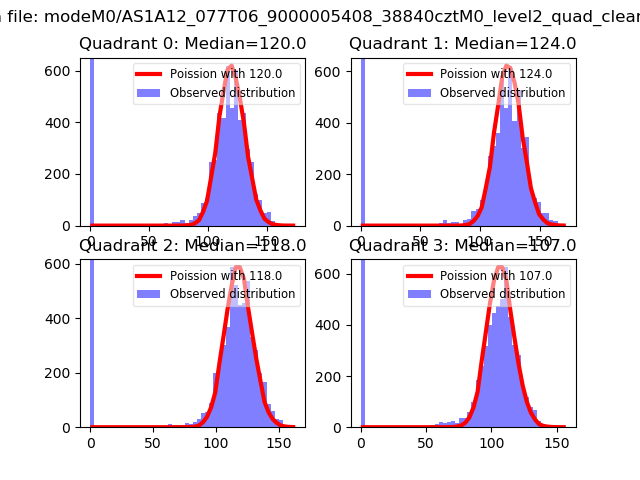 |
 |
| Quadrant-wise count rates Data is divided into 100 sec bins |
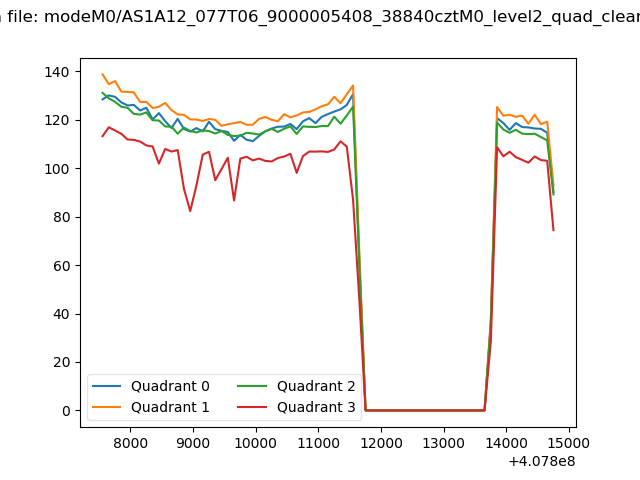 |
|
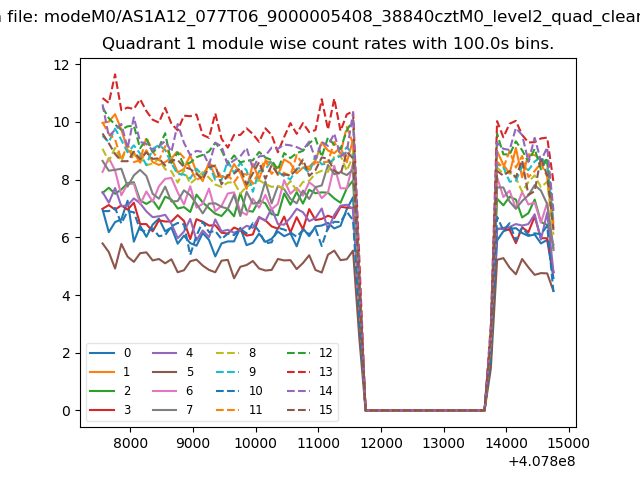
| Module-wise count rates for Quadrant A Data is divided into 100 sec bins |
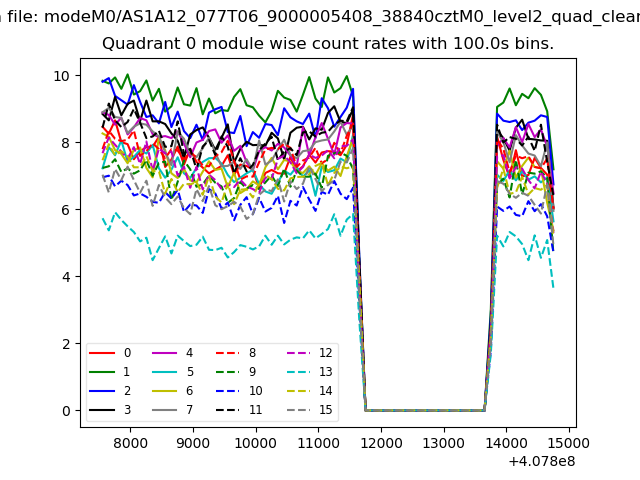 |
 |
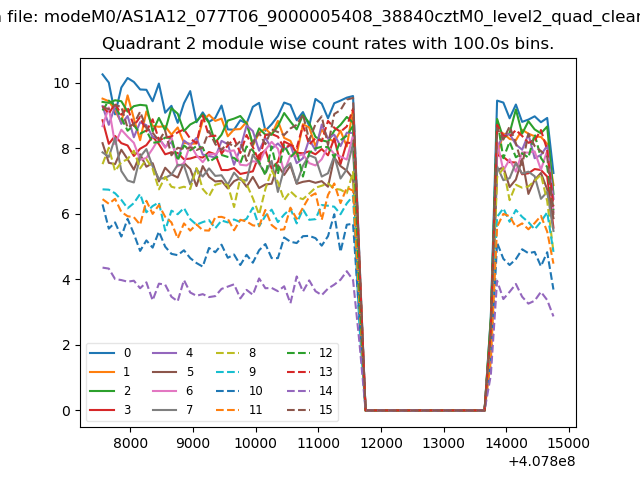
| Module-wise count rates for Quadrant B Data is divided into 100 sec bins |
 |
 |
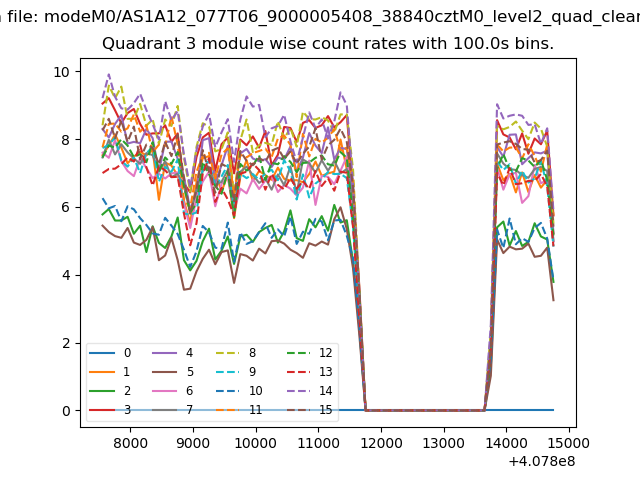
| Module-wise count rates for Quadrant C Data is divided into 100 sec bins |
 |
 |
| Module-wise count rates for Quadrant D Data is divided into 100 sec bins |
 |
 |
| Parameter | Plot |
|---|---|
| CZT HV Monitor |  |
| D_VDD | 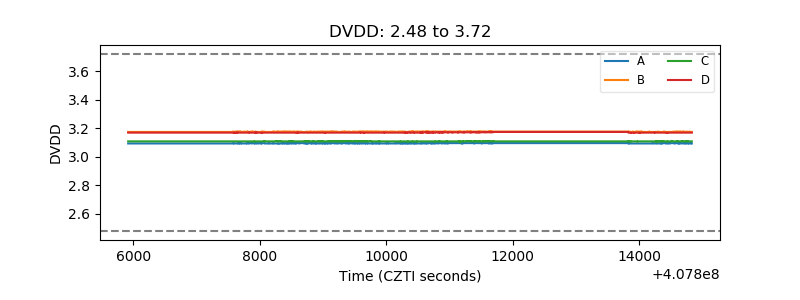 |
| Temperature 1 | 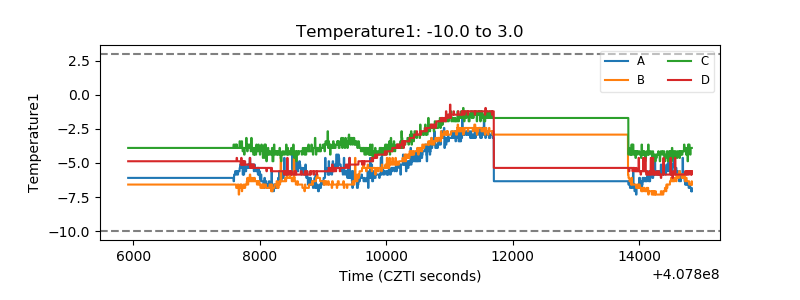 |
| Veto HV Monitor | 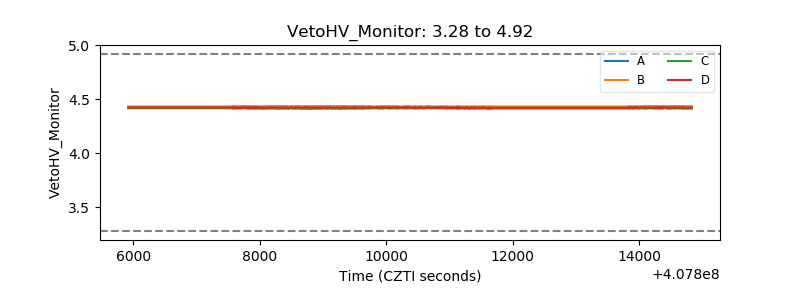 |
| Veto LLD | 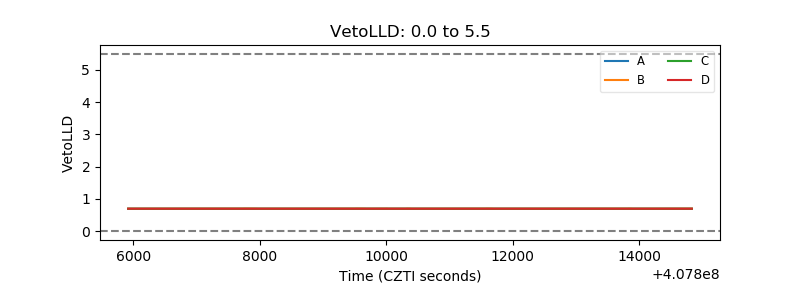 |
| Alpha Counter | 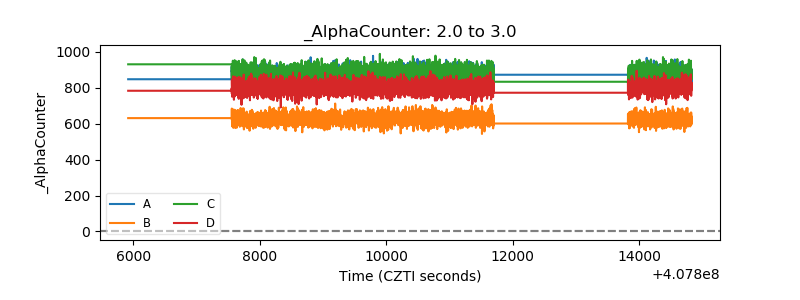 |
| _CPM_Rate | 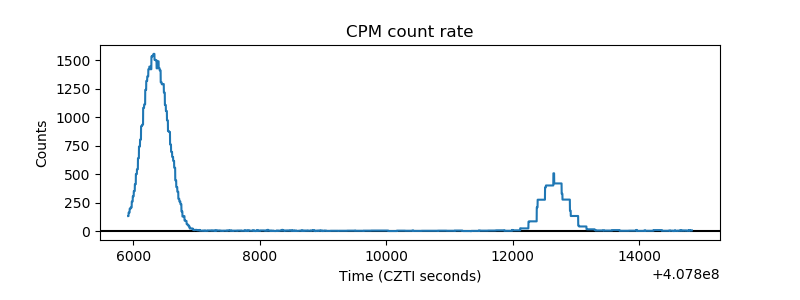 |
| CZT Counter | 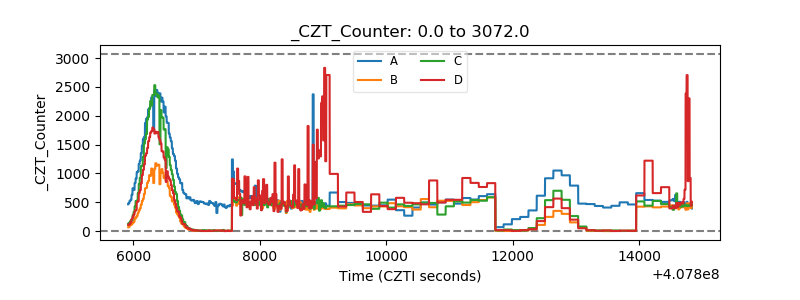 |
| +2.5 Volts monitor | 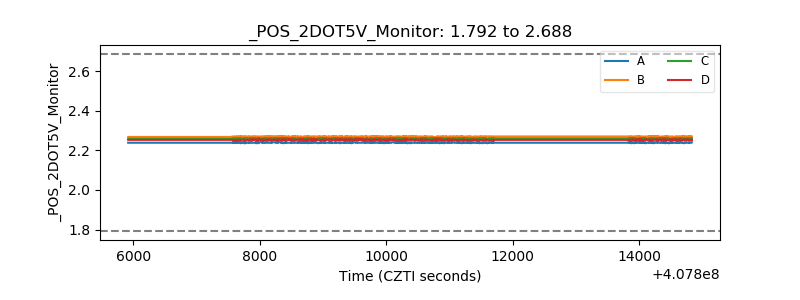 |
| +5 Volts monitor | 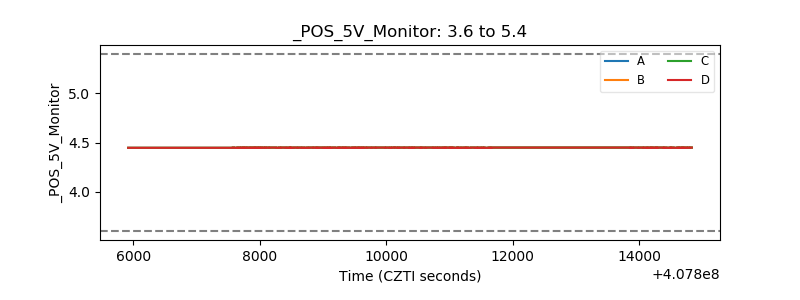 |
| _ROLL_ROT | 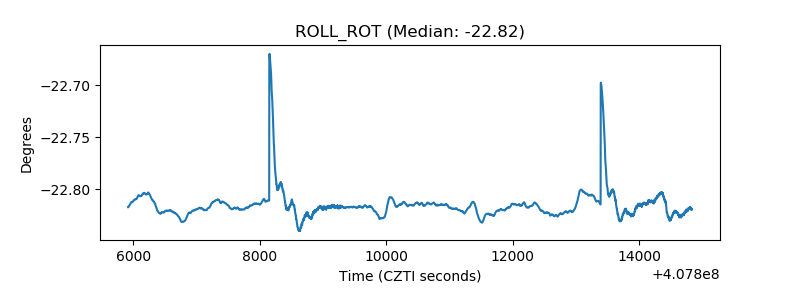 |
| _Roll_DEC | 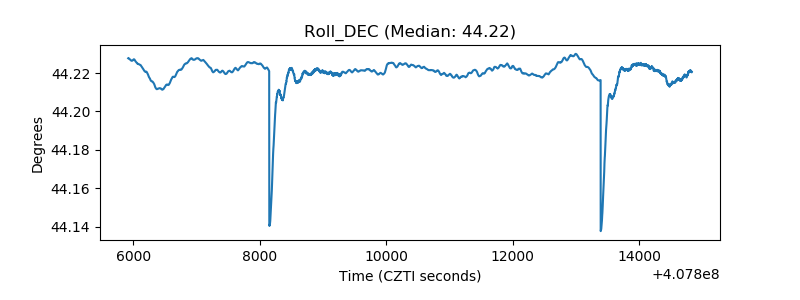 |
| _Roll_RA | 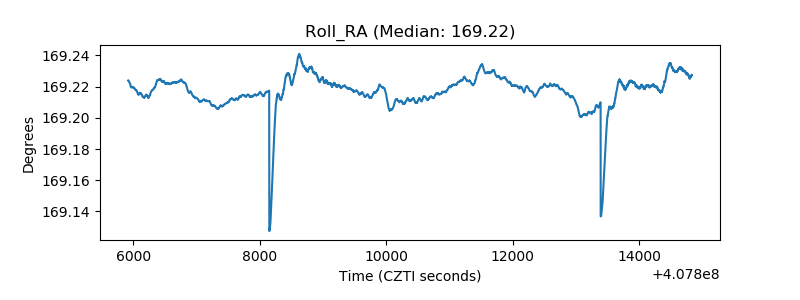 |
| Veto Counter | 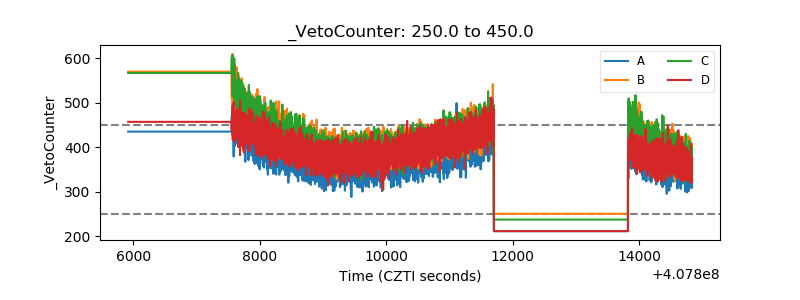 |