| Param | Original file | Final file |
|---|---|---|
| Filename | modeM0/AS1A12_077T06_9000005408_38842cztM0_level2.fits | modeM0/AS1A12_077T06_9000005408_38842cztM0_level2_quad_clean.evt |
| Size (bytes) | 351,164,160 | 93,813,120 |
| Size | 334.9 MB | 89.5 MB |
| Events in quadrant A | 3,136,677 | 629,100 |
| Events in quadrant B | 2,562,986 | 647,557 |
| Events in quadrant C | 2,677,682 | 616,517 |
| Events in quadrant D | 4,182,643 | 553,371 |
| Mode M9 | |||
|---|---|---|---|
| Quadrant | BADHDUFLAG | Total packets | Discarded packets |
| A | 0 | 16 | 0 |
| B | 0 | 16 | 0 |
| C | 0 | 16 | 0 |
| D | 0 | 16 | 0 |
| Mode SS | |||
|---|---|---|---|
| Quadrant | BADHDUFLAG | Total packets | Discarded packets |
| A | 0 | 114 | 0 |
| B | 0 | 114 | 0 |
| C | 0 | 114 | 0 |
| D | 0 | 114 | 0 |
| Mode M0 | |||
|---|---|---|---|
| Quadrant | BADHDUFLAG | Total packets | Discarded packets |
| A | 0 | 12804 | 2 |
| B | 0 | 11617 | 1 |
| C | 0 | 11562 | 1 |
| D | 0 | 16470 | 1 |
| Quadrant | Total seconds | Saturated seconds | Saturation percentage |
|---|---|---|---|
| A | 5638 | 40 | 0.709471% |
| B | 5638 | 25 | 0.443420% |
| C | 5638 | 3 | 0.053210% |
| D | 5638 | 204 | 3.618304% |
Noise dominated data is calculated using 1-second bins in cleaned event files. If a bin has >2000 counts, and if more than 50% of those come from <1% of pixels, then it is considered to be noise-dominated and hence unusable.
| Quadrant | # 1 sec bins | Bins with >0 counts | Bins with >2000 counts | High rate bins dominated by noise | Noise dominated (total time) | Noise dominated (detector-on time) | Marked lightcurve |
|---|---|---|---|---|---|---|---|
| A | 7251 | 5639 | 41 | 41 | 0.57% | 0.73% | 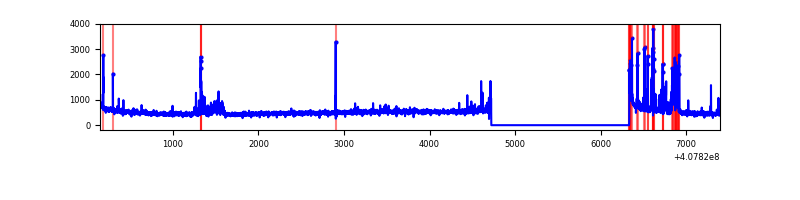 |
| B | 7251 | 5639 | 17 | 17 | 0.23% | 0.30% | 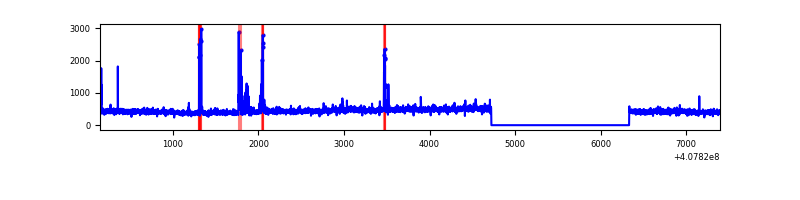 |
| C | 7251 | 5639 | 1 | 1 | 0.01% | 0.02% | 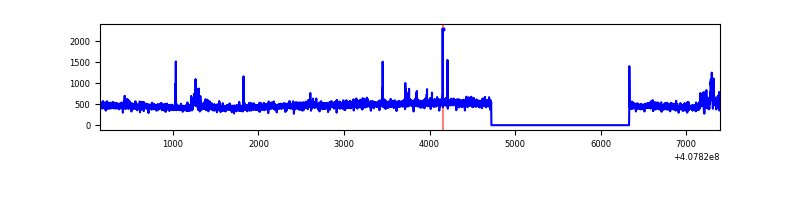 |
| D | 7251 | 5639 | 184 | 184 | 2.54% | 3.26% | 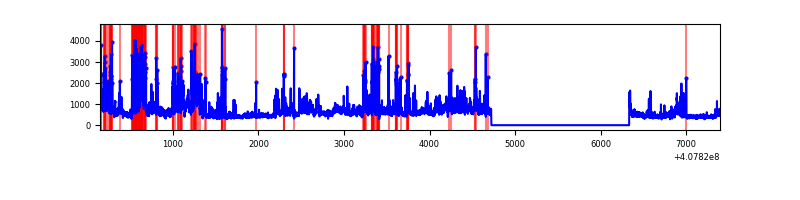 |
Top three noisy pixels from each quadrant. If the there are fewer than three noisy pixels in the level2.evt file, extra rows are filled as -1
| Pixel properties | Quadrant properties | ||||||
|---|---|---|---|---|---|---|---|
| Quadrant | DetID | PixID | Counts | Sigma | Mean | Median | Sigma |
| A | 10 | 83 | 386095 | 3078.07 | 614 | 602 | 125.2 |
| A | 13 | 248 | 280012 | 2231.02 | 614 | 602 | 125.2 |
| A | 9 | 143 | 52943 | 417.93 | 614 | 602 | 125.2 |
| B | 5 | 184 | 70488 | 585.49 | 611 | 596 | 119.4 |
| B | 5 | 172 | 38021 | 313.51 | 611 | 596 | 119.4 |
| B | 0 | 156 | 26262 | 215.01 | 611 | 596 | 119.4 |
| C | 15 | 214 | 232149 | 1664.6 | 598 | 600 | 139.1 |
| C | 3 | 233 | 55321 | 393.39 | 598 | 600 | 139.1 |
| C | 15 | 208 | 34481 | 243.57 | 598 | 600 | 139.1 |
| D | 2 | 249 | 462239 | 3197.72 | 591 | 574 | 144.4 |
| D | 12 | 227 | 438819 | 3035.5 | 591 | 574 | 144.4 |
| D | 5 | 222 | 299067 | 2067.51 | 591 | 574 | 144.4 |
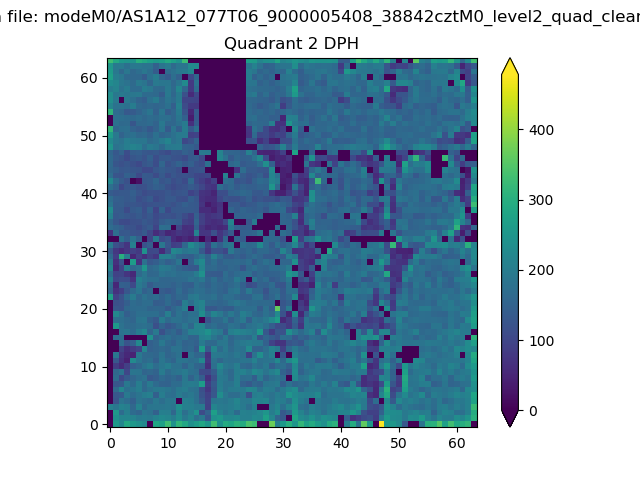
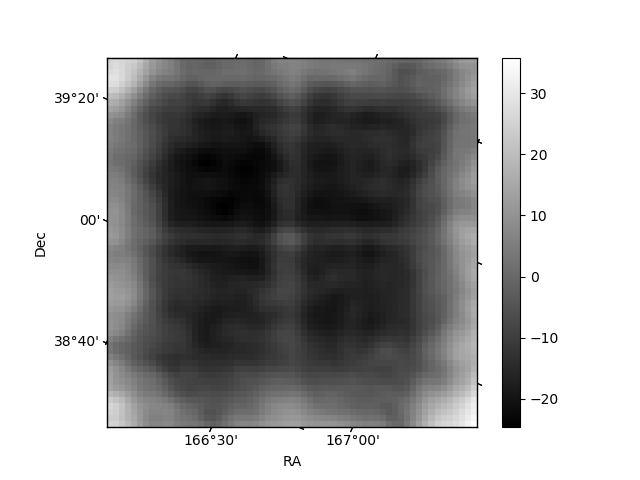
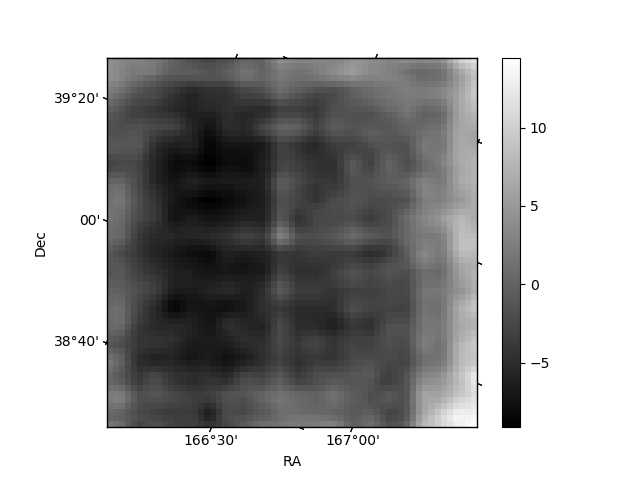
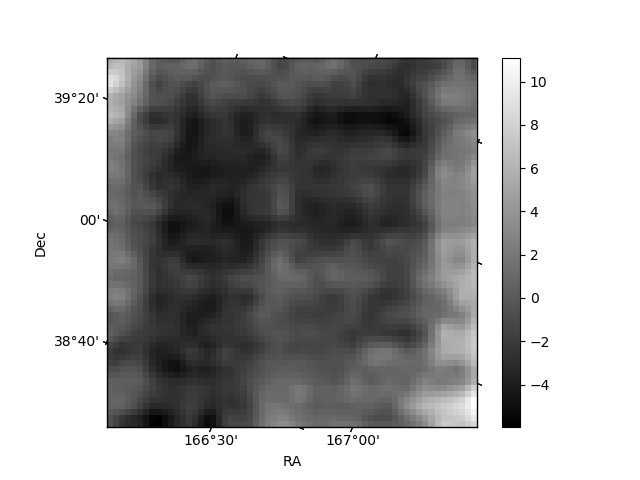
Histogram calculated using DETX and DETY for each event in the final _common_clean file
| Quadrant A | 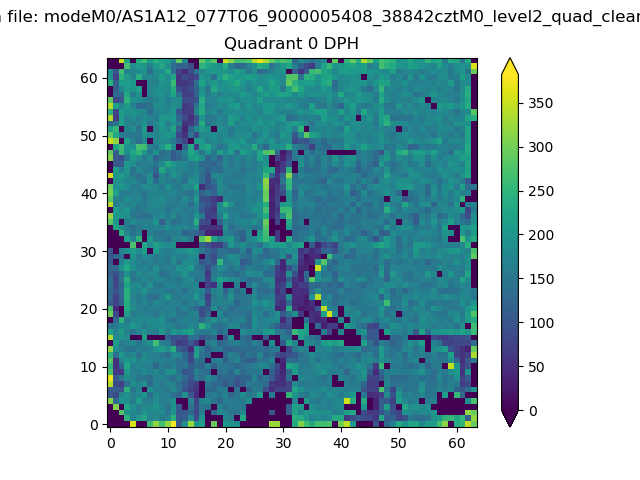 |
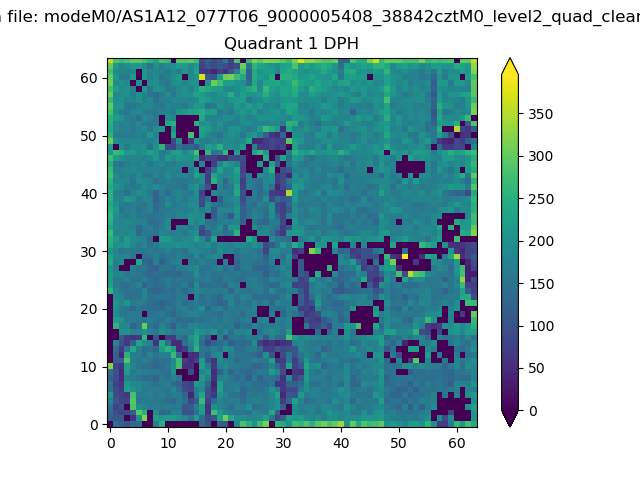 |
Quadrant B |
|---|---|---|---|
| Quadrant D | 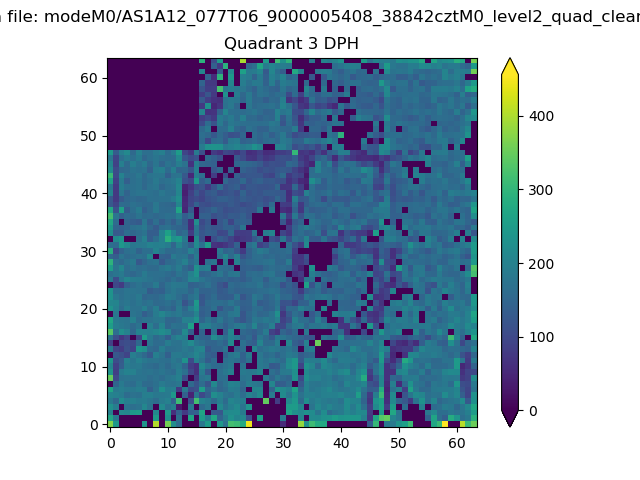 |
 |
Quadrant C |
| Plot type | Count rate plots | Images |
|---|---|---|
| Comparison with Poisson distribution Blue bars denote a histogram of data divided into 1 sec bins. Red curve is a Poisson curve with rate = median count rate of data. |
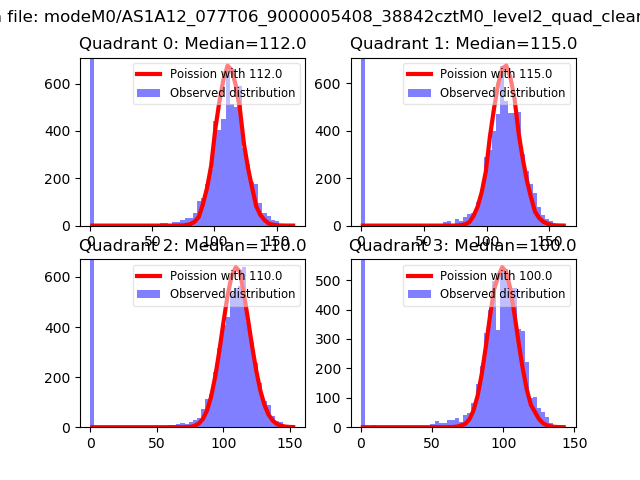 |
 |
| Quadrant-wise count rates Data is divided into 100 sec bins |
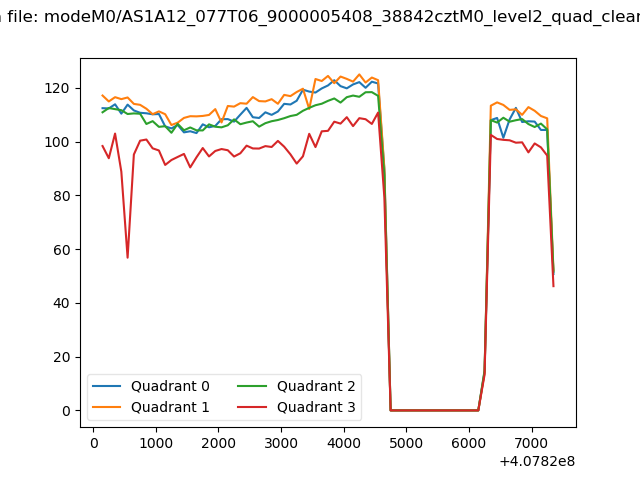 |
|
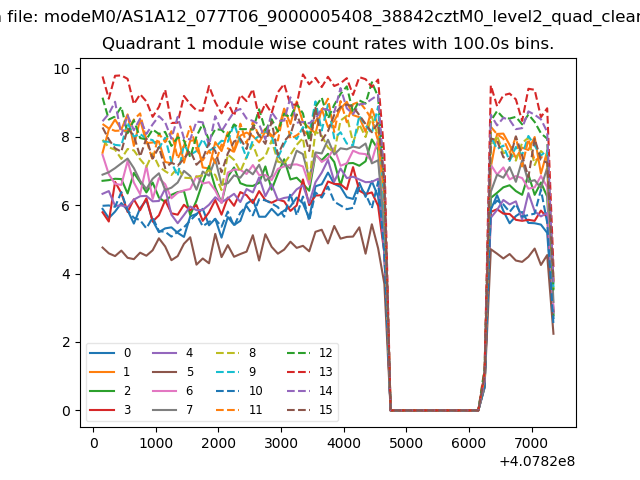
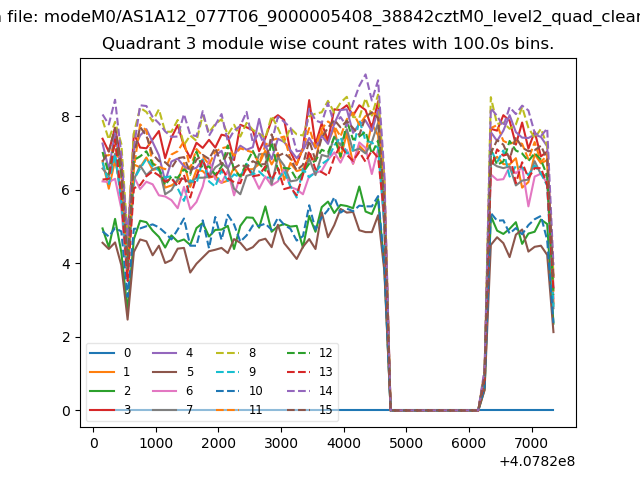
| Module-wise count rates for Quadrant A Data is divided into 100 sec bins |
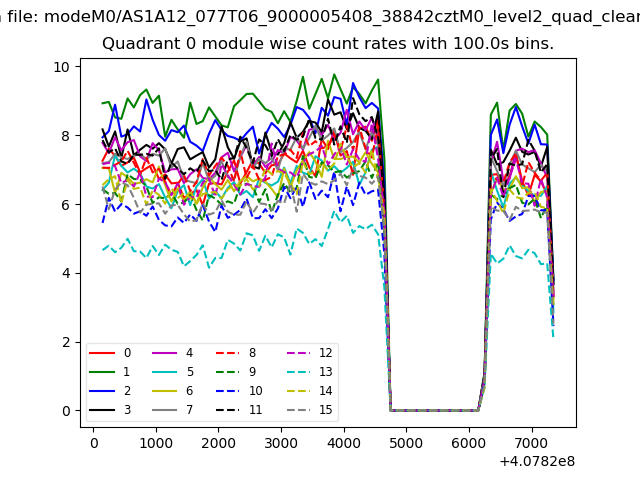 |
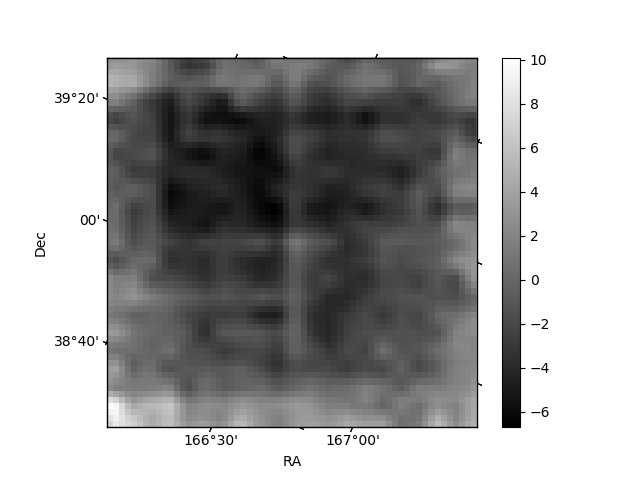 |
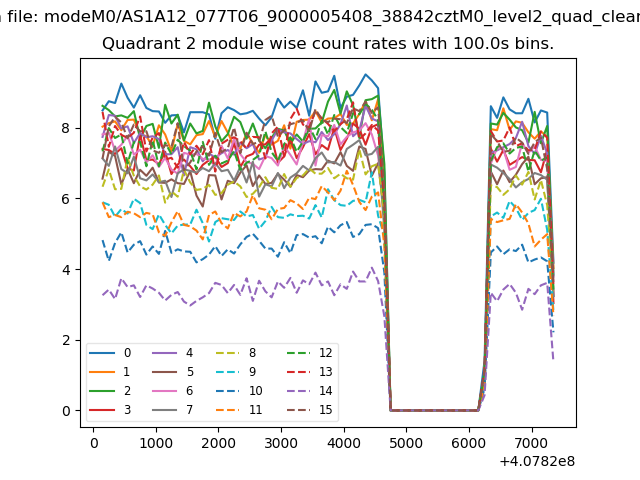
| Module-wise count rates for Quadrant B Data is divided into 100 sec bins |
 |
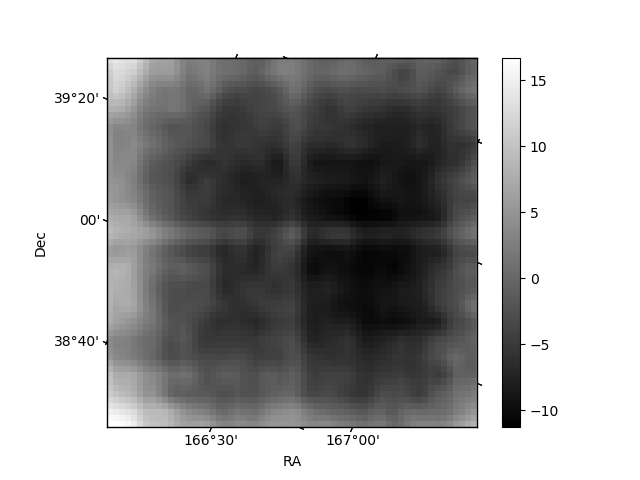 |
| Module-wise count rates for Quadrant C Data is divided into 100 sec bins |
 |
 |
| Module-wise count rates for Quadrant D Data is divided into 100 sec bins |
 |
 |
| Parameter | Plot |
|---|---|
| CZT HV Monitor | 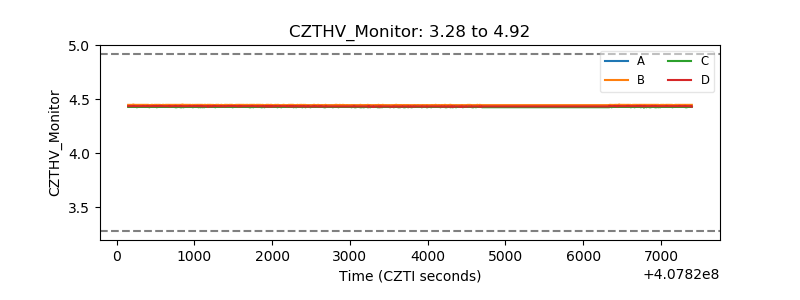 |
| D_VDD | 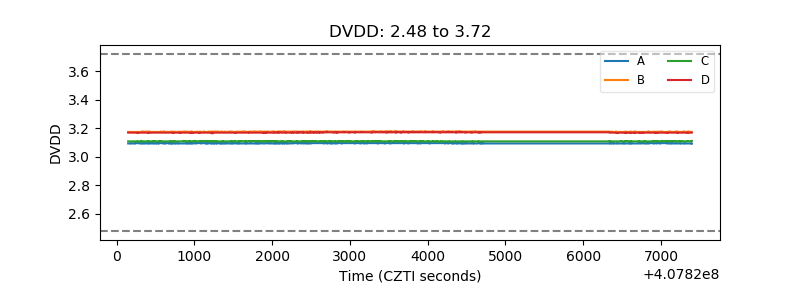 |
| Temperature 1 | 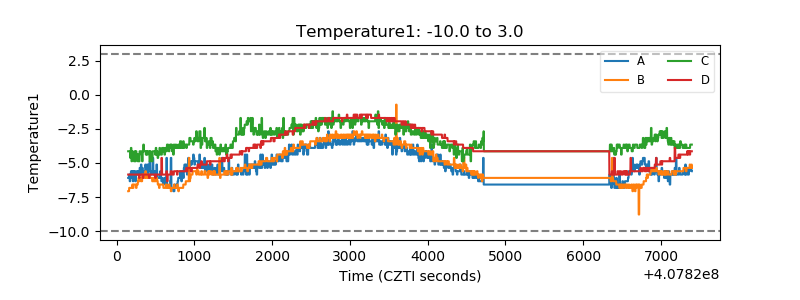 |
| Veto HV Monitor | 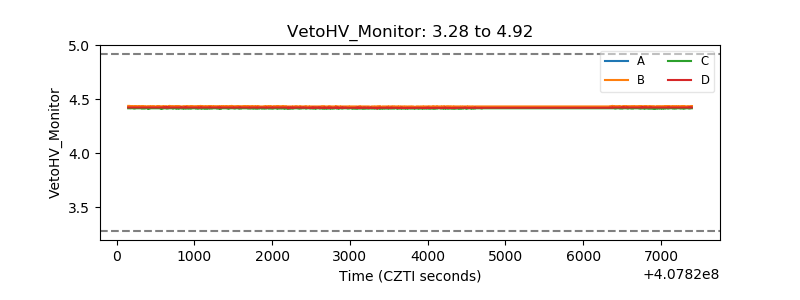 |
| Veto LLD | 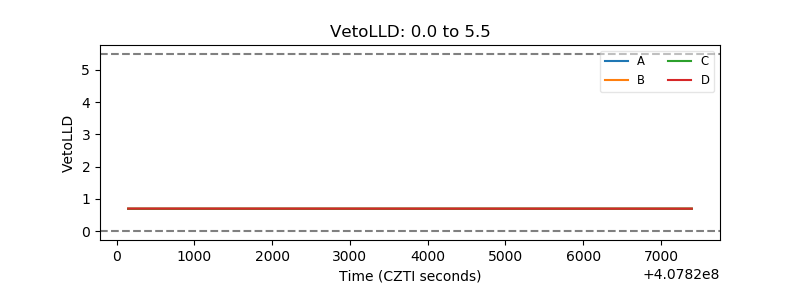 |
| Alpha Counter | 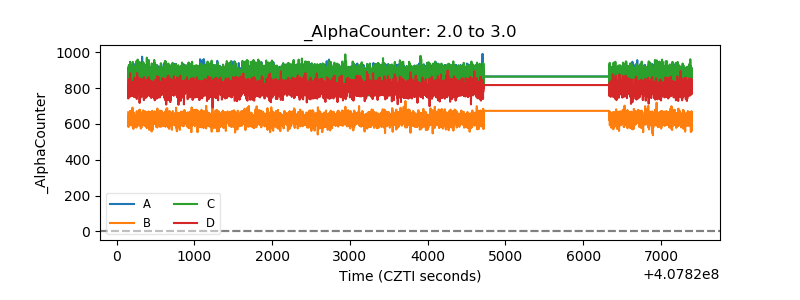 |
| _CPM_Rate |  |
| CZT Counter | 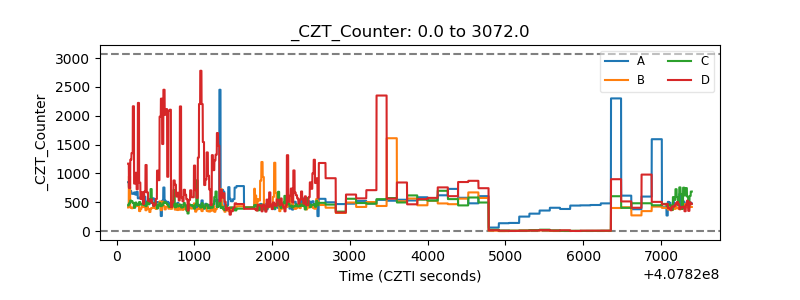 |
| +2.5 Volts monitor |  |
| +5 Volts monitor | 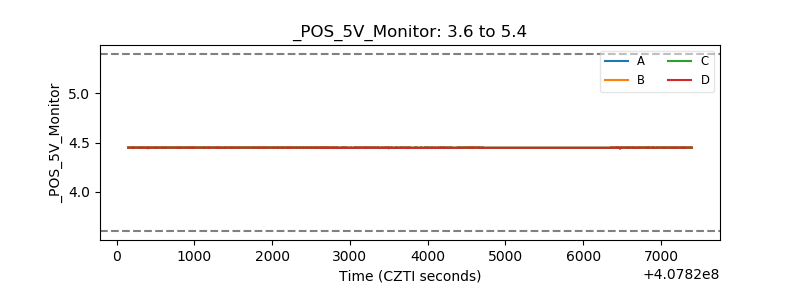 |
| _ROLL_ROT | 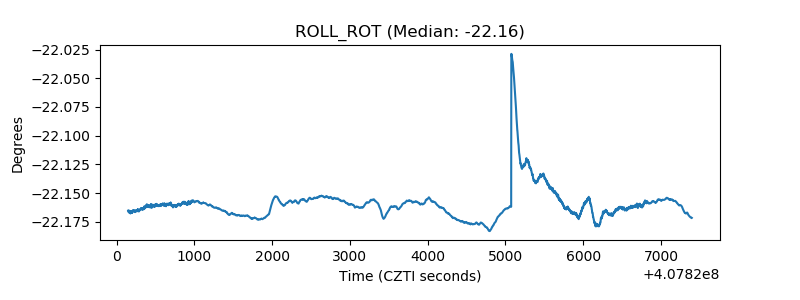 |
| _Roll_DEC | 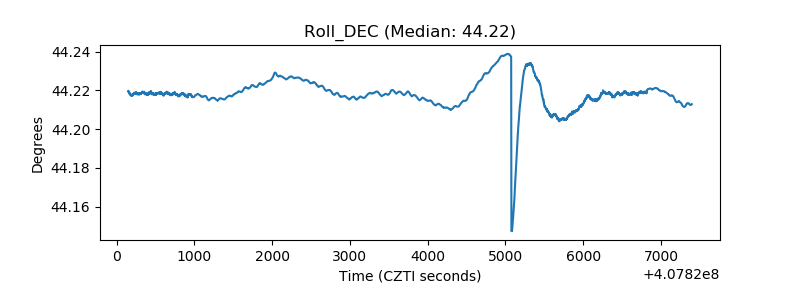 |
| _Roll_RA | 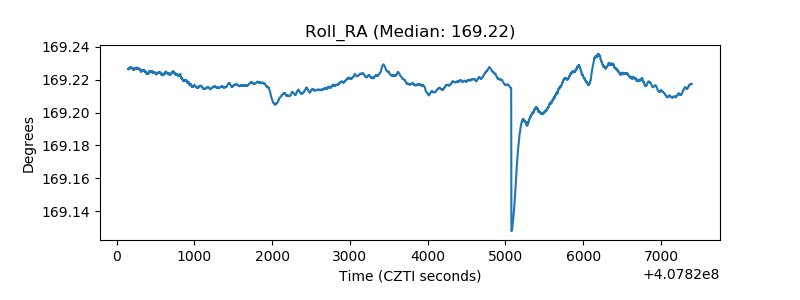 |
| Veto Counter | 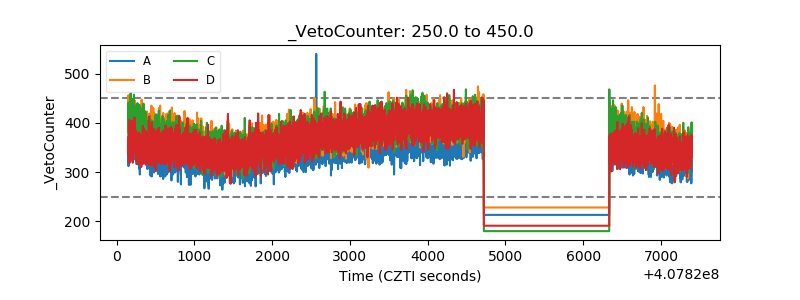 |