| Param | Original file | Final file |
|---|---|---|
| Filename | modeM0/AS1A12_077T06_9000005408_38843cztM0_level2.fits | modeM0/AS1A12_077T06_9000005408_38843cztM0_level2_quad_clean.evt |
| Size (bytes) | 356,405,760 | 96,672,960 |
| Size | 339.9 MB | 92.2 MB |
| Events in quadrant A | 3,583,189 | 643,934 |
| Events in quadrant B | 2,669,227 | 663,771 |
| Events in quadrant C | 2,806,056 | 631,879 |
| Events in quadrant D | 3,677,875 | 577,647 |
| Mode M9 | |||
|---|---|---|---|
| Quadrant | BADHDUFLAG | Total packets | Discarded packets |
| A | 0 | 23 | 0 |
| B | 0 | 23 | 0 |
| C | 0 | 23 | 0 |
| D | 0 | 24 | 0 |
| Mode SS | |||
|---|---|---|---|
| Quadrant | BADHDUFLAG | Total packets | Discarded packets |
| A | 0 | 120 | 0 |
| B | 0 | 120 | 0 |
| C | 0 | 120 | 0 |
| D | 0 | 120 | 0 |
| Mode M0 | |||
|---|---|---|---|
| Quadrant | BADHDUFLAG | Total packets | Discarded packets |
| A | 0 | 14379 | 3 |
| B | 0 | 12033 | 2 |
| C | 0 | 11996 | 2 |
| D | 0 | 15028 | 2 |
| Quadrant | Total seconds | Saturated seconds | Saturation percentage |
|---|---|---|---|
| A | 5866 | 65 | 1.108080% |
| B | 5866 | 28 | 0.477327% |
| C | 5866 | 5 | 0.085237% |
| D | 5866 | 90 | 1.534265% |
Noise dominated data is calculated using 1-second bins in cleaned event files. If a bin has >2000 counts, and if more than 50% of those come from <1% of pixels, then it is considered to be noise-dominated and hence unusable.
| Quadrant | # 1 sec bins | Bins with >0 counts | Bins with >2000 counts | High rate bins dominated by noise | Noise dominated (total time) | Noise dominated (detector-on time) | Marked lightcurve |
|---|---|---|---|---|---|---|---|
| A | 7210 | 5867 | 60 | 60 | 0.83% | 1.02% |  |
| B | 7210 | 5867 | 18 | 18 | 0.25% | 0.31% | 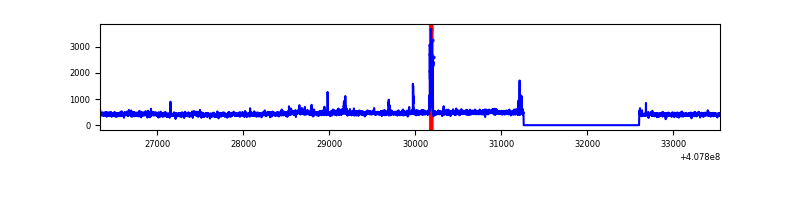 |
| C | 7210 | 5867 | 1 | 1 | 0.01% | 0.02% | 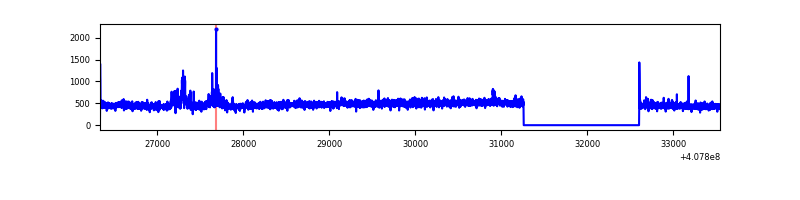 |
| D | 7210 | 5867 | 64 | 64 | 0.89% | 1.09% | 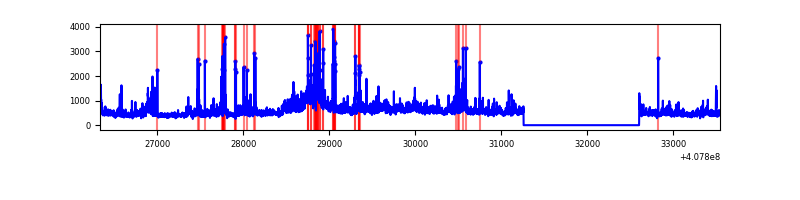 |
Top three noisy pixels from each quadrant. If the there are fewer than three noisy pixels in the level2.evt file, extra rows are filled as -1
| Pixel properties | Quadrant properties | ||||||
|---|---|---|---|---|---|---|---|
| Quadrant | DetID | PixID | Counts | Sigma | Mean | Median | Sigma |
| A | 10 | 83 | 420961 | 3201.13 | 644 | 631 | 131.3 |
| A | 13 | 248 | 346037 | 2630.53 | 644 | 631 | 131.3 |
| A | 12 | 16 | 190414 | 1445.34 | 644 | 631 | 131.3 |
| B | 5 | 172 | 71209 | 561.29 | 641 | 624 | 125.8 |
| B | 0 | 230 | 25209 | 195.5 | 641 | 624 | 125.8 |
| B | 0 | 221 | 17801 | 136.59 | 641 | 624 | 125.8 |
| C | 15 | 214 | 240882 | 1647.38 | 627 | 631 | 145.8 |
| C | 3 | 233 | 98402 | 670.41 | 627 | 631 | 145.8 |
| C | 15 | 208 | 9483 | 60.7 | 627 | 631 | 145.8 |
| D | 12 | 235 | 383237 | 2539.71 | 624 | 608 | 150.7 |
| D | 5 | 222 | 331006 | 2193.03 | 624 | 608 | 150.7 |
| D | 2 | 249 | 187055 | 1237.55 | 624 | 608 | 150.7 |
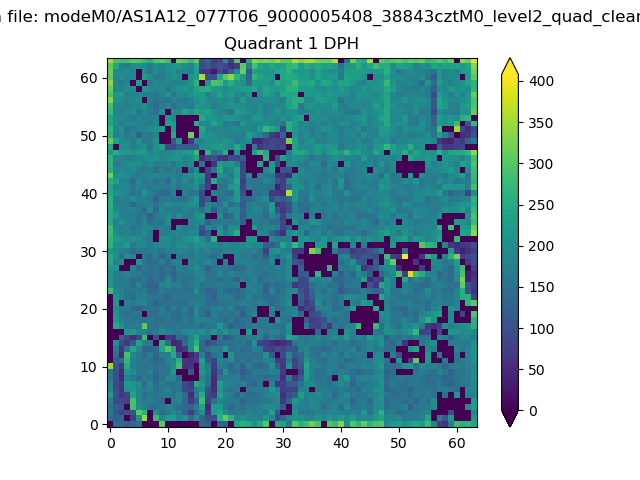
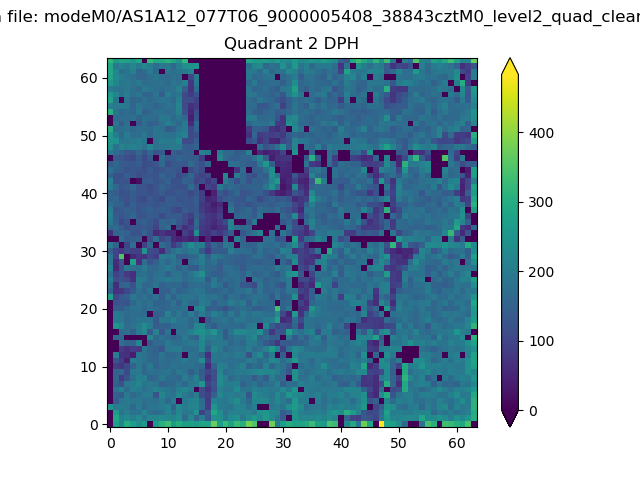
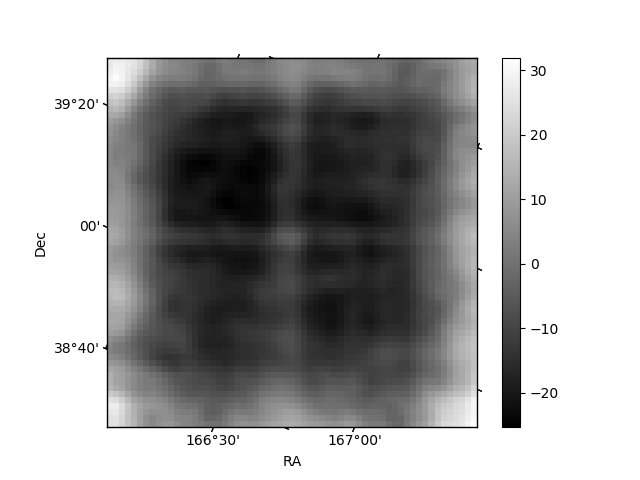
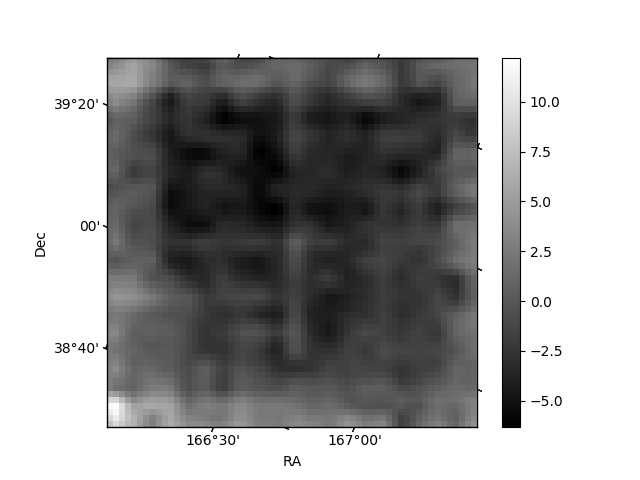
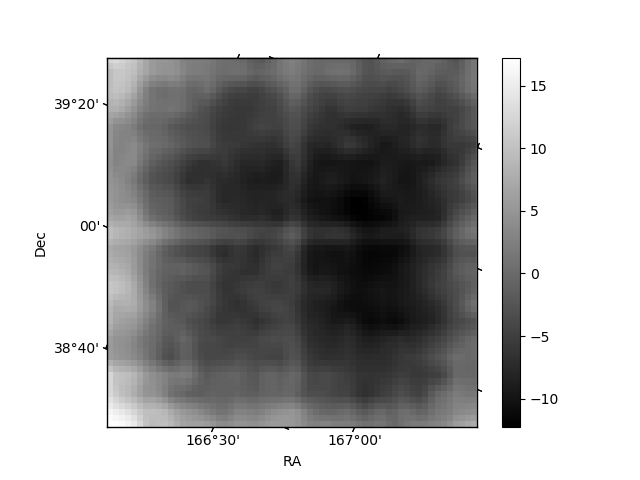
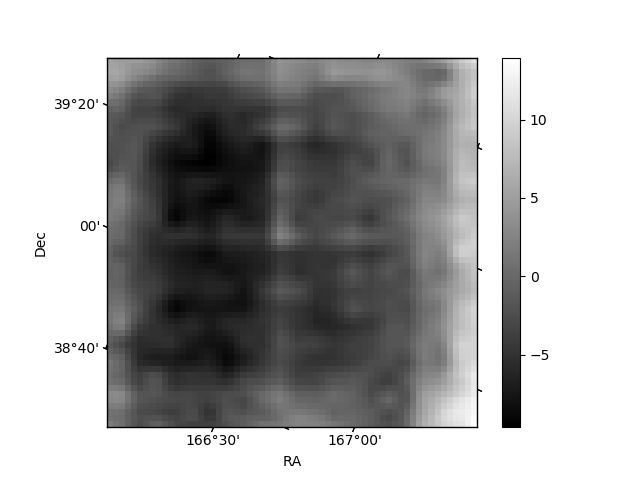
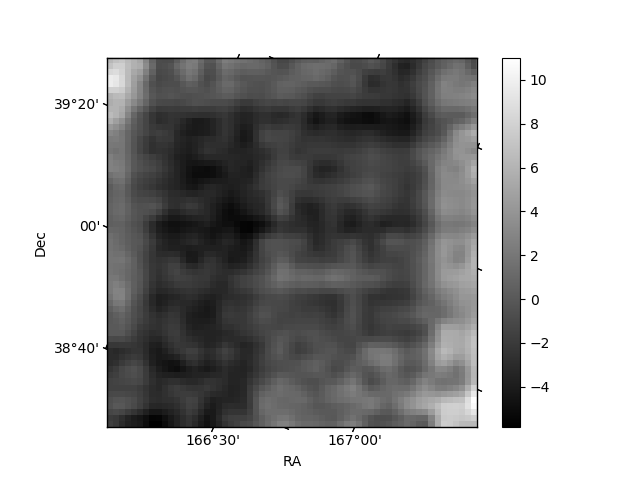
Histogram calculated using DETX and DETY for each event in the final _common_clean file
| Quadrant A | 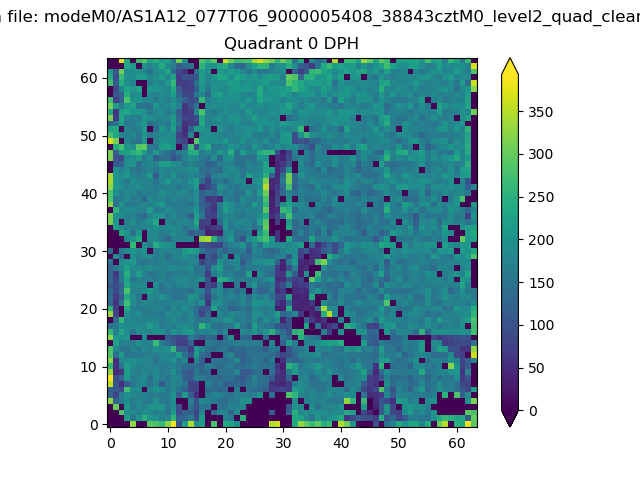 |
 |
Quadrant B |
|---|---|---|---|
| Quadrant D | 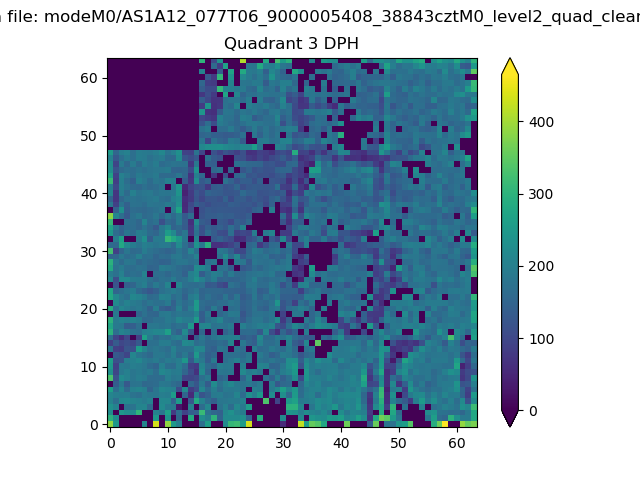 |
 |
Quadrant C |
| Plot type | Count rate plots | Images |
|---|---|---|
| Comparison with Poisson distribution Blue bars denote a histogram of data divided into 1 sec bins. Red curve is a Poisson curve with rate = median count rate of data. |
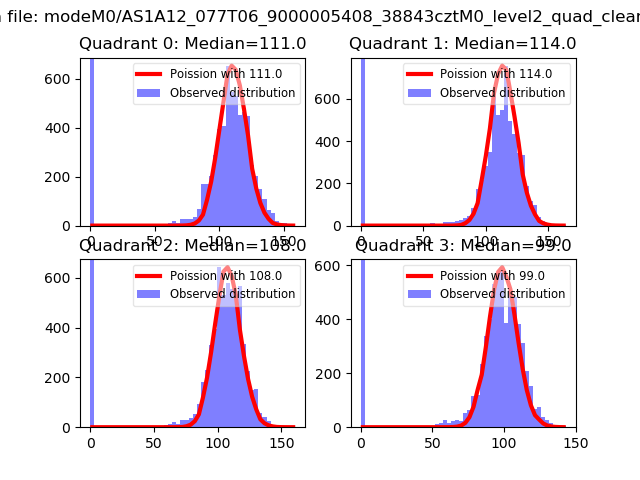 |
 |
| Quadrant-wise count rates Data is divided into 100 sec bins |
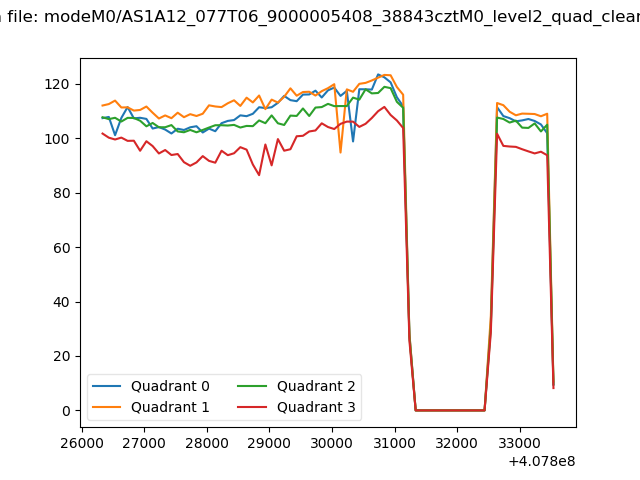 |
|
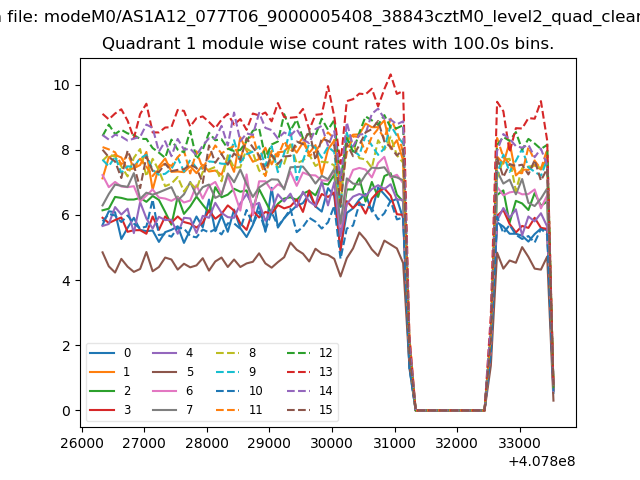
| Module-wise count rates for Quadrant A Data is divided into 100 sec bins |
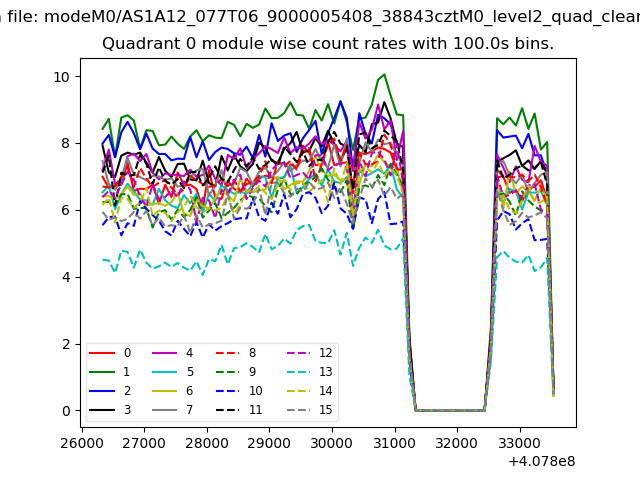 |
 |
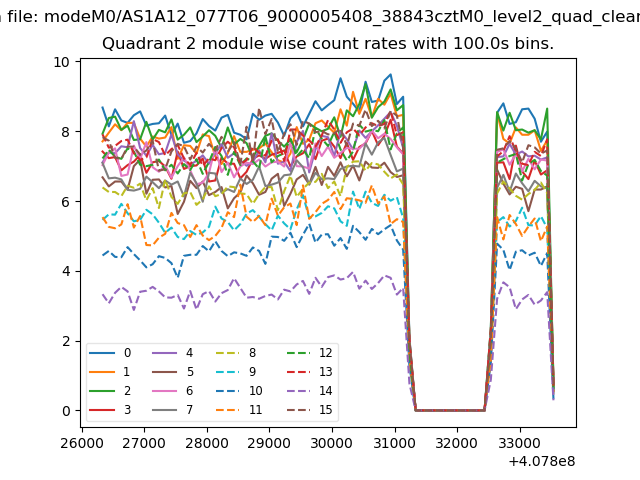
| Module-wise count rates for Quadrant B Data is divided into 100 sec bins |
 |
 |
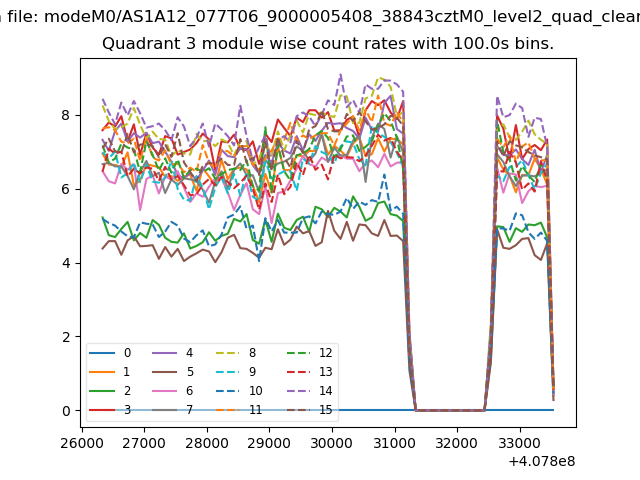
| Module-wise count rates for Quadrant C Data is divided into 100 sec bins |
 |
 |
| Module-wise count rates for Quadrant D Data is divided into 100 sec bins |
 |
 |
| Parameter | Plot |
|---|---|
| CZT HV Monitor | 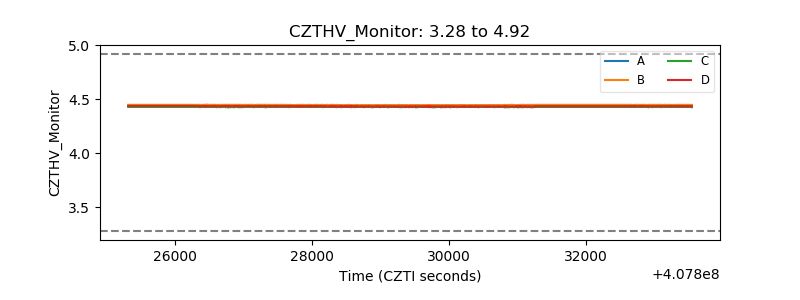 |
| D_VDD | 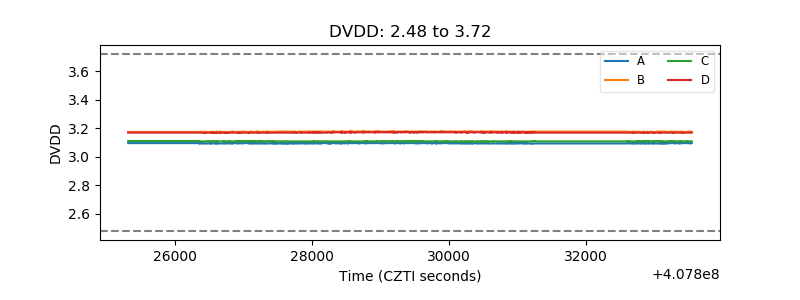 |
| Temperature 1 | 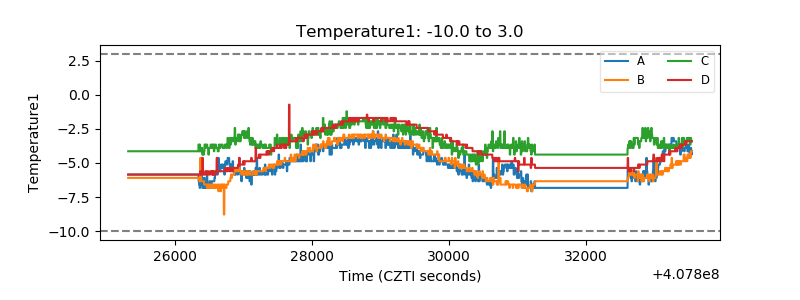 |
| Veto HV Monitor | 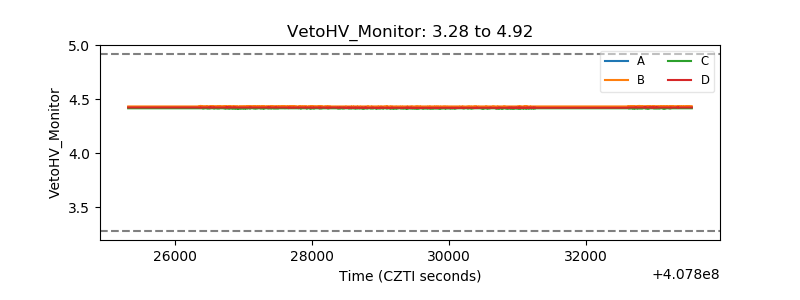 |
| Veto LLD | 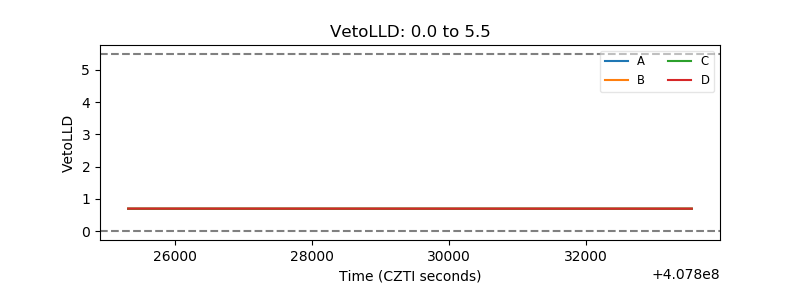 |
| Alpha Counter | 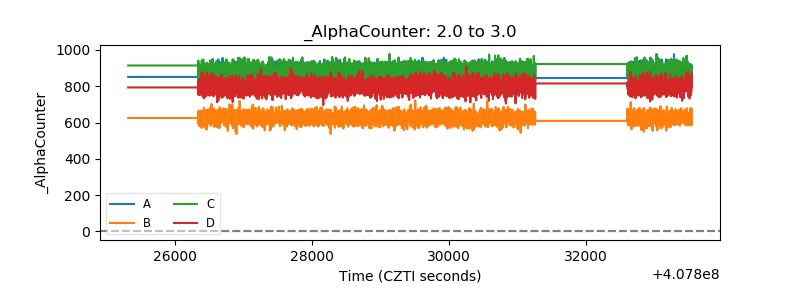 |
| _CPM_Rate | 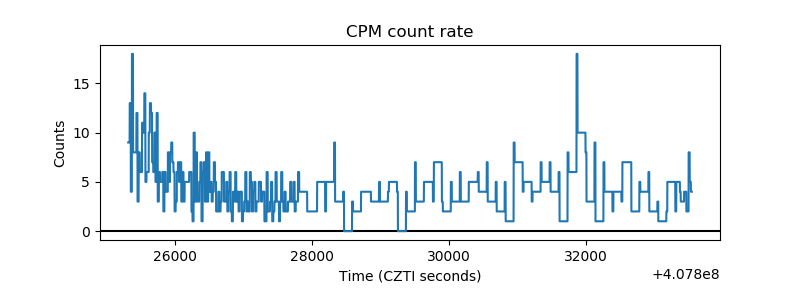 |
| CZT Counter | 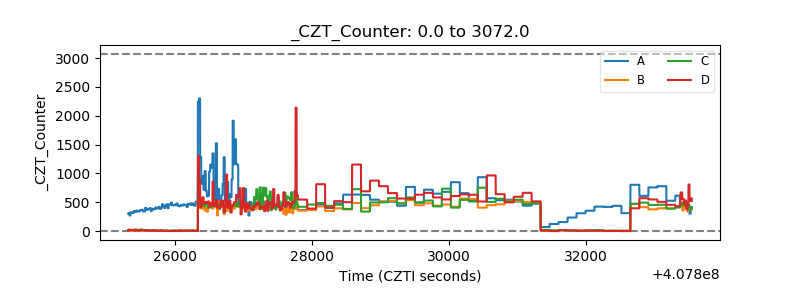 |
| +2.5 Volts monitor |  |
| +5 Volts monitor | 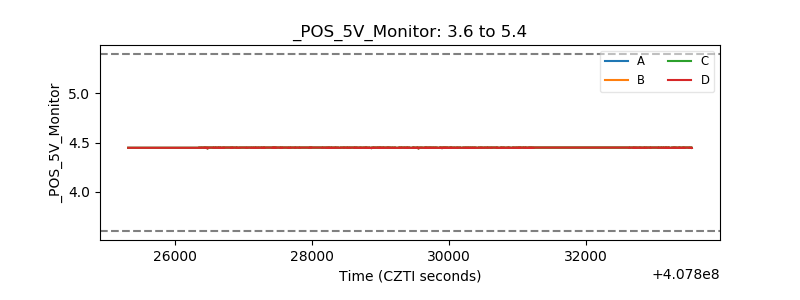 |
| _ROLL_ROT | 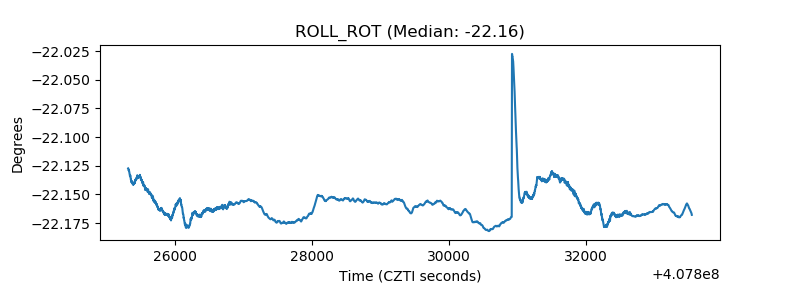 |
| _Roll_DEC | 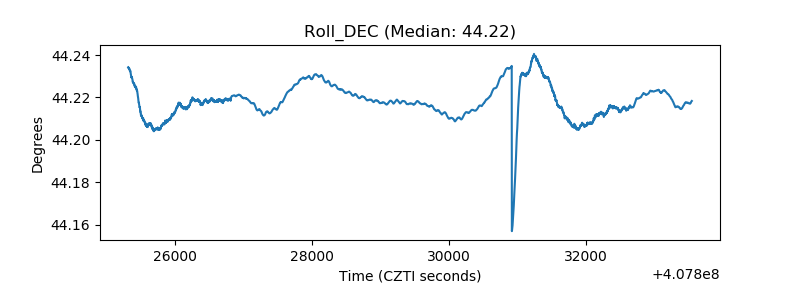 |
| _Roll_RA | 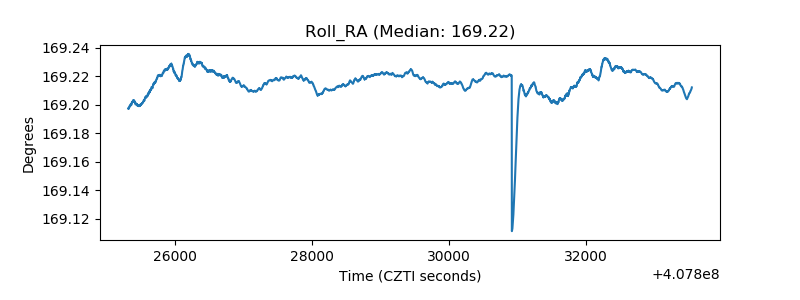 |
| Veto Counter | 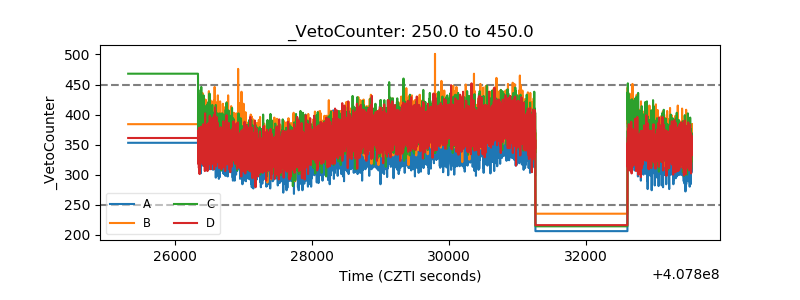 |