| Param | Original file | Final file |
|---|---|---|
| Filename | modeM0/AS1A12_077T06_9000005408_38844cztM0_level2.fits | modeM0/AS1A12_077T06_9000005408_38844cztM0_level2_quad_clean.evt |
| Size (bytes) | 366,258,240 | 98,432,640 |
| Size | 349.3 MB | 93.9 MB |
| Events in quadrant A | 3,246,999 | 658,069 |
| Events in quadrant B | 3,110,507 | 678,431 |
| Events in quadrant C | 2,798,889 | 643,280 |
| Events in quadrant D | 3,933,887 | 581,270 |
| Mode M9 | |||
|---|---|---|---|
| Quadrant | BADHDUFLAG | Total packets | Discarded packets |
| A | 0 | 13 | 0 |
| B | 0 | 13 | 0 |
| C | 0 | 13 | 0 |
| D | 0 | 14 | 0 |
| Mode SS | |||
|---|---|---|---|
| Quadrant | BADHDUFLAG | Total packets | Discarded packets |
| A | 0 | 122 | 0 |
| B | 0 | 122 | 0 |
| C | 0 | 122 | 0 |
| D | 0 | 122 | 0 |
| Mode M0 | |||
|---|---|---|---|
| Quadrant | BADHDUFLAG | Total packets | Discarded packets |
| A | 0 | 13155 | 3 |
| B | 0 | 13386 | 2 |
| C | 0 | 12089 | 2 |
| D | 0 | 15699 | 2 |
| Quadrant | Total seconds | Saturated seconds | Saturation percentage |
|---|---|---|---|
| A | 6004 | 21 | 0.349767% |
| B | 6004 | 23 | 0.383078% |
| C | 6004 | 2 | 0.033311% |
| D | 6004 | 166 | 2.764823% |
Noise dominated data is calculated using 1-second bins in cleaned event files. If a bin has >2000 counts, and if more than 50% of those come from <1% of pixels, then it is considered to be noise-dominated and hence unusable.
| Quadrant | # 1 sec bins | Bins with >0 counts | Bins with >2000 counts | High rate bins dominated by noise | Noise dominated (total time) | Noise dominated (detector-on time) | Marked lightcurve |
|---|---|---|---|---|---|---|---|
| A | 7288 | 6005 | 19 | 19 | 0.26% | 0.32% | 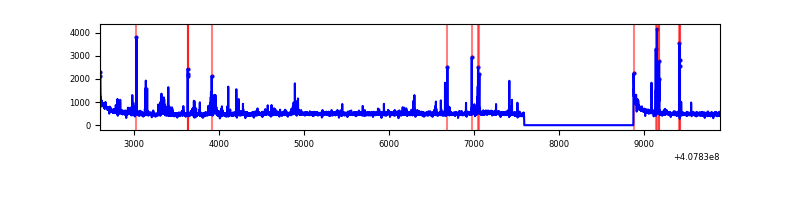 |
| B | 7288 | 6005 | 7 | 7 | 0.10% | 0.12% | 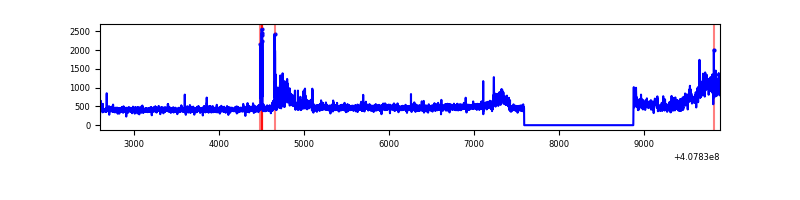 |
| C | 7288 | 6005 | 0 | 0 | 0.00% | 0.00% |  |
| D | 7288 | 6005 | 117 | 117 | 1.61% | 1.95% | 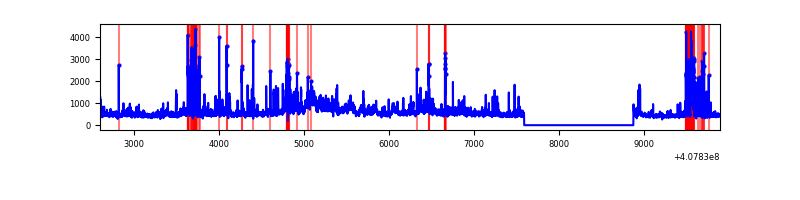 |
Top three noisy pixels from each quadrant. If the there are fewer than three noisy pixels in the level2.evt file, extra rows are filled as -1
| Pixel properties | Quadrant properties | ||||||
|---|---|---|---|---|---|---|---|
| Quadrant | DetID | PixID | Counts | Sigma | Mean | Median | Sigma |
| A | 10 | 83 | 439843 | 3209.54 | 664 | 650 | 136.8 |
| A | 13 | 248 | 107832 | 783.27 | 664 | 650 | 136.8 |
| A | 9 | 143 | 89486 | 649.2 | 664 | 650 | 136.8 |
| B | 5 | 184 | 405197 | 3125.95 | 660 | 641 | 129.4 |
| B | 5 | 172 | 43513 | 331.27 | 660 | 641 | 129.4 |
| B | 15 | 32 | 18673 | 139.33 | 660 | 641 | 129.4 |
| C | 15 | 214 | 247670 | 1638.87 | 646 | 649 | 150.7 |
| C | 3 | 233 | 15026 | 95.38 | 646 | 649 | 150.7 |
| C | 15 | 208 | 13710 | 86.65 | 646 | 649 | 150.7 |
| D | 12 | 235 | 399131 | 2559.84 | 640 | 623 | 155.7 |
| D | 2 | 249 | 319553 | 2048.66 | 640 | 623 | 155.7 |
| D | 12 | 227 | 194054 | 1242.51 | 640 | 623 | 155.7 |
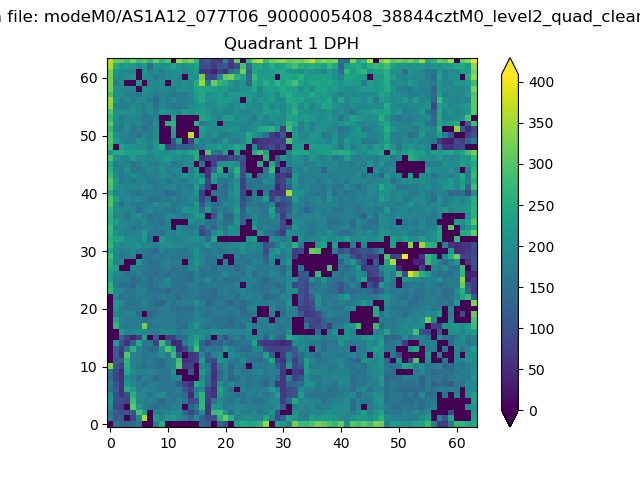
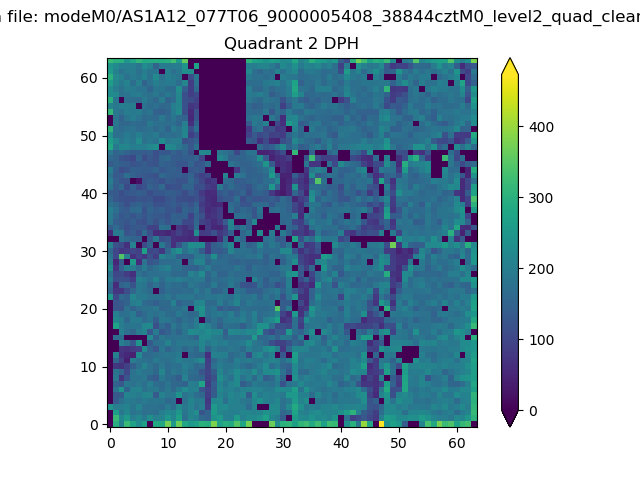
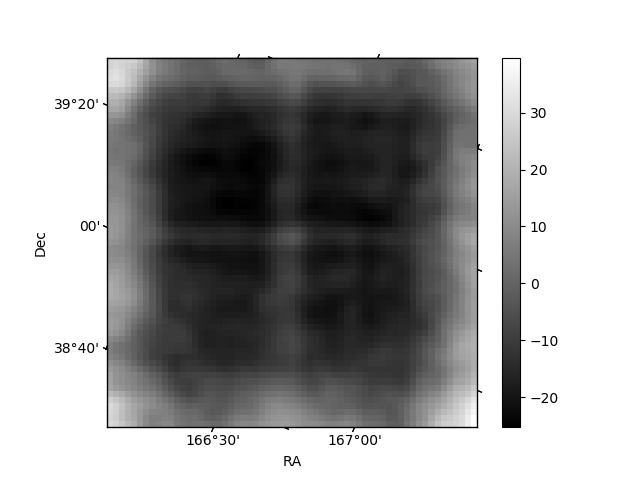
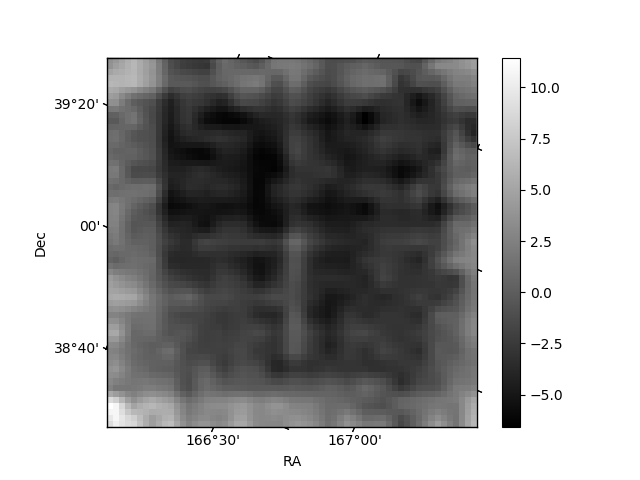
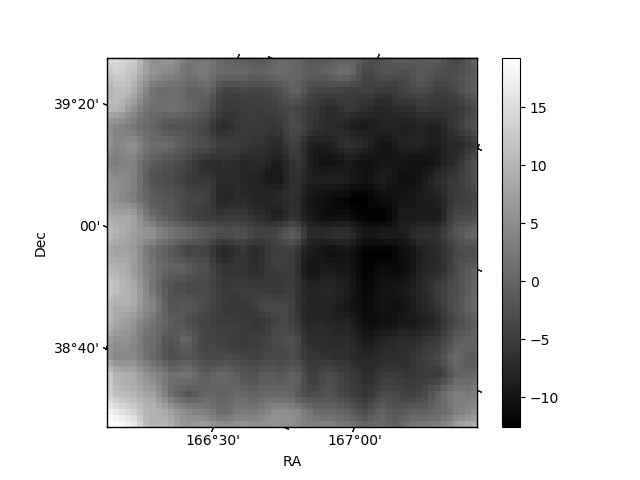
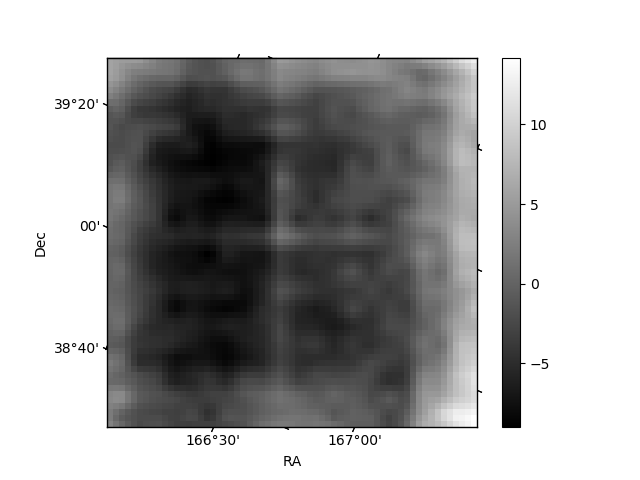
Histogram calculated using DETX and DETY for each event in the final _common_clean file
| Quadrant A | 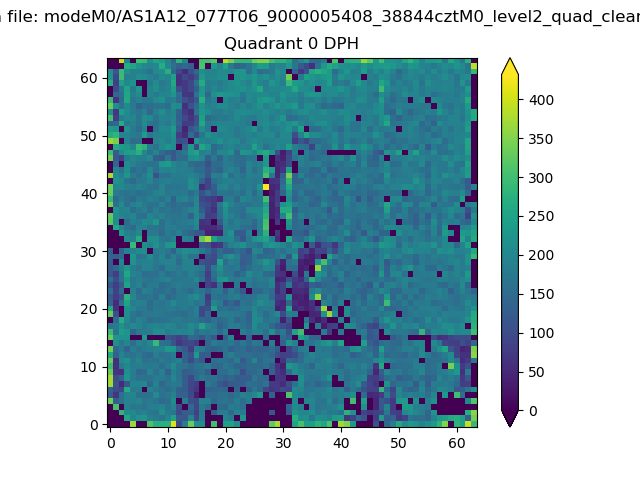 |
 |
Quadrant B |
|---|---|---|---|
| Quadrant D | 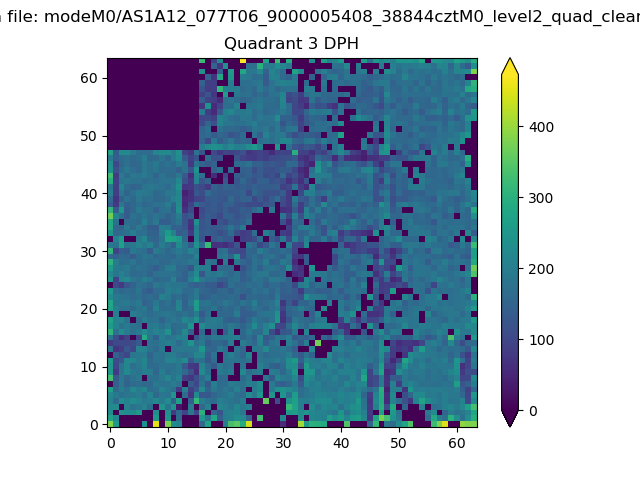 |
 |
Quadrant C |
| Plot type | Count rate plots | Images |
|---|---|---|
| Comparison with Poisson distribution Blue bars denote a histogram of data divided into 1 sec bins. Red curve is a Poisson curve with rate = median count rate of data. |
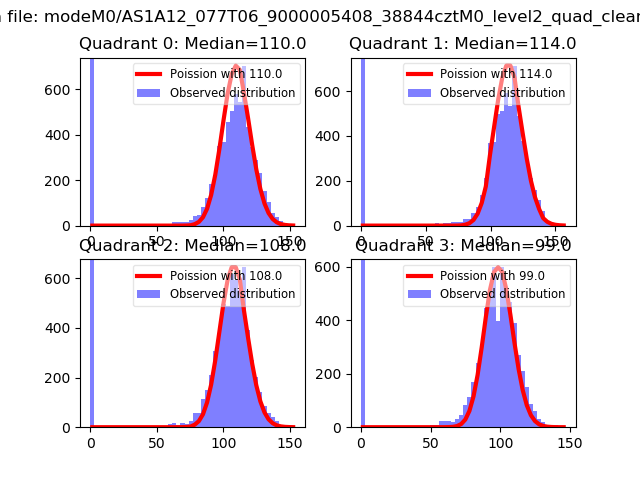 |
 |
| Quadrant-wise count rates Data is divided into 100 sec bins |
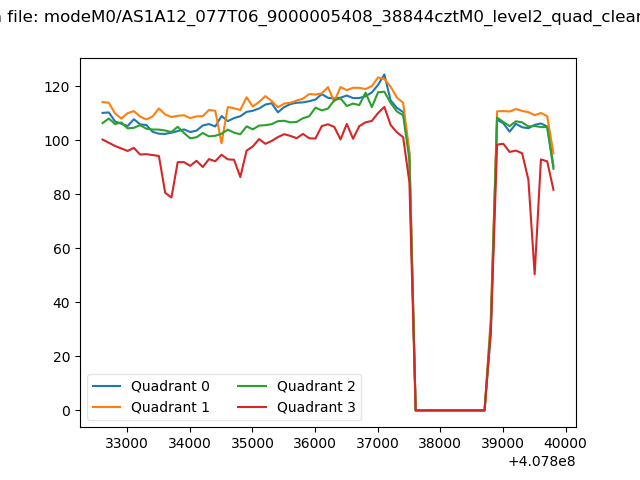 |
|
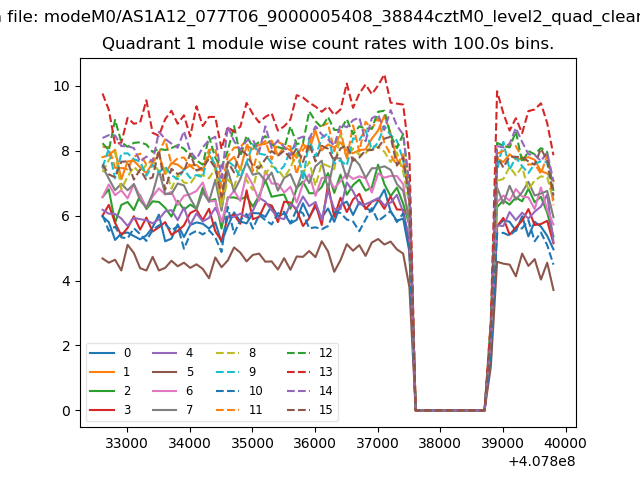
| Module-wise count rates for Quadrant A Data is divided into 100 sec bins |
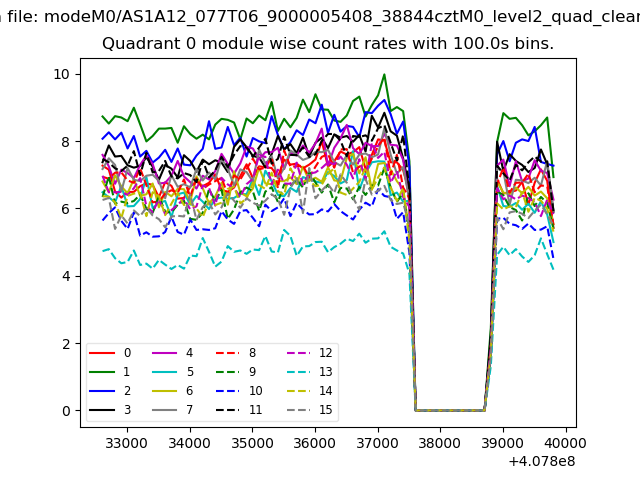 |
 |
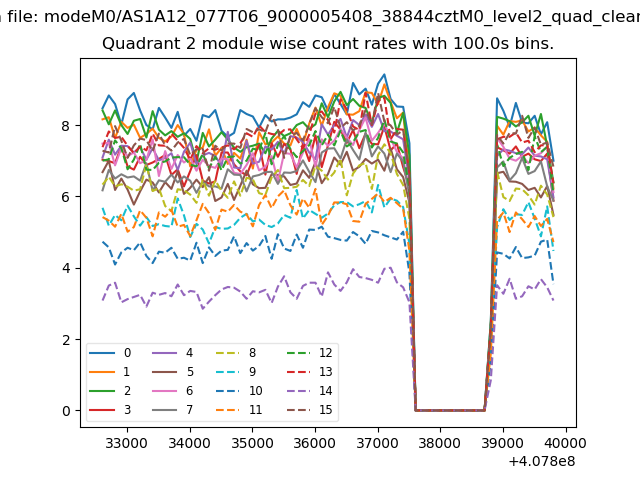
| Module-wise count rates for Quadrant B Data is divided into 100 sec bins |
 |
 |
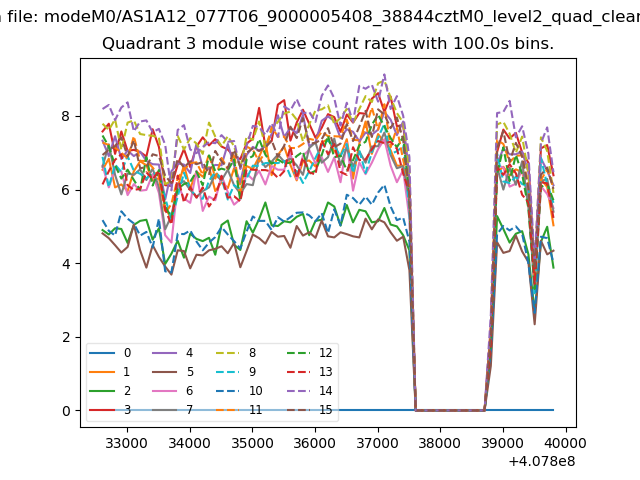
| Module-wise count rates for Quadrant C Data is divided into 100 sec bins |
 |
 |
| Module-wise count rates for Quadrant D Data is divided into 100 sec bins |
 |
 |
| Parameter | Plot |
|---|---|
| CZT HV Monitor | 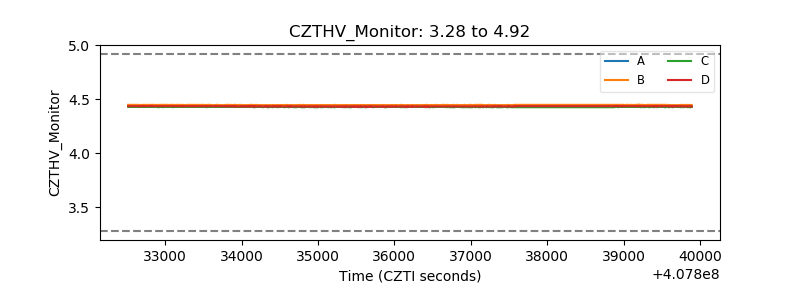 |
| D_VDD | 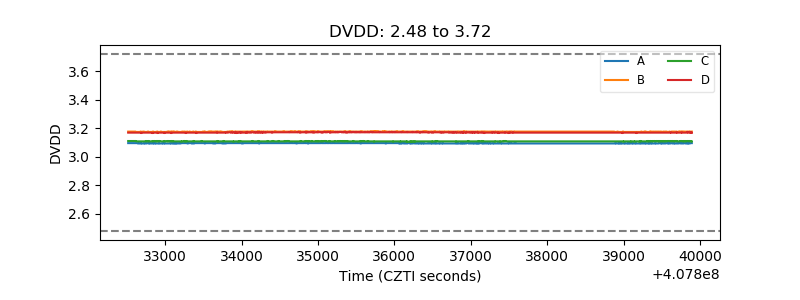 |
| Temperature 1 | 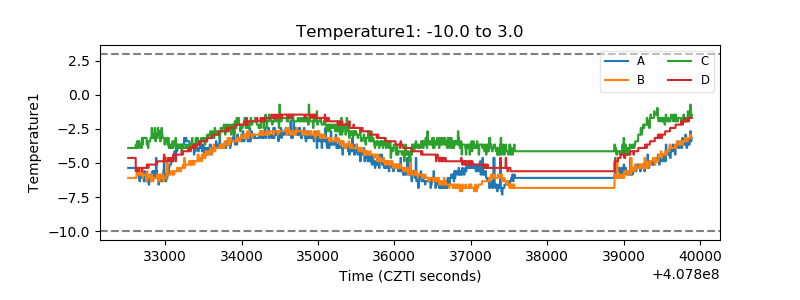 |
| Veto HV Monitor | 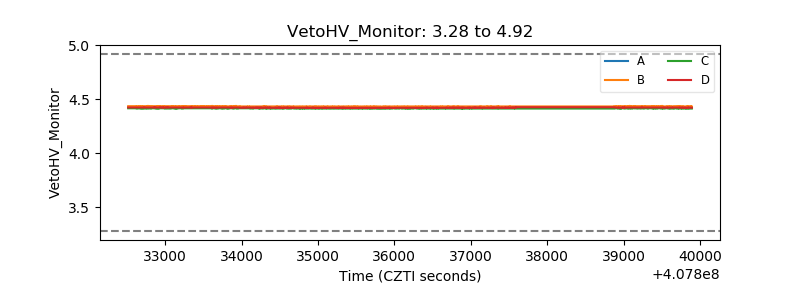 |
| Veto LLD | 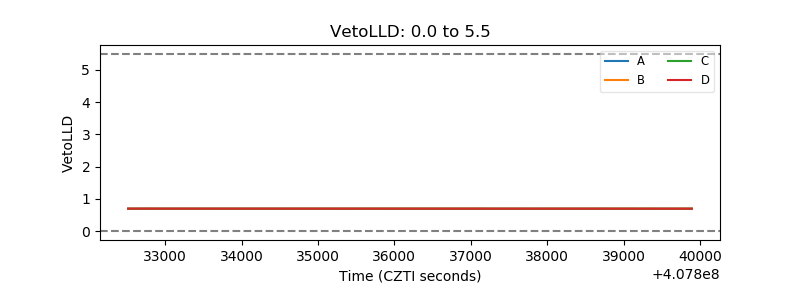 |
| Alpha Counter | 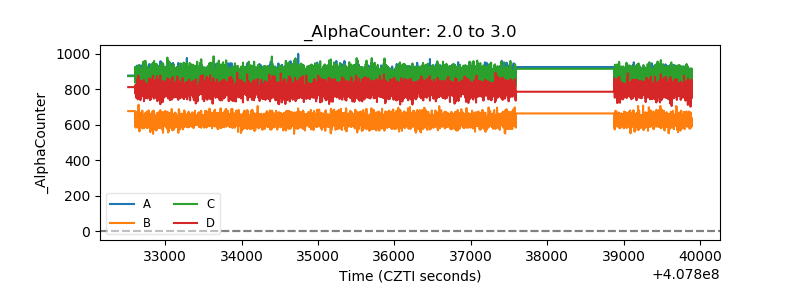 |
| _CPM_Rate | 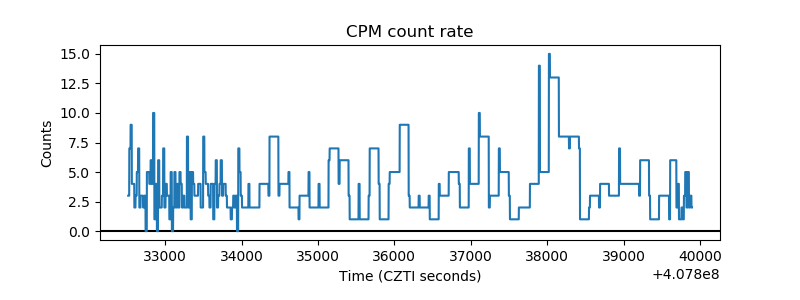 |
| CZT Counter | 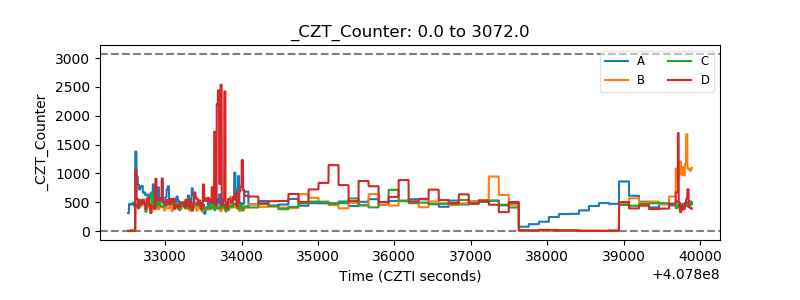 |
| +2.5 Volts monitor | 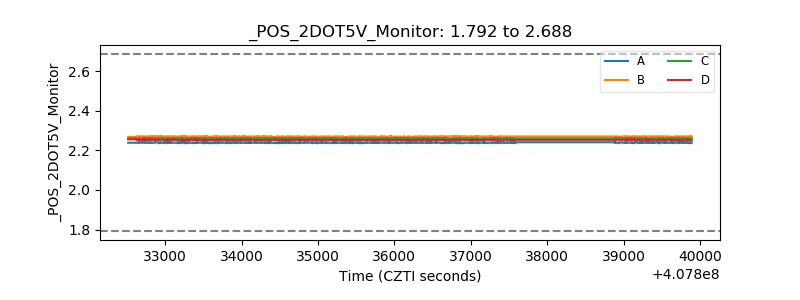 |
| +5 Volts monitor | 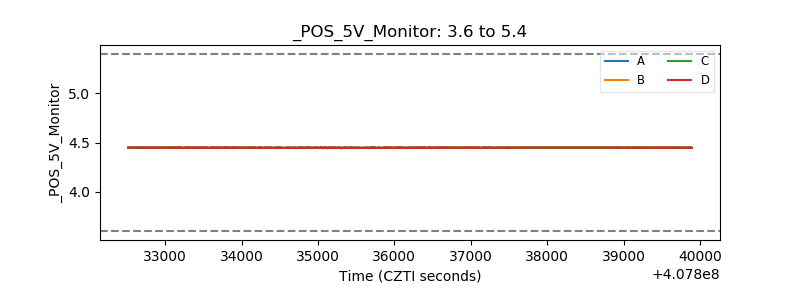 |
| _ROLL_ROT | 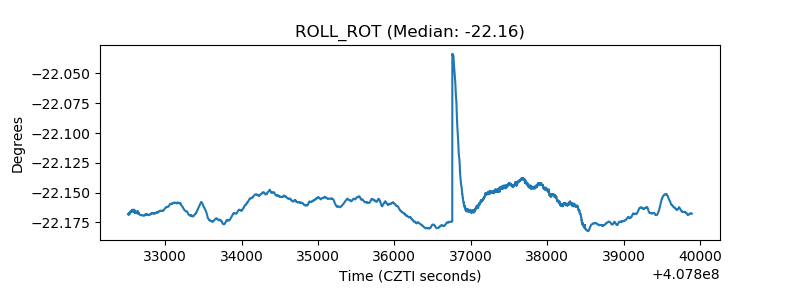 |
| _Roll_DEC | 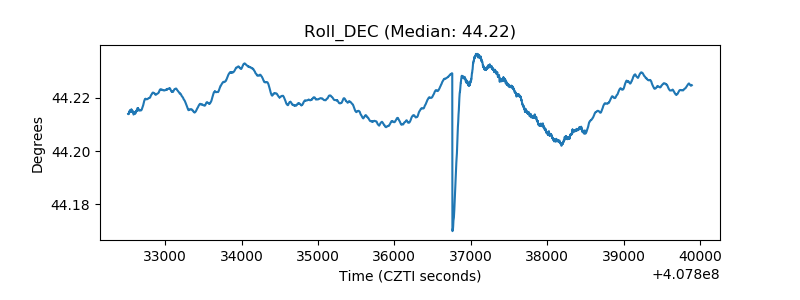 |
| _Roll_RA | 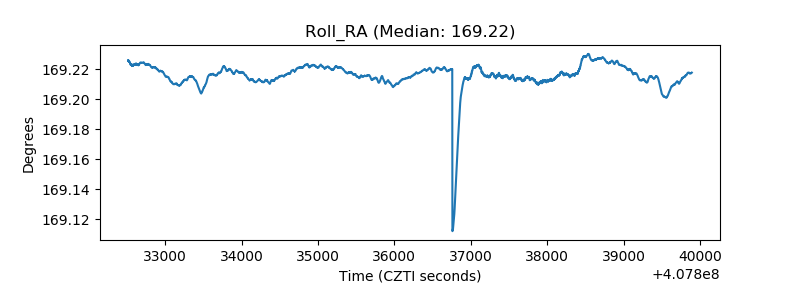 |
| Veto Counter | 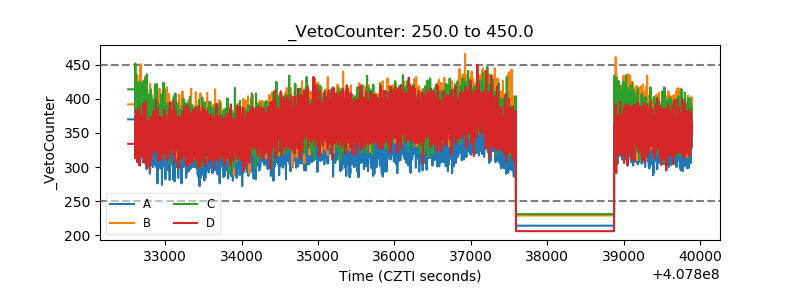 |