| Param | Original file | Final file |
|---|---|---|
| Filename | modeM0/AS1A12_077T06_9000005408_38846cztM0_level2.fits | modeM0/AS1A12_077T06_9000005408_38846cztM0_level2_quad_clean.evt |
| Size (bytes) | 315,685,440 | 85,538,880 |
| Size | 301.1 MB | 81.6 MB |
| Events in quadrant A | 2,633,863 | 572,567 |
| Events in quadrant B | 3,026,957 | 587,982 |
| Events in quadrant C | 2,455,668 | 558,637 |
| Events in quadrant D | 3,165,698 | 507,903 |
| Mode M9 | |||
|---|---|---|---|
| Quadrant | BADHDUFLAG | Total packets | Discarded packets |
| A | 0 | 13 | 0 |
| B | 0 | 13 | 0 |
| C | 0 | 13 | 0 |
| D | 0 | 13 | 0 |
| Mode SS | |||
|---|---|---|---|
| Quadrant | BADHDUFLAG | Total packets | Discarded packets |
| A | 0 | 106 | 0 |
| B | 0 | 106 | 0 |
| C | 0 | 106 | 0 |
| D | 0 | 106 | 0 |
| Mode M0 | |||
|---|---|---|---|
| Quadrant | BADHDUFLAG | Total packets | Discarded packets |
| A | 0 | 10837 | 2 |
| B | 0 | 12473 | 1 |
| C | 0 | 10475 | 1 |
| D | 0 | 12828 | 1 |
| Quadrant | Total seconds | Saturated seconds | Saturation percentage |
|---|---|---|---|
| A | 5178 | 17 | 0.328312% |
| B | 5178 | 28 | 0.540749% |
| C | 5178 | 2 | 0.038625% |
| D | 5178 | 106 | 2.047122% |
Noise dominated data is calculated using 1-second bins in cleaned event files. If a bin has >2000 counts, and if more than 50% of those come from <1% of pixels, then it is considered to be noise-dominated and hence unusable.
| Quadrant | # 1 sec bins | Bins with >0 counts | Bins with >2000 counts | High rate bins dominated by noise | Noise dominated (total time) | Noise dominated (detector-on time) | Marked lightcurve |
|---|---|---|---|---|---|---|---|
| A | 6491 | 5179 | 10 | 10 | 0.15% | 0.19% |  |
| B | 6491 | 5179 | 6 | 6 | 0.09% | 0.12% | 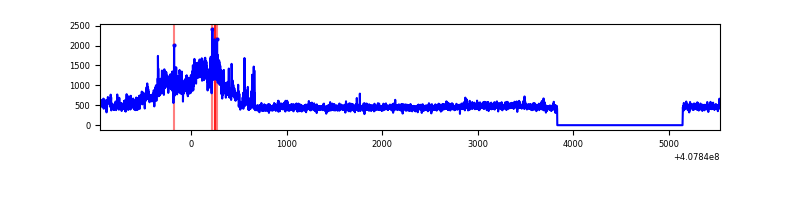 |
| C | 6491 | 5179 | 0 | 0 | 0.00% | 0.00% | 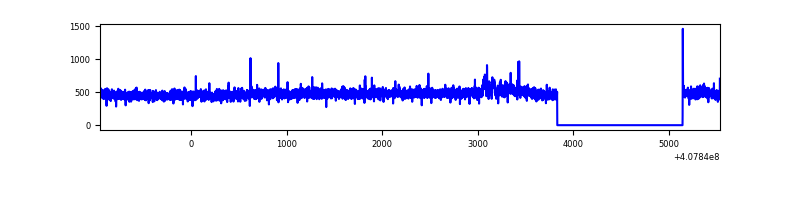 |
| D | 6491 | 5179 | 81 | 81 | 1.25% | 1.56% | 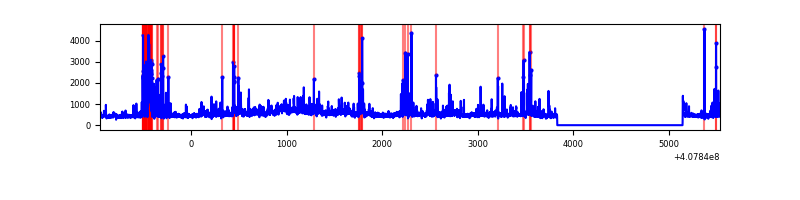 |
Top three noisy pixels from each quadrant. If the there are fewer than three noisy pixels in the level2.evt file, extra rows are filled as -1
| Pixel properties | Quadrant properties | ||||||
|---|---|---|---|---|---|---|---|
| Quadrant | DetID | PixID | Counts | Sigma | Mean | Median | Sigma |
| A | 10 | 83 | 334523 | 2803.05 | 578 | 564 | 119.1 |
| A | 9 | 143 | 40707 | 336.94 | 578 | 564 | 119.1 |
| A | 13 | 248 | 17784 | 144.53 | 578 | 564 | 119.1 |
| B | 5 | 184 | 716561 | 6383.12 | 574 | 558 | 112.2 |
| B | 5 | 172 | 15914 | 136.9 | 574 | 558 | 112.2 |
| B | 12 | 111 | 14238 | 121.96 | 574 | 558 | 112.2 |
| C | 15 | 214 | 215039 | 1609.05 | 565 | 569 | 133.3 |
| C | 3 | 233 | 26806 | 196.84 | 565 | 569 | 133.3 |
| C | 15 | 208 | 7031 | 48.48 | 565 | 569 | 133.3 |
| D | 12 | 235 | 291560 | 2122.27 | 558 | 543 | 137.1 |
| D | 2 | 249 | 162901 | 1184.01 | 558 | 543 | 137.1 |
| D | 10 | 118 | 143622 | 1043.42 | 558 | 543 | 137.1 |
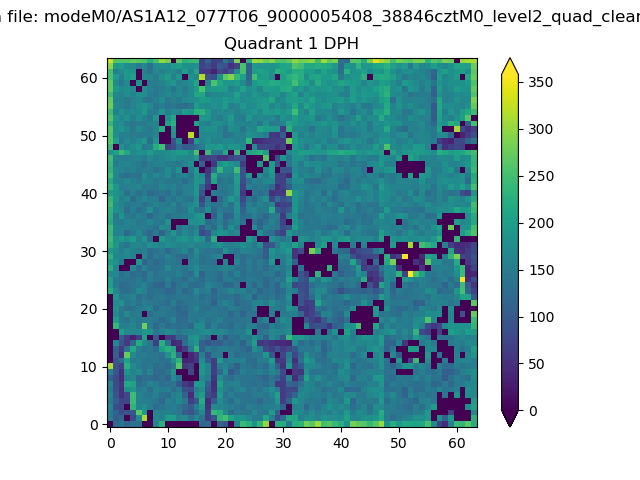
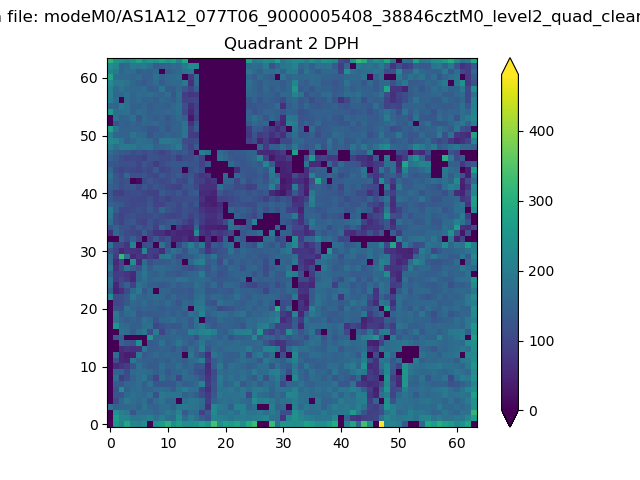
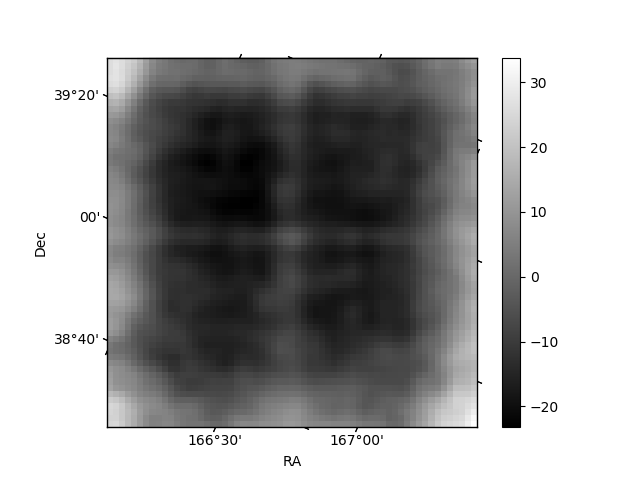
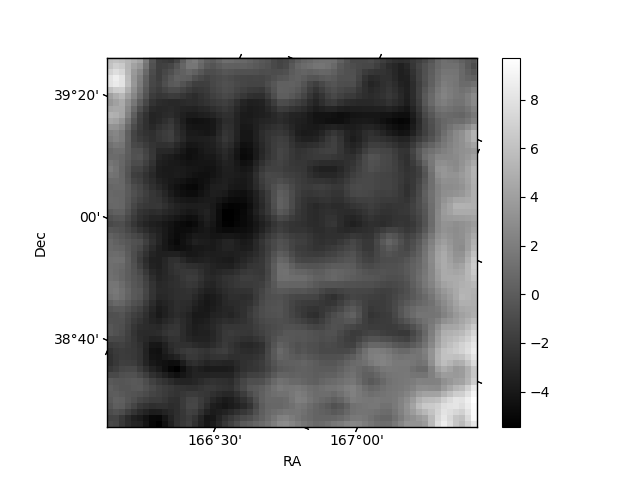
Histogram calculated using DETX and DETY for each event in the final _common_clean file
| Quadrant A | 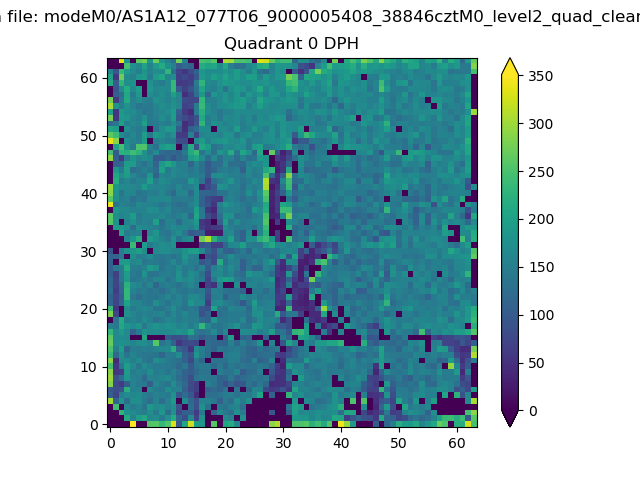 |
 |
Quadrant B |
|---|---|---|---|
| Quadrant D | 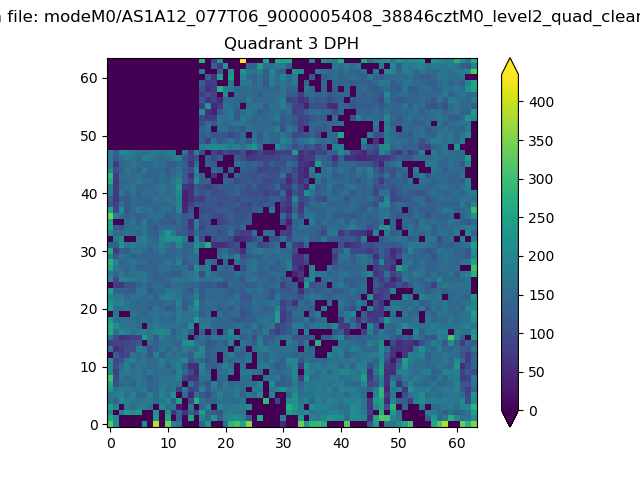 |
 |
Quadrant C |
| Plot type | Count rate plots | Images |
|---|---|---|
| Comparison with Poisson distribution Blue bars denote a histogram of data divided into 1 sec bins. Red curve is a Poisson curve with rate = median count rate of data. |
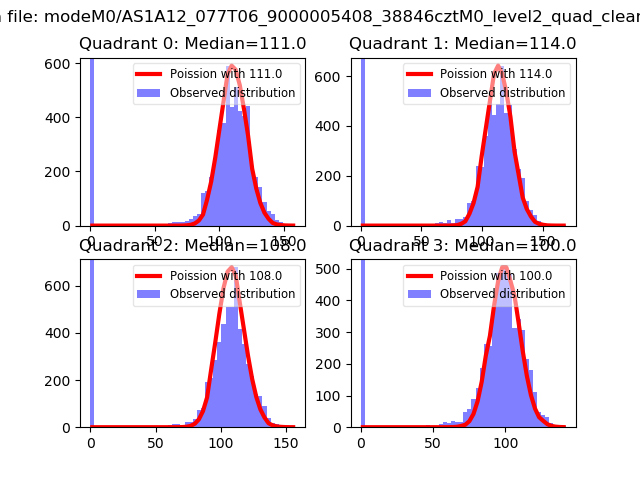 |
 |
| Quadrant-wise count rates Data is divided into 100 sec bins |
 |
|
| Module-wise count rates for Quadrant A Data is divided into 100 sec bins |
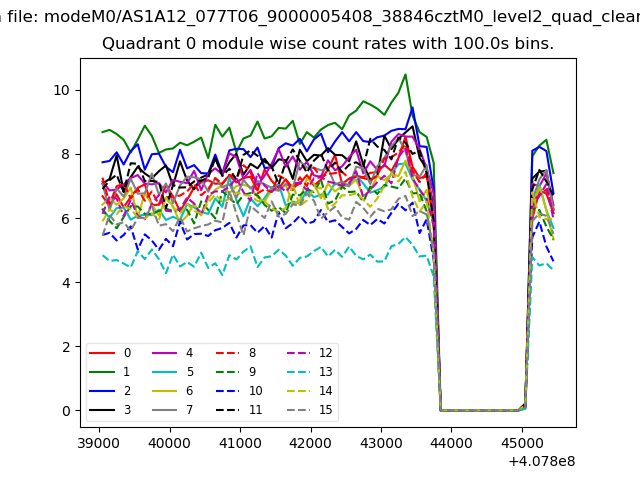 |
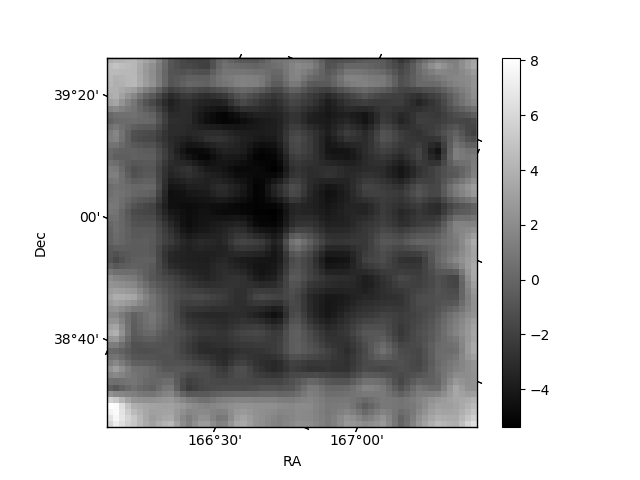 |
| Module-wise count rates for Quadrant B Data is divided into 100 sec bins |
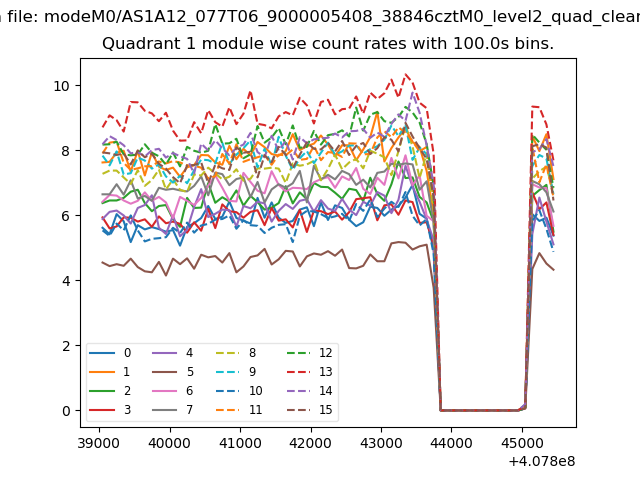 |
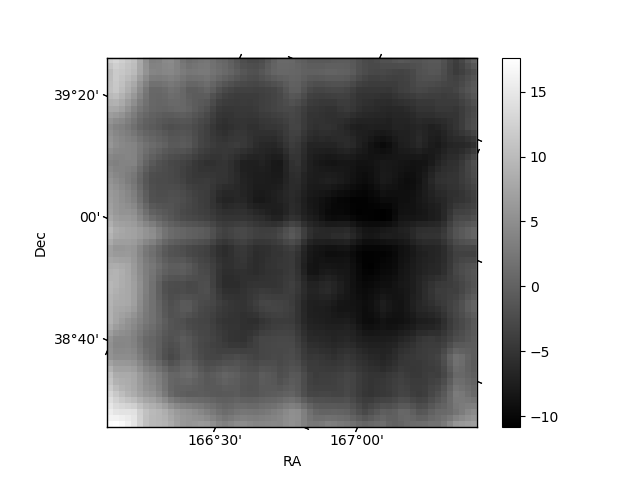 |
| Module-wise count rates for Quadrant C Data is divided into 100 sec bins |
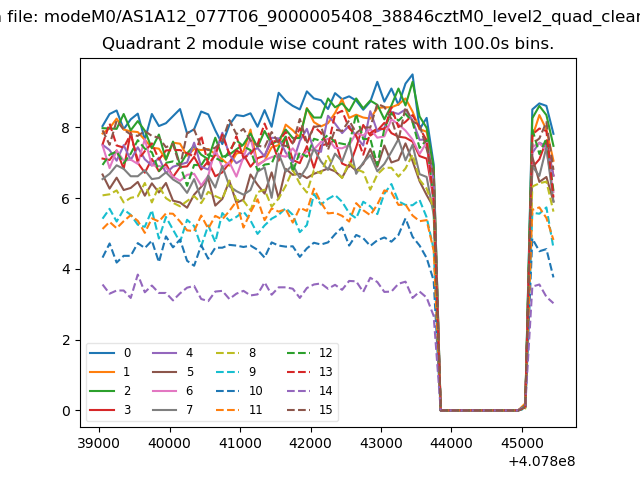 |
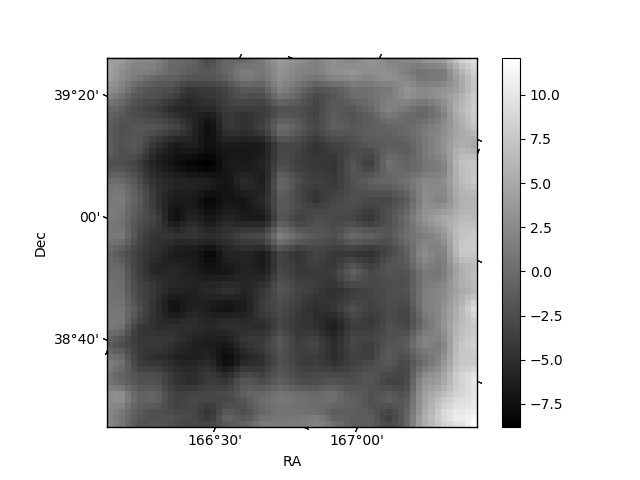 |
| Module-wise count rates for Quadrant D Data is divided into 100 sec bins |
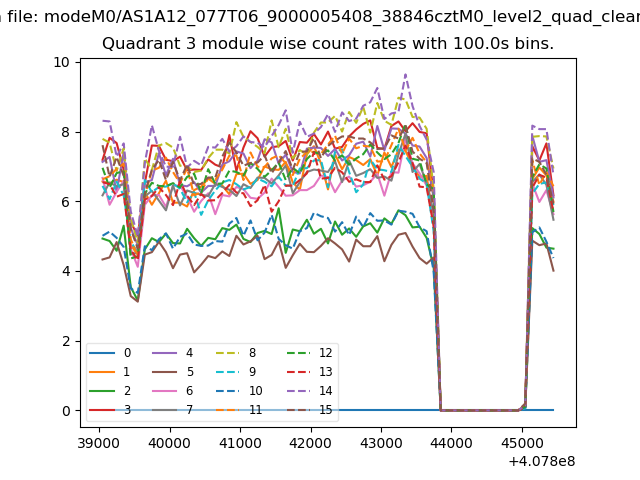 |
 |
| Parameter | Plot |
|---|---|
| CZT HV Monitor | 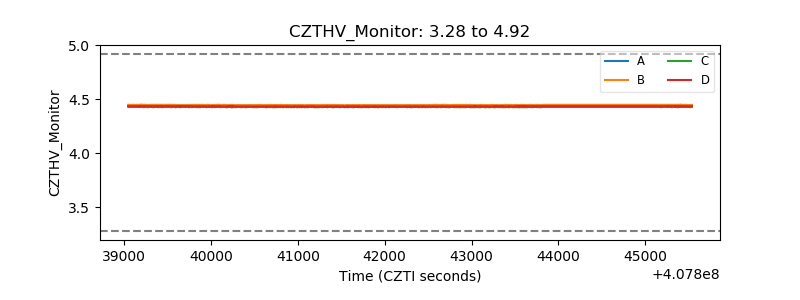 |
| D_VDD | 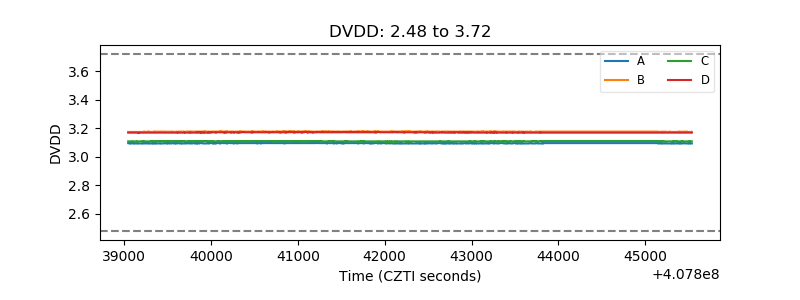 |
| Temperature 1 | 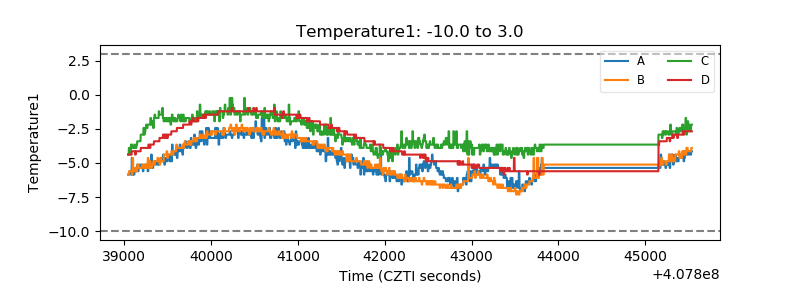 |
| Veto HV Monitor | 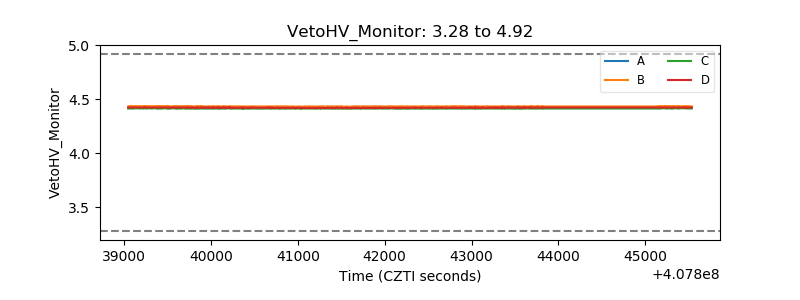 |
| Veto LLD | 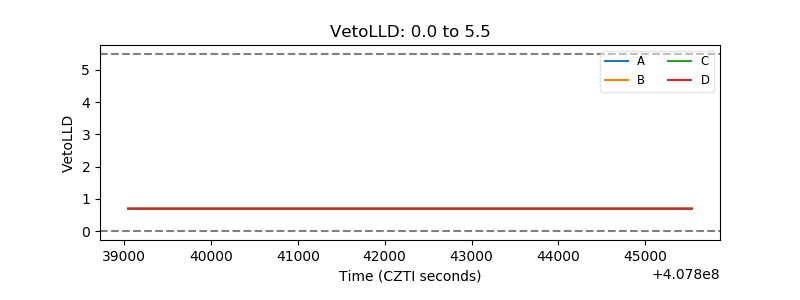 |
| Alpha Counter | 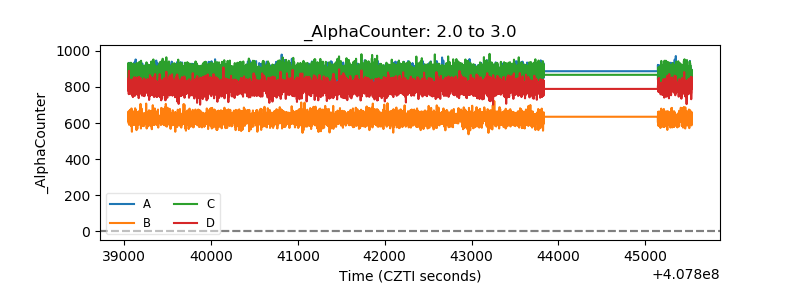 |
| _CPM_Rate | 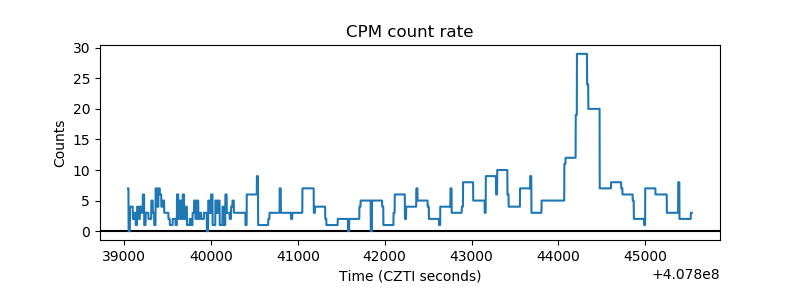 |
| CZT Counter | 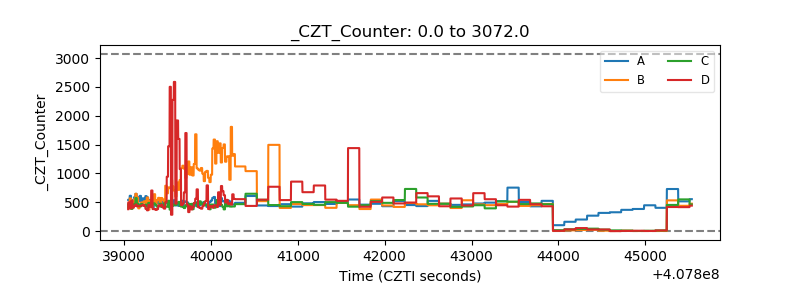 |
| +2.5 Volts monitor | 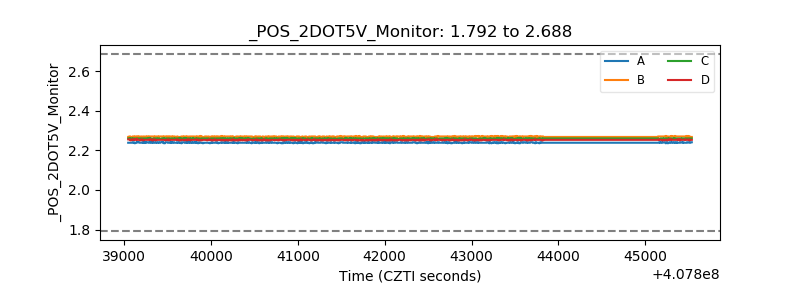 |
| +5 Volts monitor | 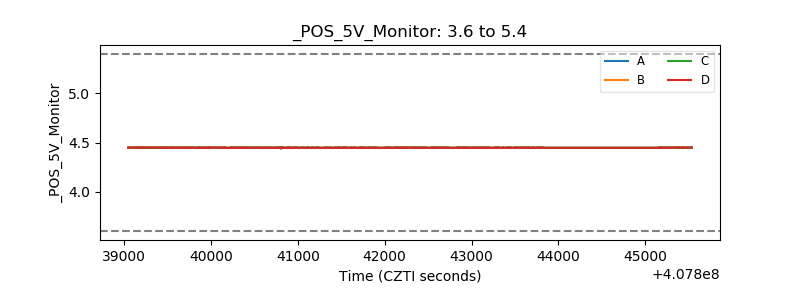 |
| _ROLL_ROT | 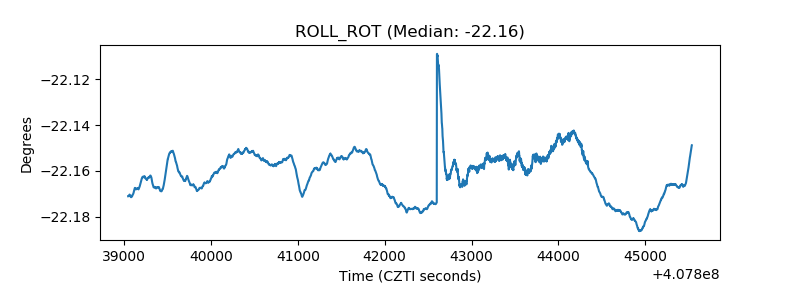 |
| _Roll_DEC | 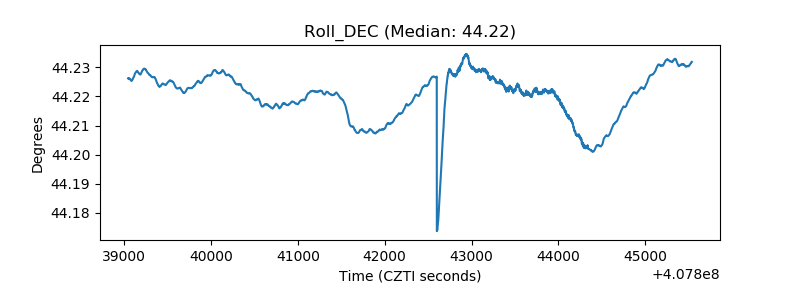 |
| _Roll_RA | 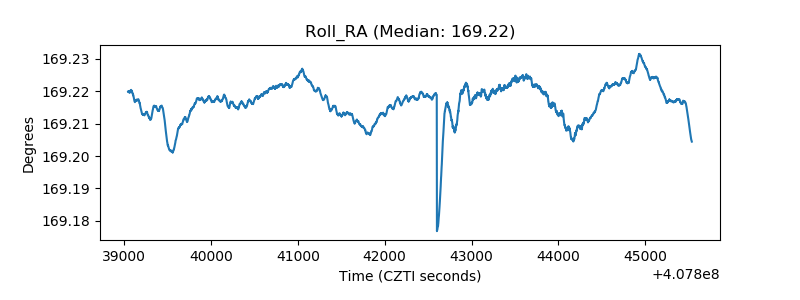 |
| Veto Counter | 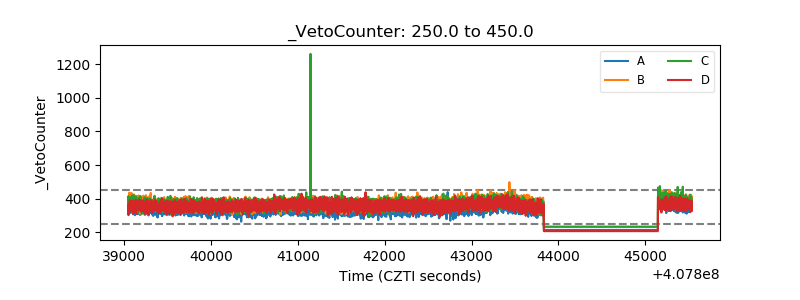 |