| Param | Original file | Final file |
|---|---|---|
| Filename | modeM0/AS1A12_077T06_9000005408_38847cztM0_level2.fits | modeM0/AS1A12_077T06_9000005408_38847cztM0_level2_quad_clean.evt |
| Size (bytes) | 693,529,920 | 164,888,640 |
| Size | 661.4 MB | 157.3 MB |
| Events in quadrant A | 5,454,329 | 1,139,527 |
| Events in quadrant B | 4,785,568 | 1,163,420 |
| Events in quadrant C | 5,062,912 | 1,099,918 |
| Events in quadrant D | 9,575,951 | 880,849 |
| Mode M9 | |||
|---|---|---|---|
| Quadrant | BADHDUFLAG | Total packets | Discarded packets |
| A | 0 | 29 | 0 |
| B | 0 | 29 | 0 |
| C | 0 | 29 | 0 |
| D | 0 | 29 | 0 |
| Mode SS | |||
|---|---|---|---|
| Quadrant | BADHDUFLAG | Total packets | Discarded packets |
| A | 0 | 208 | 0 |
| B | 0 | 208 | 0 |
| C | 0 | 208 | 0 |
| D | 0 | 208 | 0 |
| Mode M0 | |||
|---|---|---|---|
| Quadrant | BADHDUFLAG | Total packets | Discarded packets |
| A | 0 | 22333 | 3 |
| B | 0 | 20986 | 2 |
| C | 0 | 21268 | 2 |
| D | 0 | 35325 | 2 |
| Quadrant | Total seconds | Saturated seconds | Saturation percentage |
|---|---|---|---|
| A | 10231 | 67 | 0.654872% |
| B | 10231 | 28 | 0.273678% |
| C | 10231 | 61 | 0.596227% |
| D | 10231 | 1510 | 14.759066% |
Noise dominated data is calculated using 1-second bins in cleaned event files. If a bin has >2000 counts, and if more than 50% of those come from <1% of pixels, then it is considered to be noise-dominated and hence unusable.
| Quadrant | # 1 sec bins | Bins with >0 counts | Bins with >2000 counts | High rate bins dominated by noise | Noise dominated (total time) | Noise dominated (detector-on time) | Marked lightcurve |
|---|---|---|---|---|---|---|---|
| A | 13156 | 10233 | 45 | 45 | 0.34% | 0.44% | 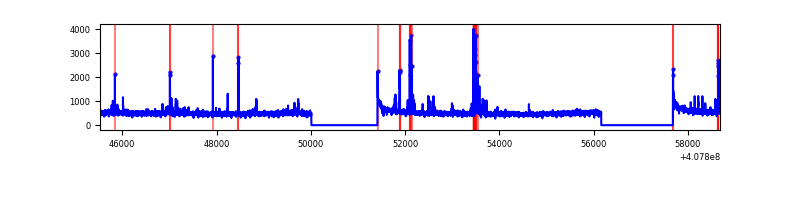 |
| B | 13156 | 10233 | 12 | 12 | 0.09% | 0.12% | 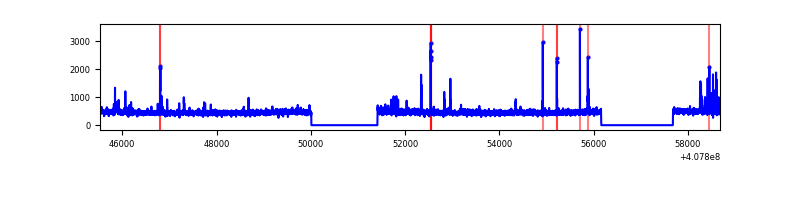 |
| C | 13156 | 10233 | 41 | 41 | 0.31% | 0.40% | 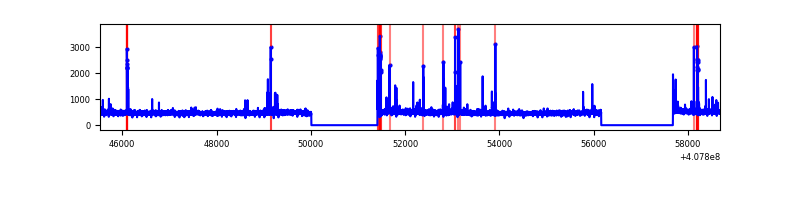 |
| D | 13156 | 10233 | 1347 | 1347 | 10.24% | 13.16% | 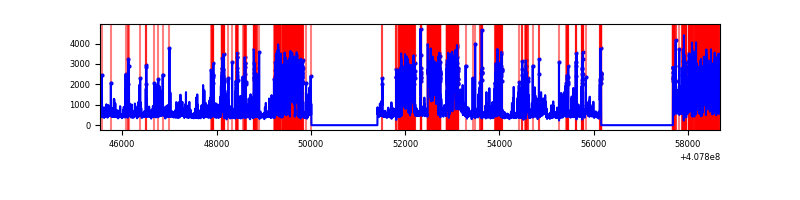 |
Top three noisy pixels from each quadrant. If the there are fewer than three noisy pixels in the level2.evt file, extra rows are filled as -1
| Pixel properties | Quadrant properties | ||||||
|---|---|---|---|---|---|---|---|
| Quadrant | DetID | PixID | Counts | Sigma | Mean | Median | Sigma |
| A | 10 | 83 | 650797 | 2776.45 | 1154 | 1130 | 234.0 |
| A | 9 | 143 | 254716 | 1083.74 | 1154 | 1130 | 234.0 |
| A | 13 | 248 | 82048 | 345.81 | 1154 | 1130 | 234.0 |
| B | 15 | 85 | 81630 | 363.85 | 1148 | 1115 | 221.3 |
| B | 5 | 172 | 49055 | 216.64 | 1148 | 1115 | 221.3 |
| B | 0 | 155 | 38132 | 167.28 | 1148 | 1115 | 221.3 |
| C | 15 | 214 | 416794 | 1587.0 | 1124 | 1129 | 261.9 |
| C | 14 | 254 | 181551 | 688.85 | 1124 | 1129 | 261.9 |
| C | 3 | 233 | 40227 | 149.28 | 1124 | 1129 | 261.9 |
| D | 2 | 250 | 1397372 | 5438.15 | 1051 | 1020 | 256.8 |
| D | 12 | 227 | 1221311 | 4752.48 | 1051 | 1020 | 256.8 |
| D | 12 | 233 | 1091535 | 4247.06 | 1051 | 1020 | 256.8 |
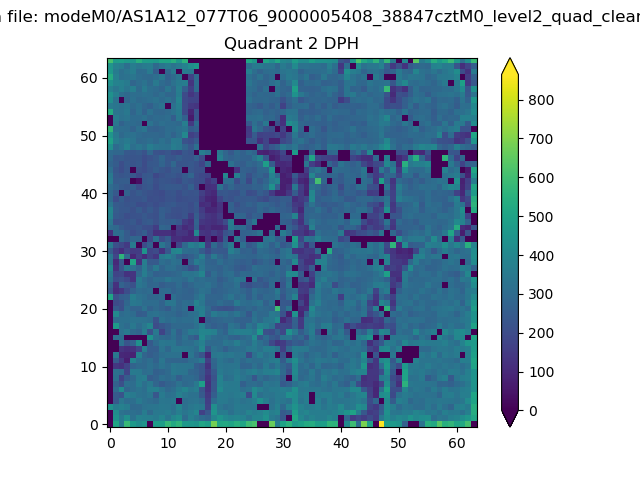
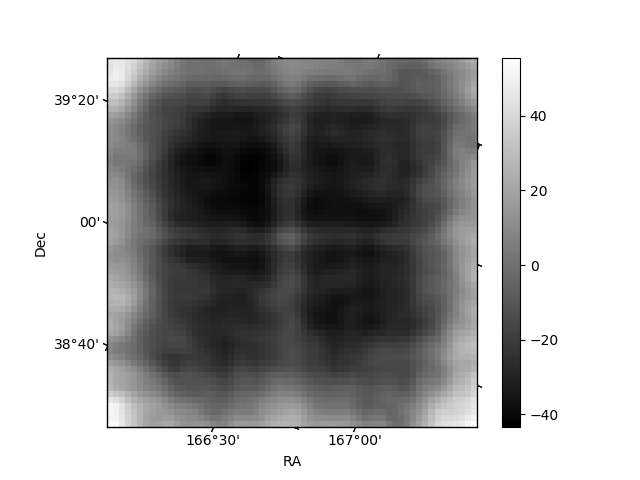
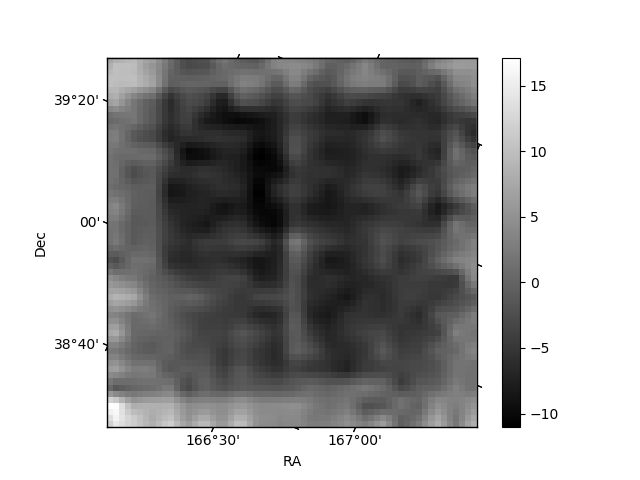
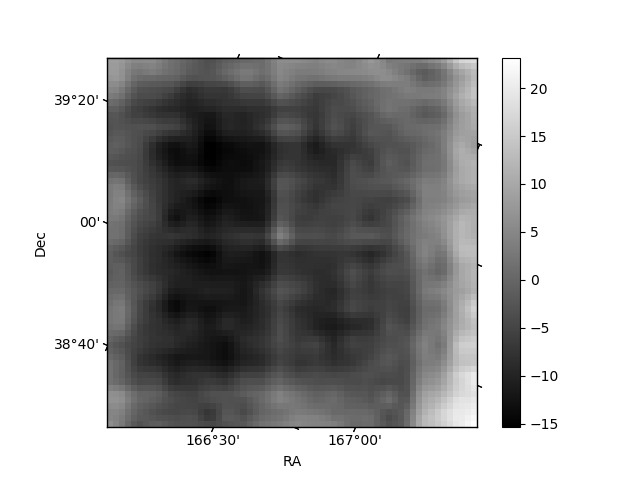
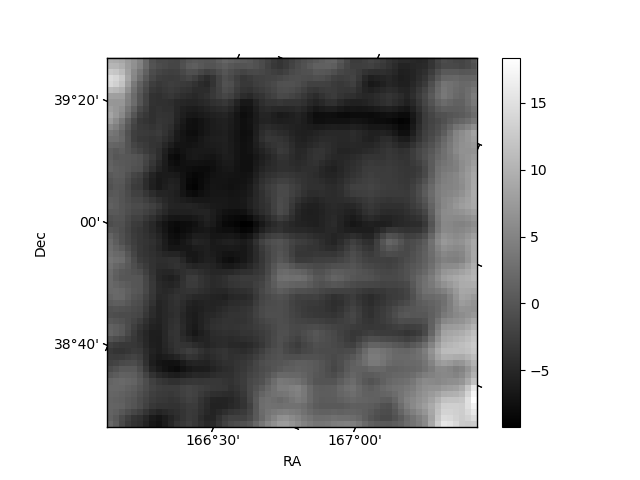
Histogram calculated using DETX and DETY for each event in the final _common_clean file
| Quadrant A | 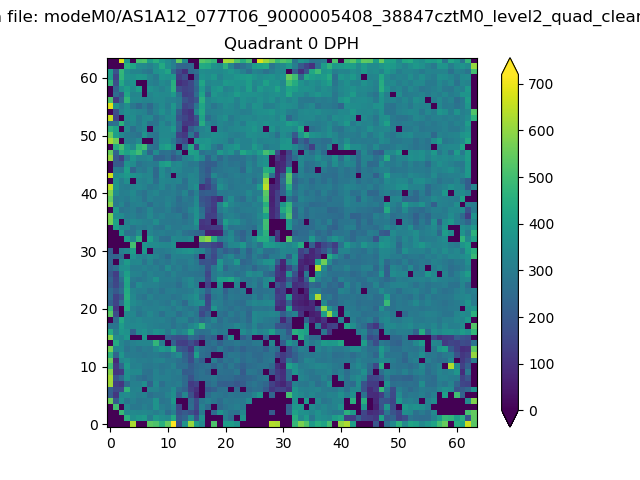 |
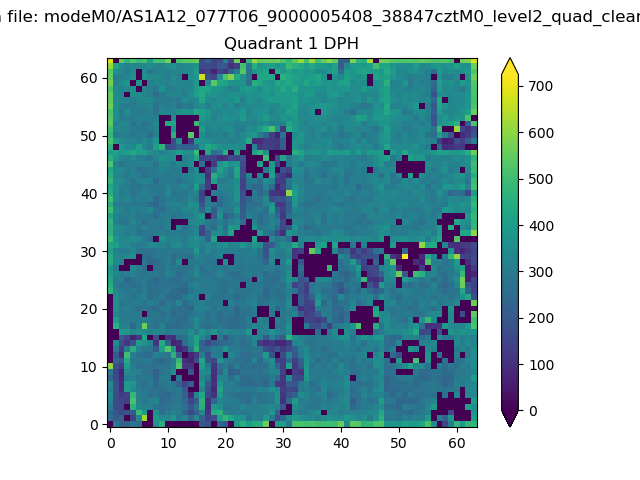 |
Quadrant B |
|---|---|---|---|
| Quadrant D | 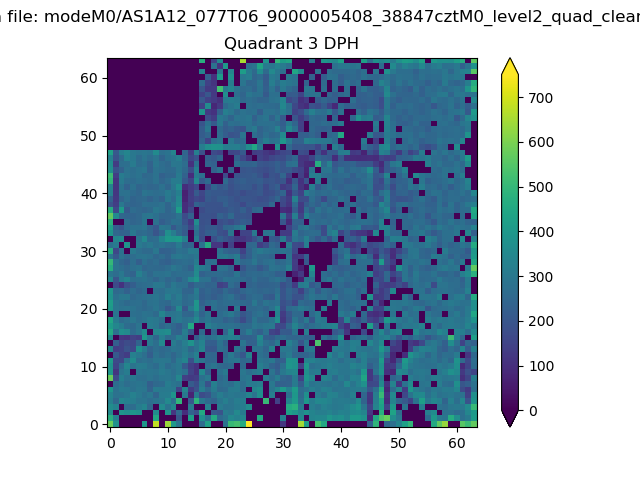 |
 |
Quadrant C |
| Plot type | Count rate plots | Images |
|---|---|---|
| Comparison with Poisson distribution Blue bars denote a histogram of data divided into 1 sec bins. Red curve is a Poisson curve with rate = median count rate of data. |
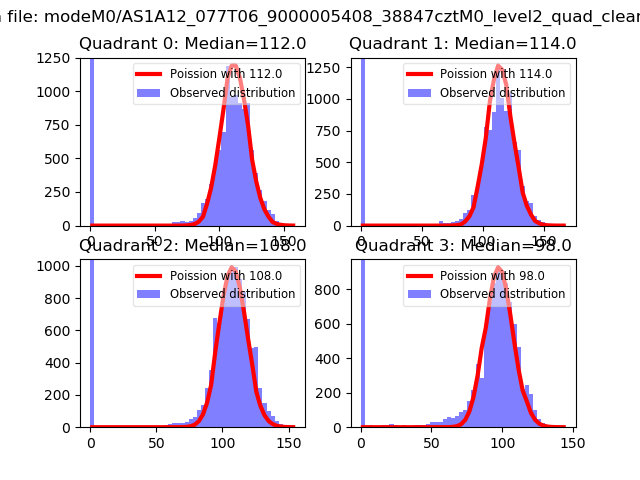 |
 |
| Quadrant-wise count rates Data is divided into 100 sec bins |
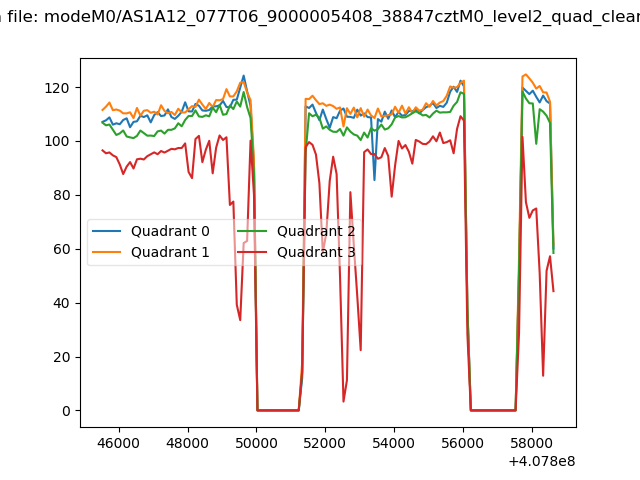 |
|
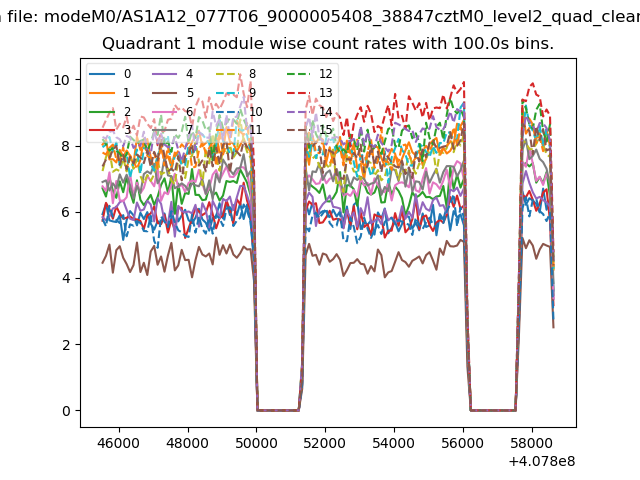
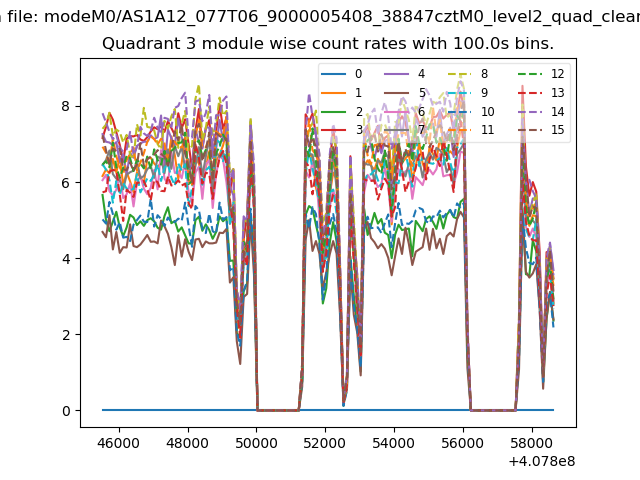
| Module-wise count rates for Quadrant A Data is divided into 100 sec bins |
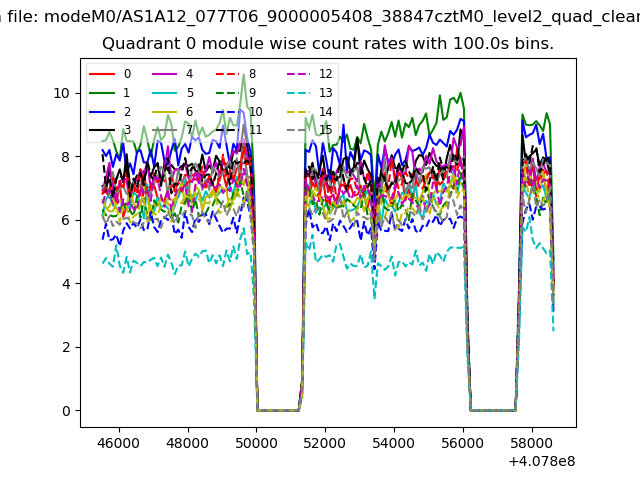 |
 |
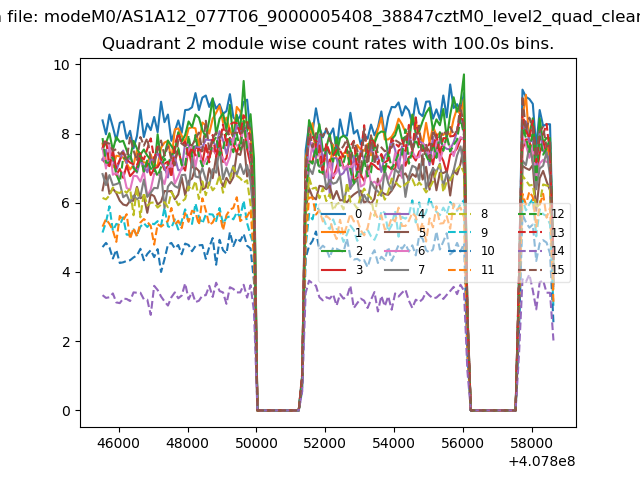
| Module-wise count rates for Quadrant B Data is divided into 100 sec bins |
 |
 |
| Module-wise count rates for Quadrant C Data is divided into 100 sec bins |
 |
 |
| Module-wise count rates for Quadrant D Data is divided into 100 sec bins |
 |
 |
| Parameter | Plot |
|---|---|
| CZT HV Monitor | 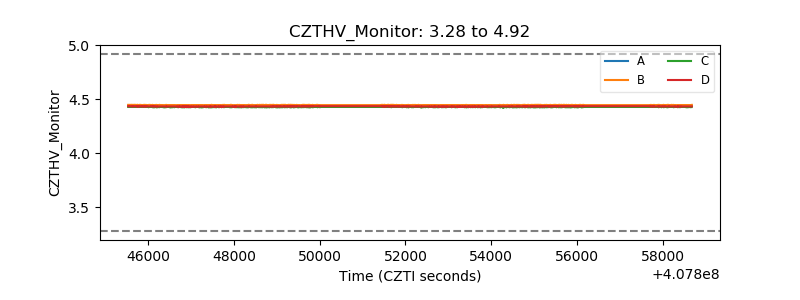 |
| D_VDD | 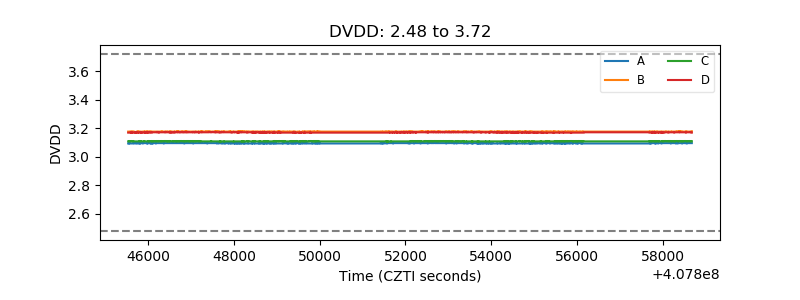 |
| Temperature 1 | 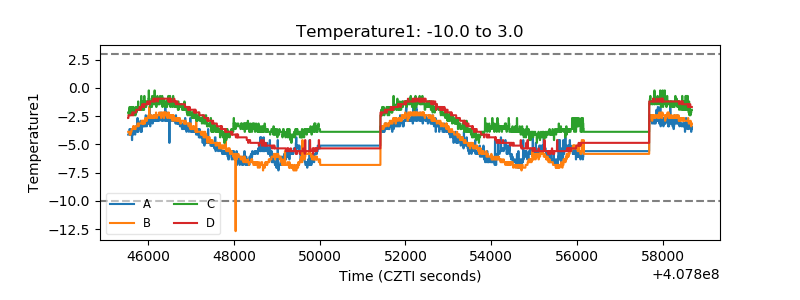 |
| Veto HV Monitor | 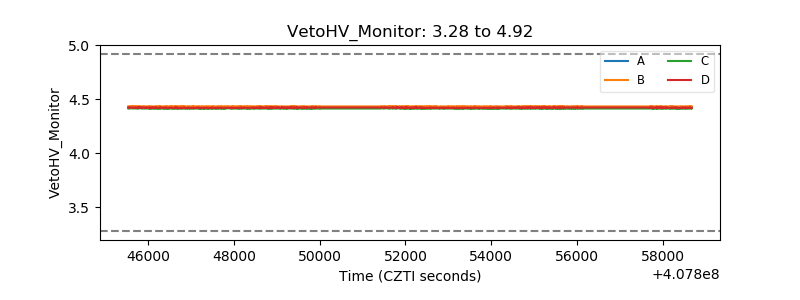 |
| Veto LLD | 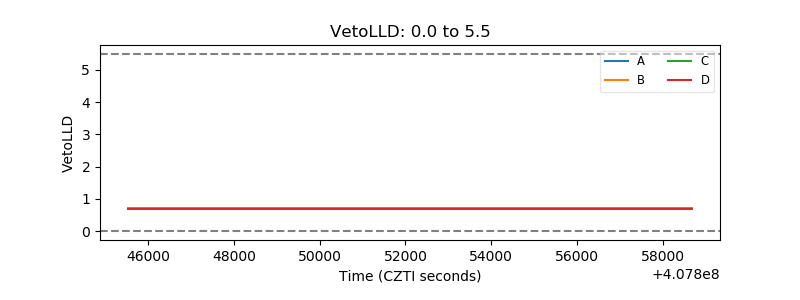 |
| Alpha Counter | 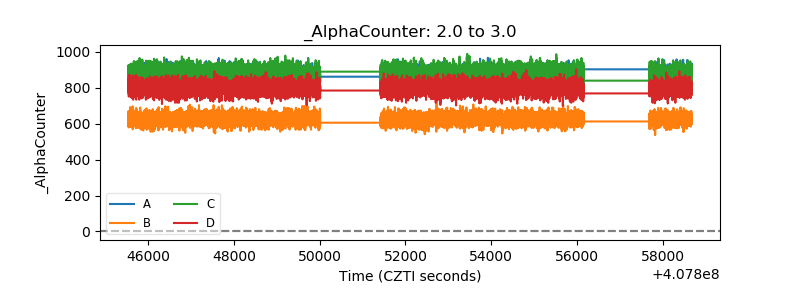 |
| _CPM_Rate | 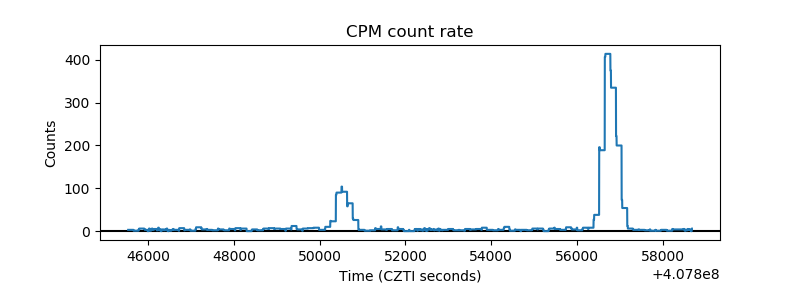 |
| CZT Counter | 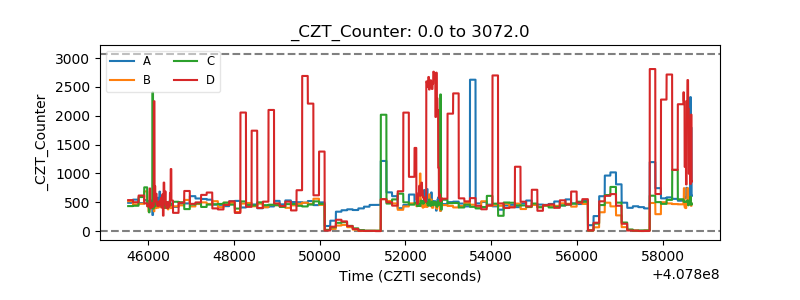 |
| +2.5 Volts monitor | 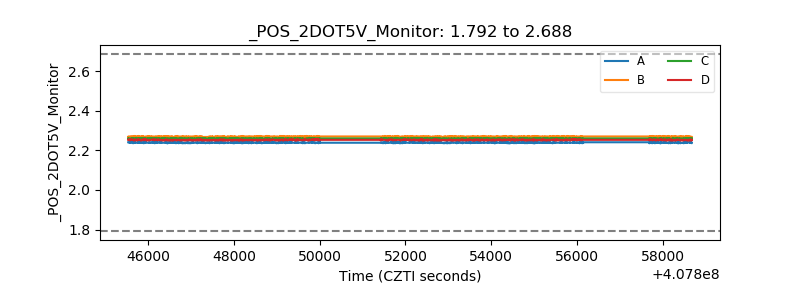 |
| +5 Volts monitor | 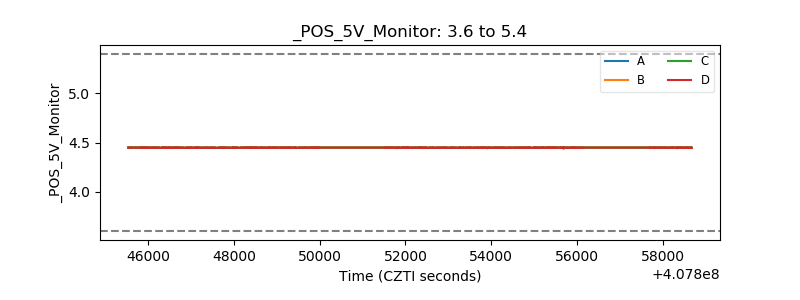 |
| _ROLL_ROT | 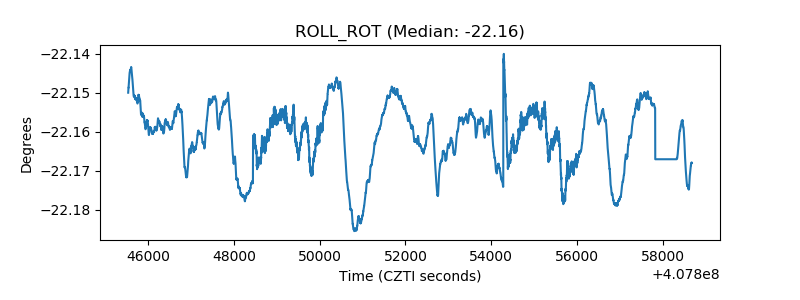 |
| _Roll_DEC | 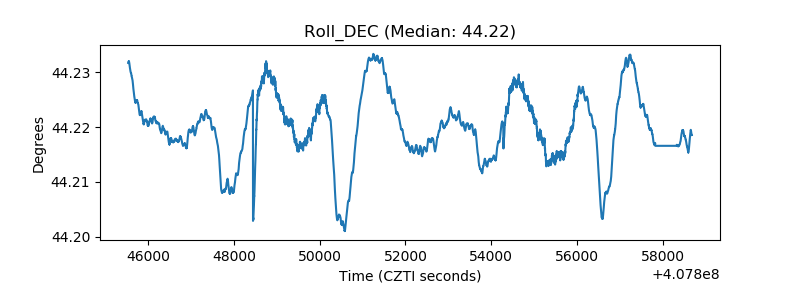 |
| _Roll_RA | 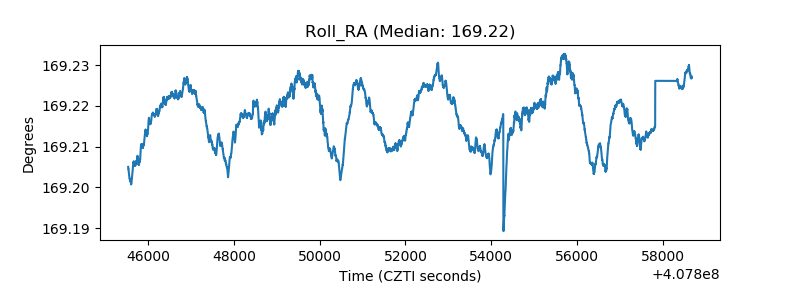 |
| Veto Counter | 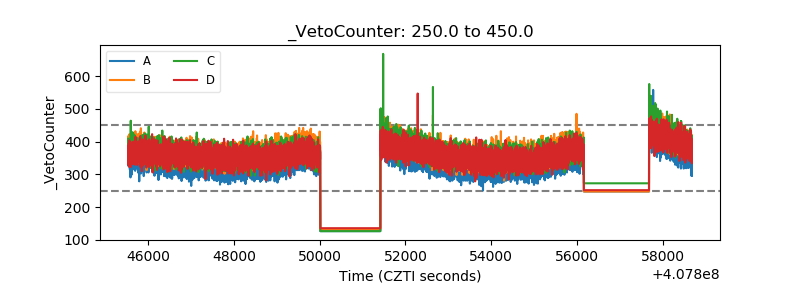 |