| Param | Original file | Final file |
|---|---|---|
| Filename | modeM0/AS1A12_077T06_9000005408_38848cztM0_level2.fits | modeM0/AS1A12_077T06_9000005408_38848cztM0_level2_quad_clean.evt |
| Size (bytes) | 401,731,200 | 93,487,680 |
| Size | 383.1 MB | 89.2 MB |
| Events in quadrant A | 3,057,936 | 650,651 |
| Events in quadrant B | 2,927,076 | 661,073 |
| Events in quadrant C | 2,862,504 | 627,848 |
| Events in quadrant D | 5,585,307 | 497,630 |
| Mode M9 | |||
|---|---|---|---|
| Quadrant | BADHDUFLAG | Total packets | Discarded packets |
| A | 0 | 17 | 0 |
| B | 0 | 17 | 0 |
| C | 0 | 17 | 0 |
| D | 0 | 17 | 0 |
| Mode SS | |||
|---|---|---|---|
| Quadrant | BADHDUFLAG | Total packets | Discarded packets |
| A | 0 | 114 | 0 |
| B | 0 | 114 | 0 |
| C | 0 | 114 | 0 |
| D | 0 | 114 | 0 |
| Mode M0 | |||
|---|---|---|---|
| Quadrant | BADHDUFLAG | Total packets | Discarded packets |
| A | 0 | 12665 | 3 |
| B | 0 | 12493 | 2 |
| C | 0 | 11960 | 2 |
| D | 0 | 20501 | 2 |
| Quadrant | Total seconds | Saturated seconds | Saturation percentage |
|---|---|---|---|
| A | 5626 | 28 | 0.497689% |
| B | 5626 | 79 | 1.404195% |
| C | 5626 | 31 | 0.551013% |
| D | 5627 | 958 | 17.025058% |
Noise dominated data is calculated using 1-second bins in cleaned event files. If a bin has >2000 counts, and if more than 50% of those come from <1% of pixels, then it is considered to be noise-dominated and hence unusable.
| Quadrant | # 1 sec bins | Bins with >0 counts | Bins with >2000 counts | High rate bins dominated by noise | Noise dominated (total time) | Noise dominated (detector-on time) | Marked lightcurve |
|---|---|---|---|---|---|---|---|
| A | 7298 | 5627 | 13 | 13 | 0.18% | 0.23% | 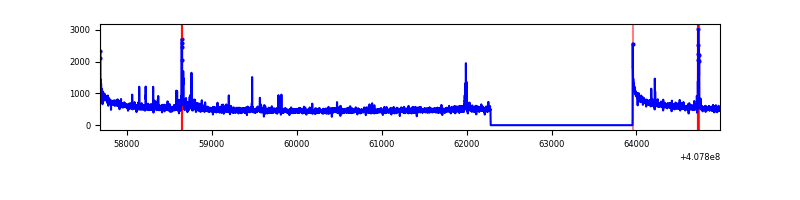 |
| B | 7298 | 5627 | 35 | 35 | 0.48% | 0.62% | 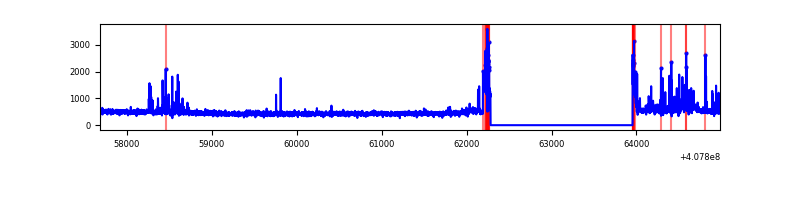 |
| C | 7298 | 5627 | 19 | 19 | 0.26% | 0.34% | 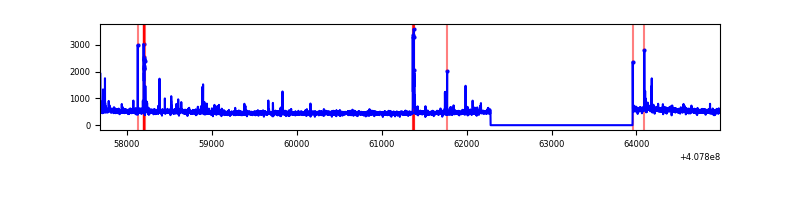 |
| D | 7298 | 5627 | 790 | 790 | 10.82% | 14.04% | 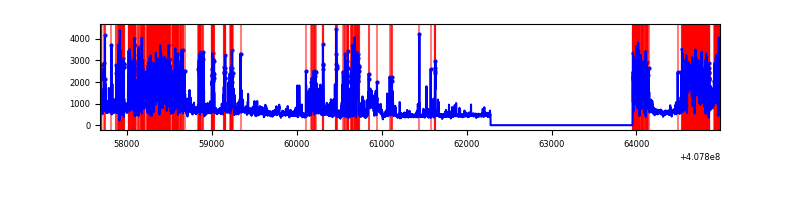 |
Top three noisy pixels from each quadrant. If the there are fewer than three noisy pixels in the level2.evt file, extra rows are filled as -1
| Pixel properties | Quadrant properties | ||||||
|---|---|---|---|---|---|---|---|
| Quadrant | DetID | PixID | Counts | Sigma | Mean | Median | Sigma |
| A | 10 | 83 | 432355 | 3287.99 | 646 | 631 | 131.3 |
| A | 13 | 248 | 68095 | 513.8 | 646 | 631 | 131.3 |
| A | 9 | 143 | 49715 | 373.82 | 646 | 631 | 131.3 |
| B | 5 | 184 | 236490 | 1895.24 | 641 | 625 | 124.5 |
| B | 15 | 85 | 63967 | 508.97 | 641 | 625 | 124.5 |
| B | 4 | 251 | 58047 | 461.4 | 641 | 625 | 124.5 |
| C | 15 | 214 | 233490 | 1574.1 | 633 | 636 | 147.9 |
| C | 14 | 254 | 114736 | 771.32 | 633 | 636 | 147.9 |
| C | 0 | 207 | 31561 | 209.05 | 633 | 636 | 147.9 |
| D | 2 | 250 | 1897807 | 13519.6 | 577 | 560 | 140.3 |
| D | 12 | 235 | 522628 | 3720.21 | 577 | 560 | 140.3 |
| D | 5 | 222 | 329459 | 2343.7 | 577 | 560 | 140.3 |
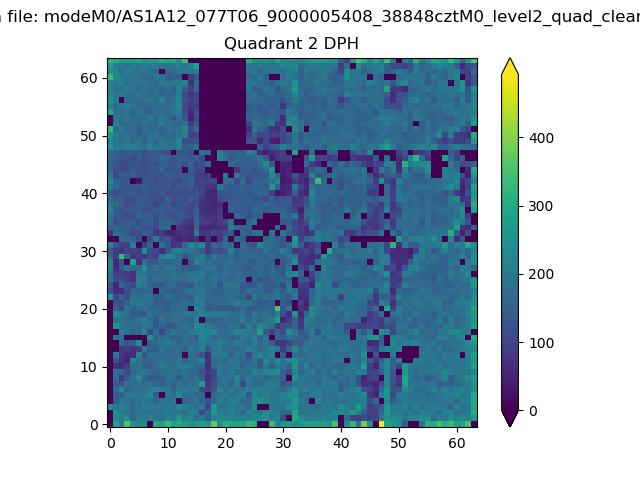
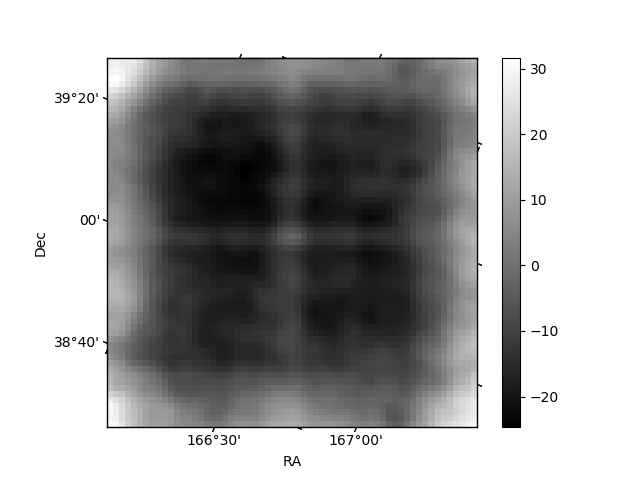
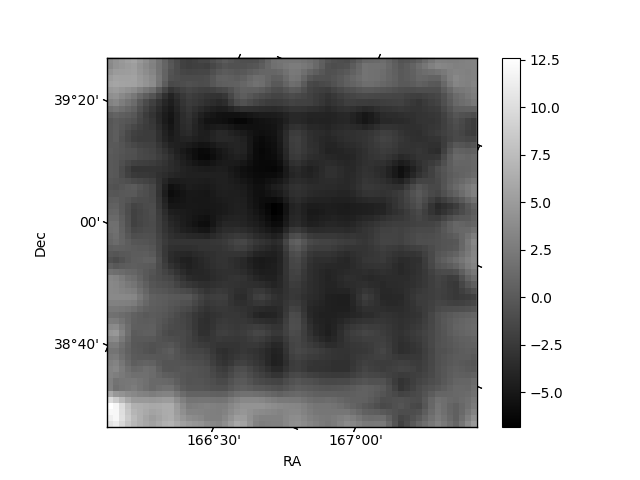
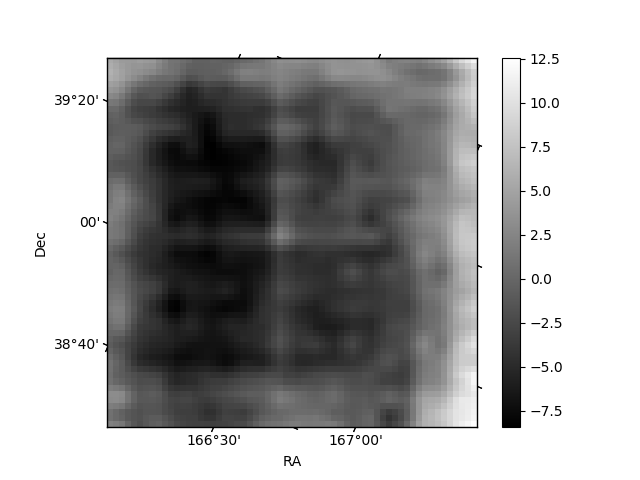
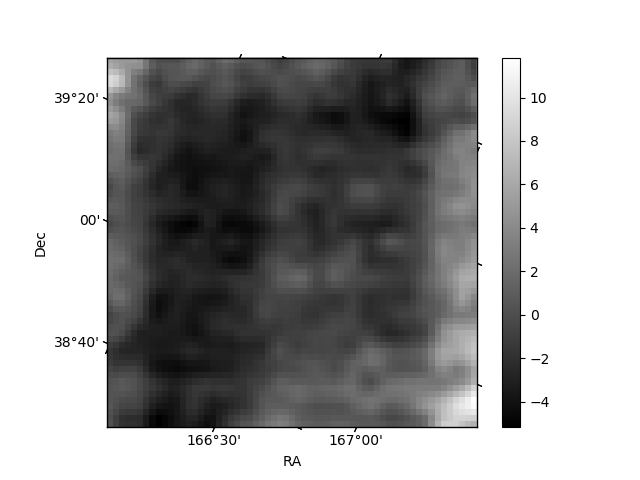
Histogram calculated using DETX and DETY for each event in the final _common_clean file
| Quadrant A | 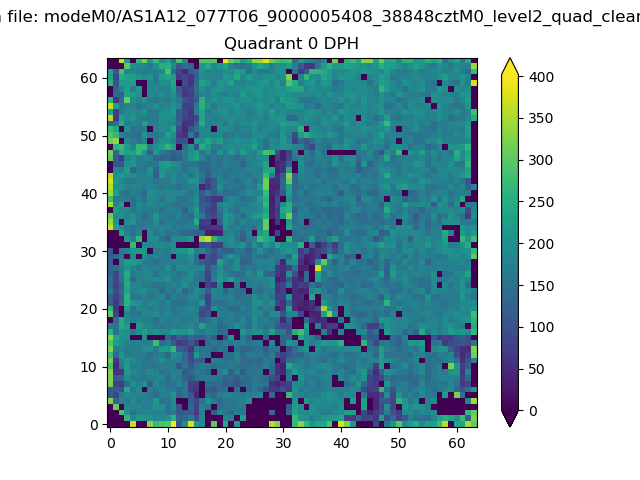 |
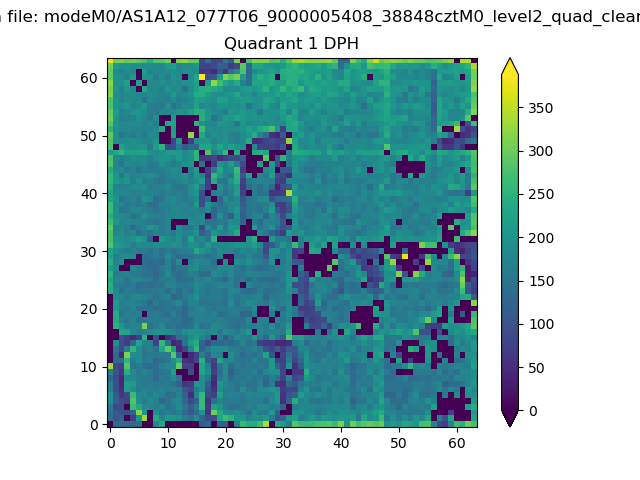 |
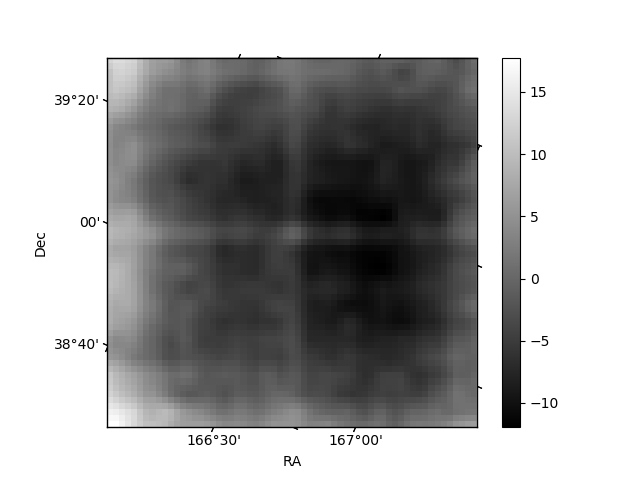
Quadrant B |
|---|---|---|---|
| Quadrant D | 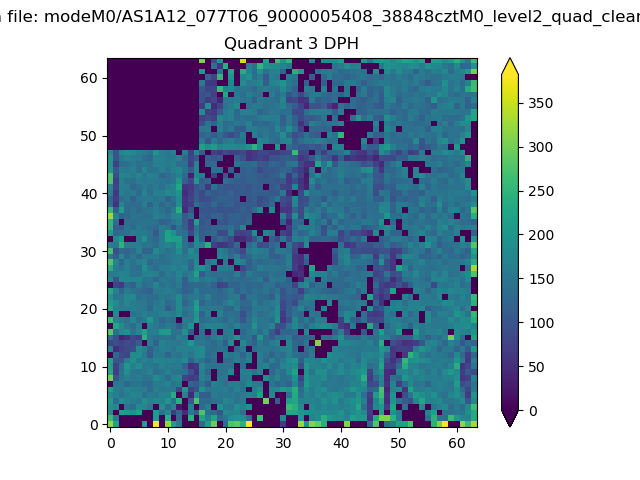 |
 |
Quadrant C |
| Plot type | Count rate plots | Images |
|---|---|---|
| Comparison with Poisson distribution Blue bars denote a histogram of data divided into 1 sec bins. Red curve is a Poisson curve with rate = median count rate of data. |
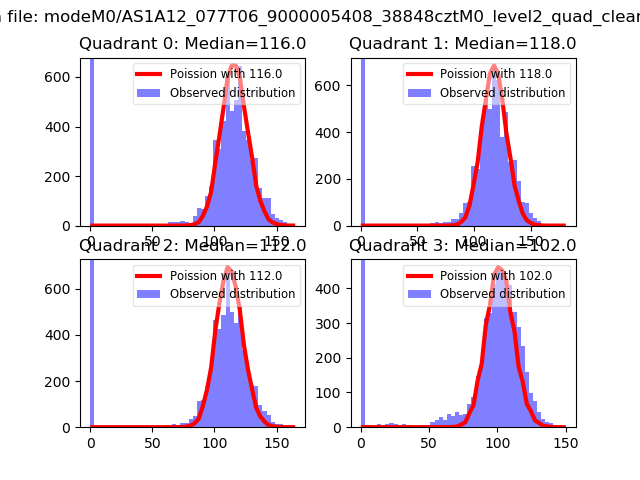 |
 |
| Quadrant-wise count rates Data is divided into 100 sec bins |
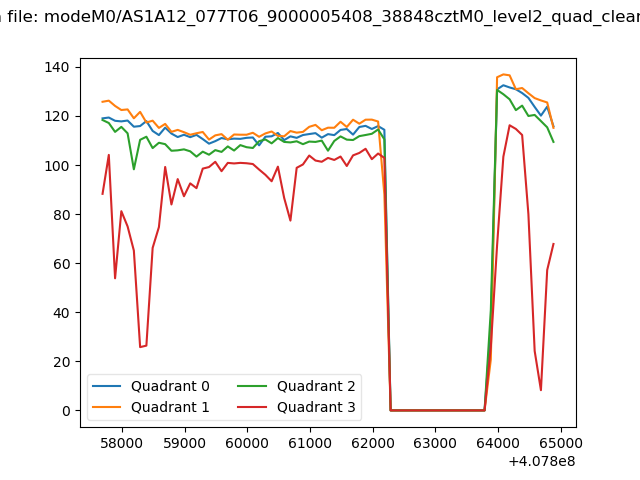 |
|
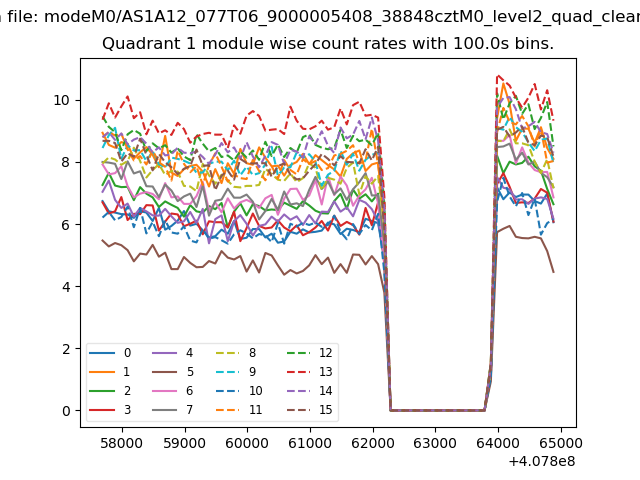
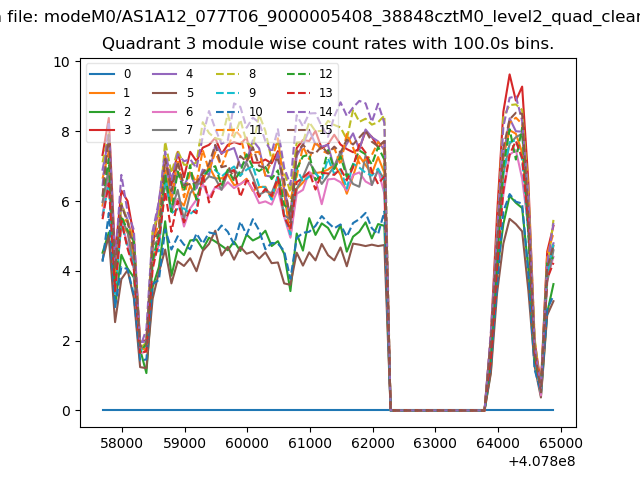
| Module-wise count rates for Quadrant A Data is divided into 100 sec bins |
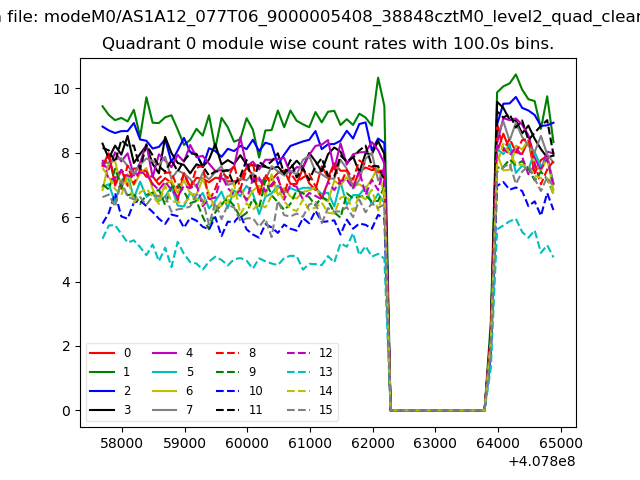 |
 |
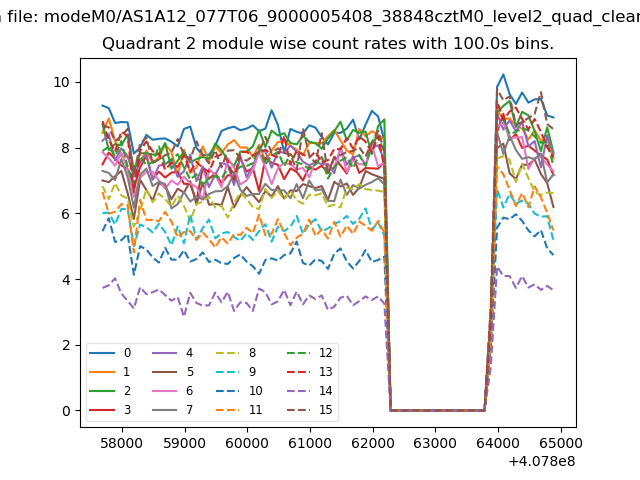
| Module-wise count rates for Quadrant B Data is divided into 100 sec bins |
 |
 |
| Module-wise count rates for Quadrant C Data is divided into 100 sec bins |
 |
 |
| Module-wise count rates for Quadrant D Data is divided into 100 sec bins |
 |
 |
| Parameter | Plot |
|---|---|
| CZT HV Monitor | 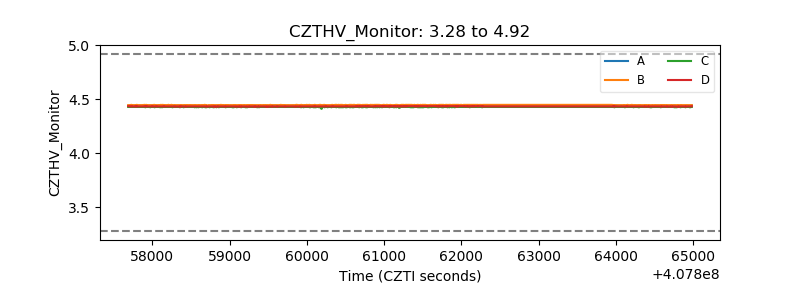 |
| D_VDD | 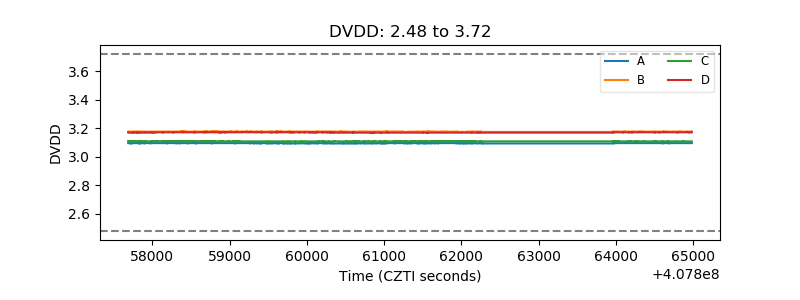 |
| Temperature 1 | 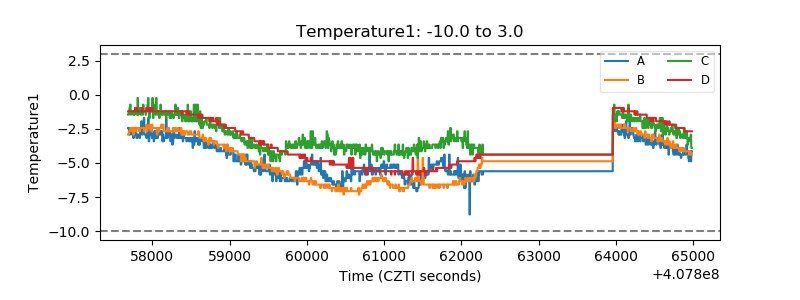 |
| Veto HV Monitor | 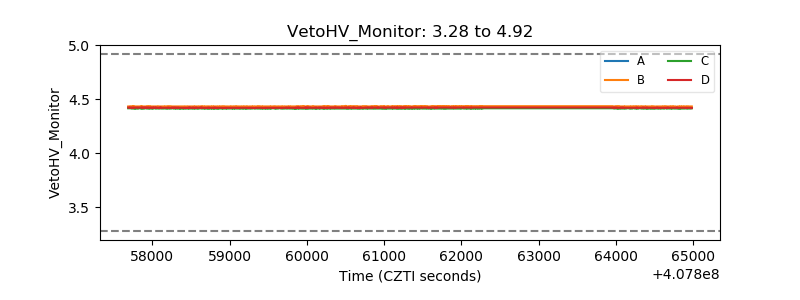 |
| Veto LLD | 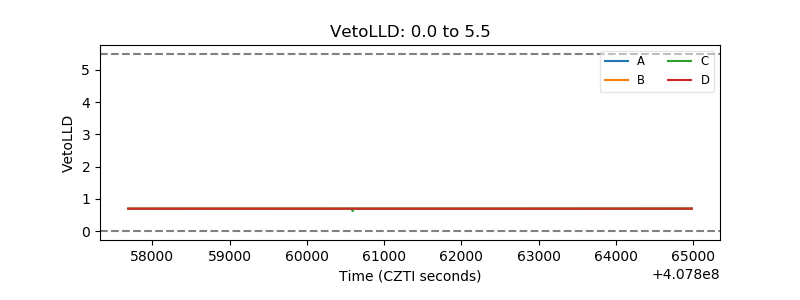 |
| Alpha Counter | 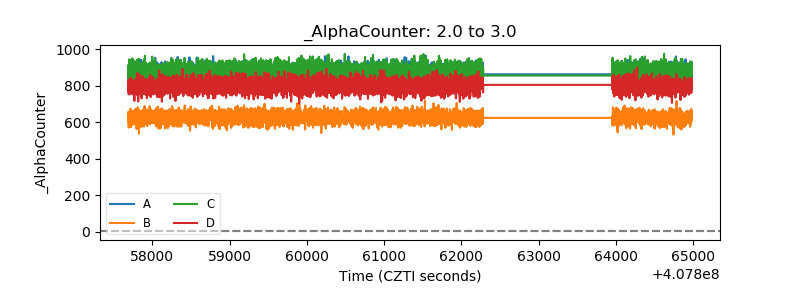 |
| _CPM_Rate |  |
| CZT Counter | 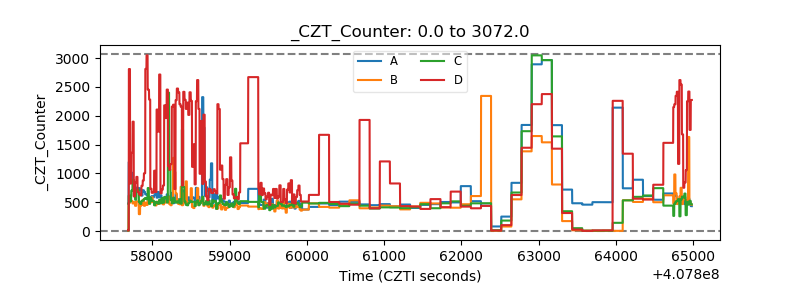 |
| +2.5 Volts monitor | 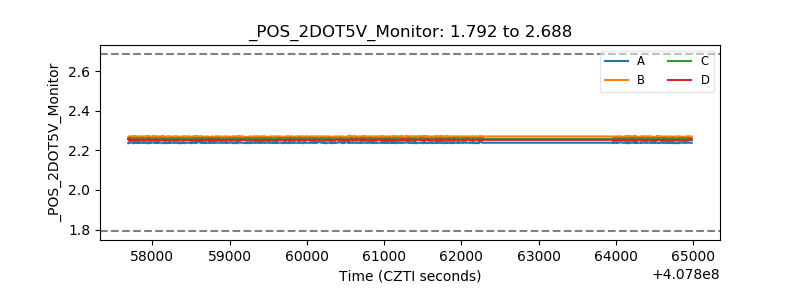 |
| +5 Volts monitor | 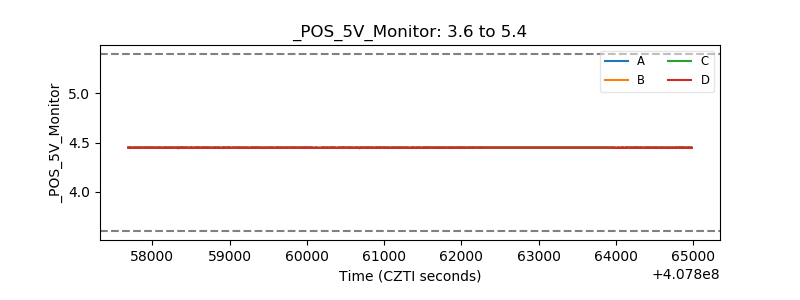 |
| _ROLL_ROT | 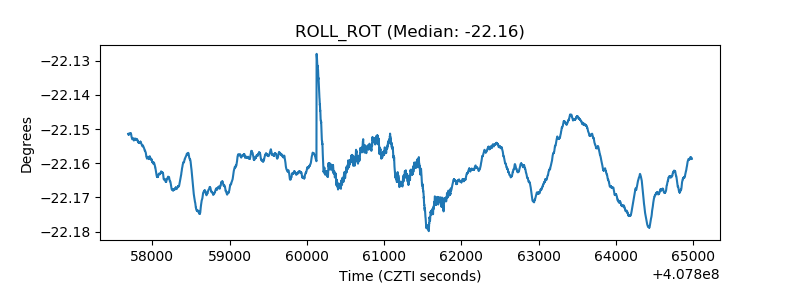 |
| _Roll_DEC | 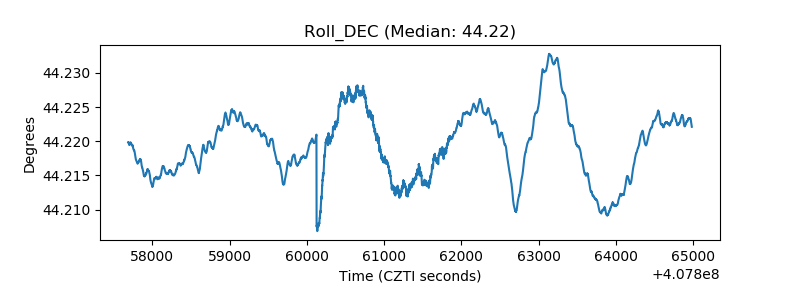 |
| _Roll_RA | 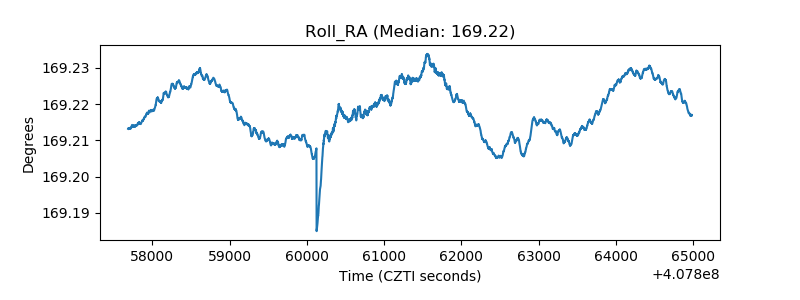 |
| Veto Counter | 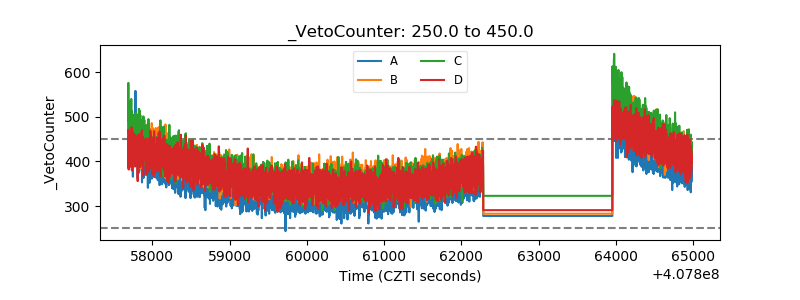 |